Basic Kitchen and Food Service Management

Basic Kitchen and Food Service Management

BC Cook Articulation Committee

Contents

1

Preface

One of the most important aspects of being successful in the food service industry is being able to manage costs. Without managing costs, none of the businesses you might work for over the course of your career would remain open. In this book, we explore the fundamentals of kitchen management from the basic math and calculations you will need to use every day to an overview of the costs associated with operating a kitchen or any food service operation.

Basic Kitchen and Food Service Management is one of a series of Culinary Arts books developed to support the training of students and apprentices in BC’s food service and hospitality industry. Although created with the professional cook, baker, and meat cutter programs in mind, these books have been designed as a modular series and therefore can be used to support a wide variety of programs that offer training in food service skills.

Other books in the series include:

The series has been developed collaboratively with participation from public and private post-secondary institutions.

1

Trade Math

1

Units of Measurement

Canadian cooks should feel comfortable working in three different measurement systems. Two of these systems (U.S. and imperial) are closely related, while the third (S.I., more commonly called metric) is different from the other two.

Although the metric system was introduced in Canada a number of years ago, the food industry and home cooks still rely heavily on equipment and cookbooks imported from the United States. In addition, because we used imperial measurements in Canada for the sale of liquids, some industry recipes will call for imperial measurements rather than U.S. liquid measurements.

The imperial and U.S. measuring systems evolved out of the system used in Europe prior to the 20th century. Although both the imperial and U.S. systems use the same terminology, there are slight differences in actual measurements that you must account for, particularly with volume.

The easiest way to work with the three systems is to have different sets of measuring devices: one for the metric system, one for the imperial system, and one for the U.S. system. Alternatively, you could have one set of devices that have measurements for all three systems indicated. U.S. measuring instruments can be used with slight adjustments for imperial measuring.

It is not good practice to use two systems of measurement when preparing a recipe. Working between two systems of measurement in a recipe may result in inaccuracies that could affect the final product’s taste, yield, consistency, and appearance. To ensure a consistent and successful result, a good practice is to convert the recipe to one standard system of measurement.

The S.I. (Metric) System

Types, Units, and Symbols

All measuring systems have basic units for length, mass (weight), capacity (volume), and temperature. The basic units for the metric system are shown in Table 1.

Type of Measurement Unit Symbol
length (distance) metre m
mass (weight) gram g
capacity (volume) litre L
temperature degrees Celsius °C

Table 1: Basic metric units


Note that the abbreviation or symbol of the unit is not followed by a period and that all the abbreviations are lowercase letters except for litre which is usually a capital L.

In the metric system, the basic units are turned into larger or smaller measurements by using a prefix that carries a specific meaning. The most commonly used prefixes are shown in the bolded areas in Table 2.

Prefix Symbol Meaning
kilo k 1000
hecto h 100
deca da 10
deci d 1/10 or 0.1
centi c 1/100 or 0.01
milli m 1/1000 or 0.001

Table 2: Metric prefixes

When you read a measurement in the metric system, it is fairly easy to translate the measurement into a number of the basic units. For example, 5 kg (five kilograms) is the same as 5 x 1000 (the meaning of kilo) grams or 5000 grams. Or 2 mL (two millilitres) is the same as 2 x 0.001 (the meaning of milli) litres or 0.002 litres. This process is discussed further in the section on converting below.

The most commonly used measurements in commercial kitchens are mass (weight), capacity (volume), and temperature.

Units of Length (Distance)

The basic unit of length or distance in the metric system is the metre. The most frequently used units of length used in the Canadian food industry are the centimetre and millimetre. The units of length in the metric system are shown in Table 3.

Unit Abbreviation Length (Distance)
kilometre km 1000 metres
hectometre hm 100 metres
decametre dam 10 metres
metre m 1 metre
decimetre dm 0.1 metres
centimetre cm 0.01 metres
millimetre mm 0.001 metres

Table 3: Metric units of length (distance)

Units of Mass (Weight)

The basic unit of mass or weight in the metric system is the gram. The most frequently used units of mass or weight used in the Canadian food industry are the gram and kilogram. The units of mass in the metric system are shown in Table 4.

Unit Abbreviation Mass (Weight)
tonne t 1000 kilograms
kilogram kg 1000 gram
hectogram hg 100 grams
decagram dag 10 grams
gram g 1 g
decigram dg 0.1 g
centigram cg 0.01 g
milligram mg 0.001 g

Table 4: Metric units of mass (weight)

Note: Certain metric terminology is not regularly used for ease of production and service. The average cook or chef will not remember how many grams there are on a hecto-, deca-, deci-, or centigram. It is much more practical to write and read 100 grams in a recipe than 1 hectogram.

Units of Capacity (Volume)

The basic unit of volume or capacity is the litre. The most commonly used units in cooking are the litre and the millilitre. The units of volume in the metric system are shown in Table 5.

Unit Abbreviation Volume
kilolitre kL 1000 L
hectolitre hL 100 L
decalitre daL 10 L
litre L 1L
decilitre dL 0.1 L
centilitre cL 0.01 L
millilitre mL 0.001 L

Table 5: Metric units of volume

Occasionally, you will encounter a unit of volume called cubic measurement (sometimes used to express the volume of solids or the capacity of containers), and the units will be expressed as “cc” or cm3 (cubic centimetre). Cubic centimetres are the same as millilitres. That is, 1 cc = 1 cm3 = 1 mL

In the metric system, 1 mL (cc) of water weighs 1 gram. We will explore this later when discussing the difference between measuring by weight and by volume.

2

Temperature

The metric units for temperature are degrees Celsius. There are no other units used. Temperature is one area where you may find it necessary to convert from Celsius to Fahrenheit and vice versa as you probably do not have two ovens or stoves at your disposal. However, many modern stoves and ovens, as well as most thermometers, have both Celsius and Fahrenheit temperatures marked on their controls.

Note: There are many “apps” available for converting measurements. These can easily be downloaded onto a smartphone or tablet and used in the kitchen.

3

Converting within the Metric System

To convert from one unit to another within the metric system usually means moving a decimal point. If you can remember what the prefixes mean, you can convert within the metric system relatively easily by simply multiplying or dividing the number by the value of the prefix.

The most common metric measurements used in the food service industry are kilograms, grams, litres, and millilitres.

Examples of how to convert between measurements

Example 1

Convert 26.75 kg to g.

First, write the question with the meaning of the prefix inserted. In this example, k is the prefix, and k means 1000, so:

26.75 kg = 26.75 x (1000) g = 26 750 g

Notice that there is no comma used in the answer 26 750 g. In the metric system, large numbers are separated every three digits by a space, not a comma.

Example 2

Convert 0.2 L to mL.

Again, write the question with the meaning of the prefix inserted. In this example, m is the prefix, and m means 0.001, so:

0.2 L = _____ (0.001) L

To find the blank (the value of the millilitres), divide the left-hand number by the right-hand number.

0.2 L/0.001 L = 200

This means 0.2 L = 200 mL.

Notice that there is a zero (0) in front of (to the left of) the decimal point. When writing decimal numbers that are smaller than 1 in the metric system, it is customary to place a zero to the left of the decimal point. Thus .6 in the metric system is written 0.6.

If you are working with two prefixes, you can convert in much the same way as above.

Example 3

Find the number of dL in 12.2 mL.

The prefixes are d, which means 0.1, and m, which means 0.001. Insert the values of the prefixes into the conversion.

_____ dL         = 12.2 mL

_____ (0.1) L  = 12.2 (0.001) L

_____ (0.1) L  = 0.0122 L


To find the value of the blank, divide the right-hand number by the left-hand number.


_____ = 0.0122 L/0.1 L = 0.122


This means that 12.2 mL = 0.122 dL.


4

Imperial and U.S. Systems of Measurement

Canada used the U.S. and imperial systems of measurement until 1971 when the S.I. or metric system was declared the official measuring system for Canada, which is now in use in most of the world, with the United States being the major exception. However, “declaring” and “truly adopting” are not always the same.

Because of Canada’s strong ties to the United States, a lot of our food products come from across the border, and many Canadian producers also sell in the U.S. market. This is one of the main reasons Canadians need to know how to work in both systems. Most Canadian packages include both Canadian and U.S. or imperial measurements on the label, and many suppliers still quote prices in cost per pound instead of cost per kilogram.

The most commonly used units of measurement in the U.S. and imperial systems are shown in Table 6.

Type of Measurement Unit Abbreviation
Weight Pound lb. or #
Weight Ounce oz.
Volume Gallon gal.
Volume Quart qt.
Volume Pint pt.
Volume Cup c.
Volume Fluid ounce fl.oz. or oz.
Volume Tablespoon Tbsp. or tbsp.
Volume Teaspoon tsp.
Length Mile m.
Length Yard yd.
Length Foot ft. or ‘
Length Inch in. or “

Table 6: U.S. and imperial units of measurement

Note: There is sometimes confusion about the symbol #. When # is used in front of a number, such as in #10, the # is read as the word number. Thus, #10 is read as number 10. When the # follows a number, the # is read as pounds. Thus, 10# is read as 10 pounds.

Differences between the U.S. and Imperial Systems

The only difference between the imperial system and the U.S. system is in volume measurements. Not only are the number of ounces in pints, quarts, and gallons all larger in the imperial system, the size of one fluid ounce is also different, as shown in the table in Table 7.

Unit of Measurement Imperial System Metric Equivalent U.S. System Metric Equivalent
1 ounce 1 (fluid) oz. 28.41 mL 1 (fluid) oz. 29.57 mL
1 gill 5 (fluid) oz. 142.07 mL Not commonly used
1 cup Not commonly used 8 (fluid) oz. 236.59 mL
1 pint 20 (fluid) oz. 568.26 mL 16 (fluid) oz. 473.18 mL
1 quart 40 (fluid) oz. 1.137 L 32 (fluid) oz. 946.36 mL
1 gallon 160 (fluid) oz. 4.546 L 128 (fluid) oz. 3.785 L

Table 7: Differences between U.S. and imperial volume measurements

Where you will notice this most is with any liquid products manufactured in Canada; these products will show the metric conversion using imperial measurement, but any products originating in the United States will show the conversion using U.S. measurements. For example, if you compare 12 fl. oz. bottles or cans of soft drinks or beer, you will see that American brands contain 355 mL (12 fl. oz. U.S.) and Canadian brands contain 341 mL (12 fl. oz. imperial).

If you are using a recipe written in cups and ounces, always verify the source of your recipe to determine if it has been written using the U.S. or imperial system of measurement. The difference in volume measurements can be quite noticeable when producing large quantities.

If the recipe is from the United States, use U.S. measurements for the conversion, if the recipe originated in the United Kingdom, Australia, or any other country that was once part of the British Empire, use imperial for the conversion.

Converting between Units in the Imperial and U.S. Systems

On occasion, you may need to convert between the various units of volume and between units of volume and units of weight in the U.S. system. To do this, you must know the equivalents for each of the units as shown in Table 8.

Types of Measurement Conversion
Weight 1 pound = 16 ounces
Volume (U.S.) 1 gallon = 4 quarts or 128 (fluid) ounces
Volume (U.S.) 1 quart = 2 pints or 4 cups or 32 (fluid) ounces
Volume (U.S.) 1 pint = 2 cups or 16 (fluid) ounces
Volume (U.S.) 1 cup= 8 (fluid) ounces or 16 tablespoons
Volume (U.S.) 1 (fluid) ounce = 2 tablespoons
Volume (U.S.) 1 tablespoon = 3 teaspoons
Volume (imperial) 1 gallon = 4 quarts or 160 (fluid) ounces
Volume (imperial) 1 quart = 2 pints or 40 (fluid) ounces
Volume (imperial) 1 pint = 20 (fluid) ounces
Volume (imperial) 1 gill = 5 (fluid) ounces or 10 tablespoons
Volume (imperial) 1 (fluid) ounce = 2 tablespoons
Volume (imperial) 1 tablespoon = 3 teaspoons
Length 1 mile = 1760 yards
Length 1 yard = 3 feet
Length 1 foot = 12 inches

Note: One fluid ounce (usually called, simply, ounce) of water weighs approximately one ounce.

Table 8: Equivalent measures within the U.S. and Imperial system

To convert from one unit to another, you either divide or multiply, depending on whether you are converting a smaller unit to a larger one, or a larger unit or to a smaller one.

Converting Smaller to Larger Units

To convert from a smaller to a larger unit, you need to divide. For example, to convert 6 tsp. to tablespoons, divide the 6 by the number of teaspoons in one tablespoon, which is 3 (see Table 8).

6 tsp    = __ tbsp.

6/3       = 2

6 tsp.   = 2 tbsp.

To convert ounces to cups, you need to divide by 8 since there are 8 oz. in 1 cup. For example, if you need to convert 24 oz. to cups, you have to divide 24 by 8.

24 oz.  = __ cups

24/8     = 3

24 oz.  = 3 cups

Converting Larger to Smaller Units

To change larger units to smaller, you have to multiply the larger unit by the number of smaller units in that unit. For example, to convert quarts to pints, you have to multiply the number of quarts by 2 because there are 2 pts. in 1 qt. Therefore, to convert 6 qts. to pints you need to multiply:

6 qts.   = __ pts.

6 x 2    = 12

6 qts.   = 12 pts.

To convert cups to tablespoons, you need to multiply by 16 since there are 16 tbsp. in 1 cup.

3/4 cup            = __ tbsp.

16 x 3/4           = 12

3/4 cup            = 12 tbsp.

Converting between Metric and Imperial/U.S. Measurement Systems

You can convert between metric and imperial or U.S. measurements with straightforward multiplication or division if you know the conversion ratios. Table 9 is a good reference, but there are also many online converters or apps available to make this task easier.

Converting from Metric: When You know Converting to Metric: Divide by To get When you know Multiply by To get
millilitres 4.93 teaspoons teaspoons 4.93 millilitres
millilitres 14.79 tablespoons tablespoons 14.79 millilitres
millilitres 28.41 fluid ounces (imperial) fluid ounces (imperial) 28.41 millilitres
millilitres 29.57 fluid ounces (U.S.) fluid ounces (U.S.) 29.57 millilitres
millilitres 236.59 cups cups 236.59 millilitres
litres 0.236 cups cups 0.236 litres
millilitres 473.18 pints (U.S.) pints (U.S.) 473.18 millilitres
litres 0.473 pints (U.S.) pints (U.S.) 0.473 litres
millilitres 568.26 pints (imperial) pints (imperial) 568.26 millilitres
litres 0.568 pints (imperial) pints (imperial) 0.568 litres
millilitres 946.36 quarts (U.S.) quarts (U.S.) 946.36 millilitres
litres 0.946 quarts (U.S.) quarts (U.S.) 0.946 litres
millilitres 1137 quarts (imperial) quarts (imperial) 1137 millilitres
litres 1.137 quarts (imperial) quarts (imperial) 1.137 litres
litres 3.785 gallons (U.S.) gallons (U.S.) 3.785 litres
litres 4.546 gallons (imperial) gallons (imperial) 4.546 litres
grams 28.35 ounces ounces 28.35 grams
grams 454 pounds pounds 454 grams
kilograms 0.454 pounds pounds 0.454 kilograms
centimetres 2.54 inches inches 2.54 centimetres
millimetres 25.4 inches inches 25.4 millimetres
Celsius (Centigrade) multiply by 1.8 and add 32 Fahrenheit Fahrenheit subtract 32 and divide by 1.8 Celsius (Centigrade)

Table 9: Metric and imperial/U.S. conversions

Table 10 lists the most common U.S. measurements and metric units of measure, and their equivalents used in professional kitchens. Table 11 presents the conversion factors.

Length Unit Equivalent
 Length 1 inch 25.4 millimetres
 Length 1 centimetre 0.39 inches
 Length 1 metre 39.4 inches
Volume Unit Equivalent
 Volume 1 fluid ounce (U.S.) 29.57 millilitres
 Volume 1 cup 237 millilitres
 Volume 1 quart 946 millilitres
 Volume 1 millilitre 0.034 fluid ounces
 Volume 1 litre 33.8 fluid ounces
Weight Unit Equivalent
 Weight 1 ounce 28.35 grams
 Weight 1 pound 454 grams
 Weight 1 gram 0.035 ounce
 Weight 1 kilogram 2.205 pounds

Table 10: Common Metric and U.S. conversions

Length To Convert Multiply by Result
 Length Inches to millimeters 25.4 1 inch = 25.4 mm
 Length Inches to centimetres 2.54 1 inch = 2.54 cm
 Length Millimetres to inches 0.03937 1 mm = 0.03937 in.
 Length Centimetres to inches 0.3937 1 cm = 0.3937 in.
 Length Metres to inches 39.3701 1m = 39.37 in.
Volume To Convert Multiply by Result
 Volume Quarts to litres 0.946 1 qt. = 0.946 L
 Volume Litres to fluid ounces (U.S.) 33.8 1 L = 33.8 oz.
 Volume Quarts to millilitres 946 1 qt. = 946 mL
 Volume Millilitres to ounces 0.0338 1 mL = 0.0338 oz.
 Volume Litres to quarts 1.05625 1 L = 1.05625 qt.
Weight To Convert Multiply by Result
 Weight Ounces to grams 28.35 1 oz. = 28.35 g
 Weight Grams to ounces 0.03527 1 g = 0.03527 oz.
 Weight Kilograms to pounds 2.2046 1 kg = 2.2046 lb.

Table 11: Metric and U.S. Equivalents and Conversions

Soft Conversions

Many times, cooks will use what are called “soft conversions” rather than exact conversions, especially in small batch recipes where a slight variation can be tolerated, as it is often difficult to measure very fine quantities using liquid measures. This is a shortcut that can be used if you are faced with only a set of metric measuring tools and a U.S. recipe (or vice versa). Table 12 lists the common soft conversions.

Soft Conversions

Metric U.S. Measurements
1 millilitre 1/4 teaspoon
2 millilitres 1/2 teaspoon
5 millilitres 1 teaspoon
15 millilitres 1 tablespoon
30 millilitres 1 fluid ounce
250 millilitres 1 cup
500 millilitres 1 pint
1 litre 1 quart
4 litres 1 gallon

Table 12: Soft conversions

Types of Measurements Used in the Kitchen

There are three types of measurements used to measure ingredients and to serve portions in the restaurant trade. Measurement can be by volume, by weight, or by count.

Recipes may have all three types of measurement. A recipe may call for 3 eggs (measurement by count), 250 mL of milk (measurement by volume), and 0.5 kg of cheese (measurement by weight).

There are formal and informal rules governing which type of measurement should be used. There are also specific procedures to ensure that the measuring is done accurately and consistently.

Number or Count

Number measurement is only used when accurate measurement is not critical and the items to be used are understood to be close in size.

For example, “3 eggs” is a common measurement called for in recipes, not just because 3 is easy to count but also because eggs are graded to specific sizes. Most recipes call for large eggs unless stated otherwise.

Numbers are also used if the final product is countable. For example, 24 premade tart shells would be called for if the final product is to be 24 filled tart shells.

Volume

Volume measurement is usually used with liquids or fluids because such items are awkward to weigh. It is also used for dry ingredients in home cooking, but it is less often used for dry measurement in the industry.

Volume is often the measure used when portioning sizes of finished product. For example, portion scoops are used to dole out vegetables, potato salad, and sandwich fillings to keep serving size consistent. Ladles of an exact size are used to portion out soups and sauces.

Often scoops and ladles used for portioning are sized by number. On a scoop, such a number refers to the number of full scoops needed to fill a volume of one litre or one quart. Ladles are sized in millilitres or ounces.

Weight

Weight is the most accurate way to measure ingredients or portions. When proportions of ingredients are critical, their measurements are always given in weights. This is particularly true in baking where it is common to list all ingredients by weight, including eggs (which, as mentioned earlier, in almost all other applications are called for by count). Whether measuring solids or liquids, measuring by weight is more reliable and consistent.

Weighing is a bit more time consuming and requires the use of scales, but it pays off in accuracy. Digital portion scales are most commonly used in industry and come in various sizes to measure weights up to 5 kg (11 lbs.). This is adequate for most recipes, although larger operations may require scales with a larger capacity.

The reason weight is more accurate than volume is because it takes into account factors such as density, moisture, and temperature that can have an effect on the volume of ingredients. For example, 250 mL (1 cup) of brown sugar (measured by volume) could change drastically depending on whether it is loosely or tightly packed in the vessel. On the other hand, 500 grams (17.63 oz.) of brown sugar, will always be 500 grams (17.63 oz.).

Even flour, which one might think is very consistent, will vary from location to location, and the result will mean an adjustment in the amount of liquid needed to get the same consistency when mixed with a given volume.

Another common mistake is interchanging between volume and weight. The only ingredient that will have the same volume and weight consistently is water: 1 L of water = 1 kg of water.

There is no other ingredient that can be measured interchangeably because of gravity and the density of an item. Every ingredient has a different density and different gravitational weight, which will also change according to location. This is called specific gravity. Water has a specific gravity of 1.0. Liquids that are lighter than water (such as oils that float on water) have a specific gravity of less than 1.0. Those that are heavier than water and will sink, such as molasses, have a specific gravity greater than 1.0. Unless you are measuring water, remember not to use a volume measure for a weight measure, and vice versa.

Example

1 L water = 1 kg water

1 L water + 1 L canola oil = 2 L of water and oil mixture (volume)

1 L water + 1 L canola oil = 1.92 kg (weight)

In order to convert your existing recipes that only call for volume measurement to weight, you will need to measure each ingredient by volume, weigh it, and then record the amount in your recipe. There are also tools that can help with this conversion.

5

Converting and Adjusting Recipes and Formulas

Recipes often need to be adjusted to meet the needs of different situations. The most common reason to adjust recipes is to change the number of individual portions that the recipe produces. For example, a standard recipe might be written to prepare 25 portions. If a situation arises where 60 portions of the item are needed, the recipe must be properly adjusted.

Other reasons to adjust recipes include changing portion sizes (which may mean changing the batch size of the recipe) and better utilizing available preparation equipment (for example, you need to divide a recipe to make two half batches due to a lack of oven space).

Conversion Factor Method

The most common way to adjust recipes is to use the conversion factor method. This requires only two steps: finding a conversion factor and multiplying the ingredients in the original recipe by that factor.

Finding Conversion Factors

To find the appropriate conversion factor to adjust a recipe, follow these steps:

1. Note the yield of the recipe that is to be adjusted. The number of portions is usually included at the top of the recipe (or formulation) or at the bottom of the recipe. This is the information that you HAVE.

2. Decide what yield is required. This is the information you NEED.

3. Obtain the conversion factor by dividing the required yield (from Step 2) by the old yield (from Step 1). That is,

conversion factor = (required yield)/(recipe yield)

conversion factor = what you NEED ÷ what you HAVE

Example

To find the conversion factor needed to adjust a recipe that produces 25 portions to produce 60 portions, these are steps you would take:

1. Recipe yield = 25 portions

2. Required yield = 60 portions

3. Conversion factor = (required yield)/(recipe yield)

= 60 portions/25 portions

= 2.4

If the number of portions and the size of each portion change, you will have to find a conversion factor using a similar approach:

1. Determine the total yield of the recipe by multiplying the number of portions and the size of each portion.

2. Determine the required yield of the recipe by multiplying the new number of portions and the new size of each portion.

3. Find the conversion factor by dividing the required yield (Step 2) by the recipe yield (Step 1). That is,

conversion factor = (required yield)/(recipe yield)

Example

For example, to find the conversion factor needed to change a recipe that produces 20 portions with each portion weighing 150 g into a recipe that produces 60 portions with each portion containing 120 g, these are the steps you would take:

1. Old yield of recipe = 20 portions x 150 g per portion = 3000 g

2. Required yield of recipe = 40 portions x 120 g per portion = 4800 g

3. Conversion factor = required yield/old yield = 4800/3000 = 1.6


Key Takeaway

To ensure you are finding the conversion factor properly, remember that if you are increasing your amounts, the conversion factor will be greater than 1. If you are reducing your amounts, the factor will be less than 1.

Adjusting Recipes Using Conversion Factors

Now that you have the conversion factor, you can use it to adjust all the ingredients in the recipe. The procedure is to multiply the amount of each ingredient in the original recipe by the conversion factor. Before you begin, there is an important first step:

Converting to weight is particularly important for dry ingredients. Most recipes in commercial kitchens express the ingredients by weight, while most recipes intended for home cooks express the ingredients by volume. If the amounts of some ingredients are too small to weigh (such as spices and seasonings), they may be left as volume measures. Liquid ingredients also are sometimes left as volume measures because it is easier to measure a litre of liquid than it is to weigh it. However, a major exception is measuring liquids with a high sugar content, such as honey and syrup; these should always be measured by weight, not volume.

Converting from volume to weight can be a bit tricky and may require the use of tables that provide the approximate weight of different volume measures of commonly used recipe ingredients. Once you have all ingredients in weight, you can then multiply by the conversion factor to adjust the recipe.

When using U.S. or imperial recipes, often you must change the quantities of the original recipe into smaller units. For example, pounds may need to be expressed as ounces, and cups, pints, quarts, and gallons must be converted into fluid ounces.

Converting an Imperial/U.S. Measuring System Recipe

The following example will show the basic procedure for adjusting a recipe using U.S. measurements.

Example

Adjust a standard formulation (Table 13) designed to produce 75 biscuits to have a new yield of 300 biscuits.

Ingredient Amount
Flour 3¼ lbs.
Baking Powder 4 oz.
Salt 1 oz.
Shortening 1 lb.
Milk 6 cups

Table 13: Table of ingredients for conversion recipe in U.S. system


Solution

Step 1: Find the conversion factor.

conversion factor = new yield/old yield

= 300 biscuits/75 biscuits

= 4

Step 2: Multiply the ingredients by the conversion factor. This process is shown in Table 14.

Ingredient Original Amount (U.S.) Conversion Factor New Ingredient Amount
Flour 3¼ lbs. 4 13 lbs.
Baking powder 4 oz. 4 16 oz. (= 1 lb.)
Salt 1 oz. 4 4 oz.
Shortening 1 lb. 4 4 lbs.
Milk 6 cups 4 24 cups (= 6 qt. or 1½ gal.)

Table 14: Table of ingredients for recipe adjusted in U.S. system


Converting an Imperial Measuring System Recipe

The process for adjusting an imperial measure recipe is identical to the method outlined above. However, care must be taken with liquids as the number of ounces in an imperial pint, quart, and gallon is different from the number of ounces in a U.S. pint, quart, and gallon. (If you find this confusing, refer back to Table 7 and the discussion on imperial and U.S. measurements.)

Converting a Metric Recipe

The process of adjusting metric recipes is the same as outlined above. The advantage of the metric system becomes evident when adjusting recipes, which is easier with the metric system than it is with the U.S. or imperial system. The relationship between a gram and a kilogram (1000 g = 1 kg) is easier to remember than the relationship between an ounce and a pound or a teaspoon and a cup.

Example

Adjust a standard formulation (Table 15) designed to produce 75 biscuits to have a new yield of 150 biscuits.

Ingredient Amount
Flour 1.75 kg
Baking powder 50 g
Salt 25 g
Shortening 450 g
Milk 1.25 L

Table 15: Table of ingredients for conversion recipe in metric system

Solution

Step 1: Find the conversion factor.

conversion factor = new yield/old yield

= 150 biscuits/75 biscuits

= 2

Step 2: Multiply the ingredients by the conversion factor. This process is shown in Table 16.

Ingredient Original Amount (metric) Conversion Factor New Ingredient Amount
Flour 1.75 kg 2 3.5 kg
Baking powder 50 g 2 100 g
Salt 25 g 2 50 g
Shortening 450 g 2 900 g
Milk 1.25 L 2 2.5 L

Table 16: Table of ingredients for recipe adjusted in metric system

Cautions when Converting Recipes

Although recipe conversions are done all the time, several problems can occur. Some of these include the following:

The fine adjustments that have to be made when converting a recipe can only be learned from experience, as there are no hard and fast rules. Generally, if you have recipes that you use often, convert them, test them, and then keep copies of the recipes adjusted for different yields, as shown in Table 17.

Cheese Puffs

Yield 30

90 g Butter
135 mL Milk
135 mL Water
5 mL Salt
150 g Sifted flour
3 Large eggs
75 g Grated cheese
To taste Cracked pepper

Yield 60

180 g Butter
270 mL Milk
270 mL Water
10 mL Salt
300 g Sifted flour
6 Large eggs
150 g Grated cheese
To taste Cracked pepper

Yield 90

270 g Butter
405 mL Milk
405 mL Water
15 mL Salt
450 g Sifted flour
9 Large eggs
225 g Grated cheese
To taste Cracked pepper

Yield 120

Butter 360 g
Milk 540 mL
Water 540 mL
Salt 20 mL
Sifted flour 600 g
Large eggs 12
Grated cheese 300 g
Cracked pepper To taste

Table 17: Table of conversion for yield in a standard recipe

Baker’s Percentage

Many professional bread and pastry formulas are given in what is called baker’s percentage. Baker’s percentage gives the weights of each ingredient relative to the amount of flour (Table 18). This makes it very easy to calculate an exact amount of dough for any quantity.

Ingredient % Total Unit
Flour 100.0% 15 kg
Water 62.0% 9.3 kg
Salt 2.0% 0.3 kg
Sugar 3.0% 0.45 kg
Shortening 1.5% 0.225 kg
Yeast 2.5% 0.375 kg
Total weight: 171.0% 25.65 kg

Table 18: A formula stated in baker’s percentage

To convert a formula using baker’s percentage, there are a few options:

If you know the percentages of the ingredients and amount of flour, you can calculate the other ingredients by multiplying the percentage by the amount of flour to determine the quantities for 20 kg flour (Table 19).

Ingredient % Total Unit
Flour 100.0% 20 kg
Water 62.0% 12.4 kg
Salt 2.0% 0.4 kg
Sugar 3.0% 0.6 kg
Shortening 1.5% 0.3 kg
Yeast 2.5% 0.5 kg
Total weight: 171.0% 34.20 kg

Table 19: Baker’s percentage formula adjusted for 20 kg flour

How to find the percentage when you know the ingredient amounts in a formula.

To calculate the percentage, divide each ingredient by the weight of the flour (Table 20). (Remember flour is always 100%). For example, the percentage of water is 6.2 ÷ 10 = 0.62 x 100 or 62%.

Ingredient % Total Unit
Flour 100.0% 10 kg
Water 62.0% 6.2 kg
Salt 2.0% 0.2 kg
Sugar 3.0% 0.3 kg
Shortening 1.5% 0.15 kg
Yeast 2.5% 0.25 kg

Table 20: Baker’s percentages given for known quantities of ingredients

Using baker’s percentage to find ingredient weights when given the total dough weight

For instance, you want to make 50 loaves at 500 g each. The weight is 50 x 0.5 kg = 25 kg (lbs.) of dough.

You know the total dough weight is 171% of the weight of the flour.

To find the amount of flour, 100% (flour) is to 171% (total %) as n (unknown) is to 25 (Table 21). That is,

  1. 100 / 171 = n / 25
  2. 25 x 100 / 171 = n
  3. 14.62 = n
Ingredient % Total Unit
Flour 100.0% 14.62 kg
Water 62.0% 9.064 kg
Salt 2.0% 0.292 kg
Sugar 3.0% 0.439 kg
Shortening 1.5% 0.219 kg
Yeast 2.5% 0.366 kg
 Total weight: 171.0%  25.00 kg

Table 21: Formula adjusted based on total dough weight

As you can see, both the conversion factor method and the baker’s percentage method give you ways to convert recipes. If you come across a recipe written in baker’s percentage, use baker’s percentage to convert the recipe. If you come across a recipe that is written in standard format, use the conversion factor method.

2

Inventory Control

6

Learning Objectives

Learning Objectives

  • Describe basic inventory procedures
  • Take a basic inventory
  • Extend a basic inventory
  • Apply ordering and purchasing procedures


7

Basic Inventory Procedures

A key component in effective kitchen management is inventory control. By knowing what supplies are on hand at a given time, the manager will be able to plan food orders, calculate food costs since the previous inventory, and make menu item changes if needed. By keeping an eye on inventory, it is possible to note potential problems with pilferage and waste.

Managing inventory is like checking a bank account. Just as you are interested in how much money you have in the bank and whether that money is paying you enough in interest, so the manager should be interested in the value of the supplies in the storeroom and in the kitchen.

An inventory is everything that is found within your establishment. Produce, dry stores, pots and pans, uniforms, liquor, linens, or anything that costs money to the business should be counted as part of inventory. Kitchen items should be counted separately from the front of house and bar inventory and so forth.

Regardless of the size of your operation, the principles of inventory control are the same. In larger operations there will be more people and sometimes even whole teams involved with the various steps, and in a small operation all responsibility for managing the inventory may fall on one or two key people.

Effective inventory control can be broken down into a few important steps:

Setting Up Systems to Track and Record Inventory

One of the reasons you take inventory is to determine food costs and to work out cost percentages. There are several procedures that simplify finding the value of goods in storage. These techniques are based on keeping good records of how much supplies cost and when supplies were purchased.

The temptation in small operations is to treat inventory control casually. Perhaps there are only one or two people doing the purchasing and they are usually aware of the supplies that are on hand. This doesn’t eliminate the need to track purchases against sales to see if you are managing your costs as well as you can.

Almost all inventory control procedures are time consuming. Moreover, such records must be kept up-to-date and done accurately. Trying to save a few hours by cutting back on the time needed to keep inventory records may be money poorly saved.

The simplest method for tracking inventory is using a spreadsheet. A simple spreadsheet might list all of the products that are regularly purchased, with the current prices and the numbers on hand at the last inventory count. The prices can be updated regularly as invoices are processed for payment, and a schedule can be set to count the product on hand.

In large operations, the systems need to be more sophisticated as there are more people involved. Purchases might be made by a separate department, inventory records might be kept by a storeroom clerk, and the tracking and counting of inventory might be tied to a system using scanners and barcodes, which in turn may be linked with your sales system so that there is always a record of what should be in stock.

No matter the depth of detail used, having a system to track inventory gives managers a good idea of supplies on hand and a tool to use to manage costs.

Incoming Inventory

The primary reason for establishing a consistent method for accepting ordered goods is to ensure that the establishment receives exactly what has been ordered. Errors frequently occur, and unless the quantity and quality of the items delivered are carefully checked against what was ordered, substantial losses can take place. When receiving procedures are carefully performed, mistakes that could cost the restaurant time and money are avoided. In addition, an effective receiving method encourages honesty on the part of suppliers and delivery people.

Invoices

The most important document in determining if the goods received are the goods ordered is the invoice. An invoice is an itemized list of the goods or products delivered to a food preparation premise. An invoice shows the quantity, quality, price per kilogram or unit, and, in some cases, the complete extension of the cost chargeable. Only by carefully comparing and checking can you be sure that the information on the invoice tallies with the products received. This comparison may require that items be weighed and/or counted.

Whenever possible, the receiver should check the invoice against the purchase order or purchase request slips. This will ensure that the quantity and price of the goods shipped match those listed on the order form. If the invoice is not checked against the purchase order when the goods arrive, there is the potential that you will be missing products you need or receive products that were not ordered or are in incorrect quantities.

In addition, the quality of the goods should be determined before they are accepted. For example, boxes of fresh produce and frozen foods should be opened and inspected to ensure quality.

When you are satisfied that the delivery is in order, sign the invoice. In most cases, the invoice is in duplicate or triplicate: you keep the original and the delivery driver retains the other copy or copies. Once you have signed, you have relieved the delivery company of its responsibilities and the supplies now belong to your company. You may, therefore, become responsible for any discrepancies between what is on the invoice and what has been delivered. It is good practice to bring any discrepancies or errors to the attention of the driver and have him or her acknowledge the mistake by signing the invoice. If a credit note is issued, that should also be marked on the invoice by the driver.

Do not sign the invoice until you are sure that all discrepancies have been taken care of and recorded on the invoice.

Take the signed invoice and give it to whoever is responsible for collecting invoices for the company.

The receiving of deliveries can be time consuming for both the food establishment and the delivery service. Often the delivery people (particularly if they are not the supplier) will not want to wait while these checks are done. In this case, it is important that your company has an understanding with the supplier that faults discovered after the delivery service has left are the supplier’s problems, not yours.

Once the invoices have been signed, put the delivered products in the proper locations. If you are required to track incoming inventory, do so at the same time.

Outgoing Inventory

When a supply leaves the storeroom or cooler, a record must be kept to track where it has gone. In most small operations, the supplies go directly to the kitchen where they are used to produce the menu items. In an ideal world, accurate records of incoming and outgoing supplies are kept, so knowing what is on hand is a simple matter of subtraction. Unfortunately, systems aren’t always that simple.

In a smaller operation, knowing what has arrived and what gets used every day can easily be reconciled by doing a regular count of inventory. In larger operations and hotels, the storage rooms and coolers may be on a different floor than the kitchen, and therefore a system is needed that requires each department and the kitchens to requisition food from the storeroom or purchasing department, much like a small restaurant would do directly from the supplier. In this model, the hotel would purchase all of the food and keep it in a central storage area, and individual departments would then “order” their food from the storerooms.

Requisitions

To control inventory and to determine daily menu costs in a larger operation, it is necessary to set up a requisition procedure where anything transferred from storage to the kitchen is done by a request in writing. The requisition form should include the name and quantity of the items needed by the kitchen. These forms often have space for the storeroom clerk or whoever handles the storeroom inventory to enter the unit price and total cost of each requested item (Figure 1).

In an efficiently run operation, separate requisition forms should be used by serving personnel to replace table supplies such as sugar, salt, and pepper. However, often personnel resist using requisition forms because they find it much easier and quicker to simply enter the storage room and grab what is needed, but this practice leaves no record and makes accurate record keeping impossible. To reduce the possibility of this occurring, the storage area should be secure with only a few people having the right to enter the rooms, storage freezers, or storage refrigerators.


Date: __________________________

Department: Food Service

Quantity Description Unit Cost Total Cost
6 #10 cans Kernel corn
25 kg Sugar
20 kg Ground beef
6 each Pork loins

Charge to: Catering Dept.

C. Andrews

Chef

Figure 1: Requisition form


Not only does the requisition keep tabs on inventory, it also can be used to determine the dollar value of foods requested by each department and so be used to determine expenses. In a larger operation where purchases may be made from different suppliers at different prices, it may be necessary to tag all staples with their costs and date of arrival. Expensive items such as meats are often tagged with a form that contains information about weight, cost per unit (piece, pound or kilogram), date of purchase, and name of supplier.

Pricing all items is time consuming, but that time will soon be recovered when requisition forms are being filled out or when the stock has to be given a monetary value. In addition, having prices on goods may help to remind staff that waste is costly.

Inventory Record Keeping

There are two basic record keeping methods to track inventory. The first is taking perpetual inventory. A perpetual inventory is simply a running balance of what is on hand. Perpetual inventory is best done by keeping records for each product that is in storage, as shown in Figure 2.

Item: Canned Peaches, reorder point: 10. This table shows the date and carried forward of 15. One June 16, 3 went out and the balance was 12. One June 17, 3 went out and the balance was 9. On June 18, 6 came in and the balance was 15. One June 19, 2 went out and there was a balance of 13. The perpetul inventory form can indicate when the product should be reordered (the reorder point) and how much fo the producct should be ideally on hand at a given time, the par stock.

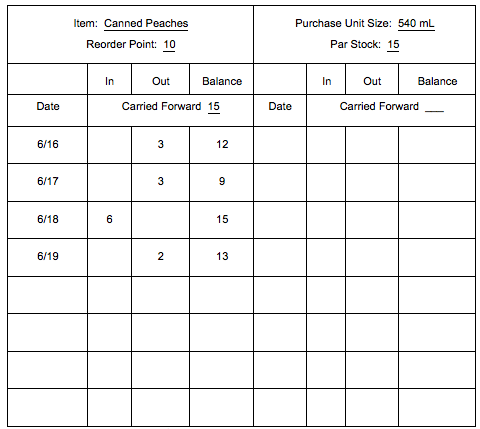
Figure 2: Perpetual inventory form

When more of the product is received, the number of cans or items is recorded and added to the inventory on hand; when some of the product is requisitioned, the number going out is recorded and the balance is reduced. In addition, the perpetual inventory form can indicate when the product should be reordered (the reorder point) and how much of the product should ideally be on hand at a given time (par stock).

In small operations, a perpetual inventory is usually only kept for expensive items as the time (and cost) of keeping up the records can be substantial.

The second inventory record keeping system is taking a physical inventory. A physical inventory requires that all items in storage be counted periodically. To be an effective control, physical inventory should be taken at least monthly. The inventory records are kept in a spreadsheet or in another system reserved for that purpose.

The inventory sheet (Figure 3) can list the items alphabetically or in the order they will appear on the shelves in the storage areas.

Month: March

Product Unit Count Unit Price Total Value
Lima beans 6 #10 4 1/3 $23.00 $99.60
Green beans 6 #10 3 5/6 28.95 110.98
Flour 25 kg bag 3 14.85 44.55
Rice 50 kg bag 1 32.50 32.50
Total $593.68

Figure 3: Physical inventory form

In addition to the quantity of items, the inventory usually has room for the unit cost and total value of each item in storage. The total values of the items are added together to give the total dollar value of the inventory. This is also knows as extending the inventory. The total value of the inventory is known as the closing inventory for the day the inventory was taken. This amount will also be used as the opening inventory to compare with the next physical inventory. If the inventory is taken on the same day of each month, the figures can be used to accurately determine the monthly food cost.

The physical inventory is used to verify the accuracy of the perpetual inventory. For example, if 15 whole beef tenderloins are counted during a physical inventory, but the perpetual inventory suggests that there should be 20 tenderloins on hand, then a control problem exists and you need to find the reason for the variance.

Computerized Inventory Control

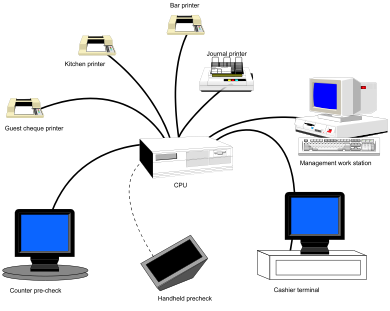
Most people today use computerized systems to calculate, track, and extend inventory. These systems enable the restaurant to have a much tighter and more accurate control over the inventory on hand and the costs of that inventory. Having access to information such as ordering history and the best price paid is just one of the benefits of these systems. They can also help the purchaser predict demand levels throughout the year. These programs in many cases are also integrated with the point-of-sale (POS) system used to track sales, and can even remove an item from a computerized inventory list when the waiter registers the sale of any menu item on the restaurant terminal. That is, if a customer orders one chicken dish from the menu, all the items required to make one portion of the chicken are discounted from inventory. This provides management with an constant up-to-date perpetual inventory of most inventory items.

Smaller operations will use a spreadsheet application to manage inventory, so you should also be familiar with a program like Microsoft Excel if you are responsible for ordering and inventory. The information required for the program to do the calculations properly is available from the invoices received with your supplies. That is, the quantities and prices of the goods you most recently received should be entered into the computer program either by you or by the restaurant’s purchaser. These prices and quantities are automatically used to calculate the cost of the goods on hand. This automated process can save you an enormous amount of time and, if the information entered into the computer is accurate, may also save you money. In any inventory system, there is always a possibility for error, but with computerized assistance, this risk is minimized.

Pricing and Costing for Physical Inventory

The cost of items purchased can vary widely between orders. For example, cans of pineapple might cost $2.25 one week, $2.15 the second week, and $2.60 another week. The daily inventory reports will reflect the changes in price, but unless the individual cans have been marked, it is difficult to decide what to use as a cost on the physical inventory form.

There are several different ways to view the cost of the stock on the shelves if the actual cost of each item is difficult to determine. Most commonly, the last price paid for the product is used to determine the value of the stock on hand. For example, if canned pineapple last cost $2.60 a can and there are 25 cans on hand, the total value of the pineapple is assumed to be $65 (25 x $2.60) even though not all of the cans may have been bought at $2.60 per can.

Another method for costing assumes the stock has rotated properly and is known as the FIFO (first-in first-out) system. Then, if records have been kept up-to-date, it is possible to more accurately determine the value of the stock on hand.

Here is an example showing how the FIFO system works.

Example

The daily inventory shows the following:

Opening inventory                    15 cans @ $2.15 = $32.25

Received on 8th of month       24 cans @ $2.25 = $54.00

Received on 15th of month      24 cans @ $2.15 – $51.60

Received on 23rd of month     12 cans @ $2.60 – $31.20

If the stock has rotated according to FIFO, you should have used all of the opening inventory, all of the product received on the 8th, and some of the product received on the 15th. The 25 remaining cans must consist of the 12 cans received on the 23rd and 13 of the cans received on the 15th. The value of these cans is then

12 cans @ 2.60          = $31.20

13 cans @ 2.15          = $27.95

Total                             = $59.15

As you can see, the choice of costing method can have a marked effect on the value of stock on hand. It is always advisable to use the method that best reflects the actual cost of the products. Once a method is adopted, the same method must be used consistently or the statistical data generated will be invalid.

Costing Prepared or Processed Items

When you are building your inventory forms, be sure to calculate the costs of any processed items. For instance, sauces and stocks that you make from raw ingredients need to be costed accurately and recorded on the spreadsheet along with purchased products so that when you are counting your inventory you are able to reflect the value of all supplies on the premises that have not been sold.

(We will discuss more about calculating the costs of products and menu items later in this book.)

Inventory Turnover

When accurate inventory records are kept, it is possible to use the data in the records to determine the inventory turnover rate. The inventory turnover rate shows the number of times in a given period (usually a month) that the inventory is turned into revenue. An inventory turnover of 1.5 means that the inventory turns over about 1.5 times a month, or 18 times a year. In this case, you would have about three weeks of supplies in inventory at any given time (actually 2.88 weeks, which is 52 weeks/18). Generally, an inventory turnover every one to two weeks (or two to three times per month) is considered normal.

A common method used to determine inventory turnover is to find the average food inventory for a month and divide it into the total food cost for the same month. The total food cost is calculated by adding the daily food purchases (found on the daily receiving reports) to the value of the food inventory at the beginning of the month and subtracting the value of the food inventory at the end of the month.

That is,

average food inventory = (beginning inventory + ending inventory)/2

cost of food = beginning inventory + purchases – ending inventory

inventory turnover = (cost of food)/(average food inventory)

Example

A restaurant has a beginning inventory of $8000 and an ending inventory of $8500. The daily receiving reports show that purchases for the month totalled $12 000. Determine the cost of food and the inventory turnover.

Cost of food = $8000 + $12 000 – $8500 = $11 500

Average food inventory = ($8000 + $8500)/2 = $8250

Inventory turnover = $11 500/$8250 = 1.4

The turnover rate in the example would be considered low and would suggest that the business has invested too much money in inventory. Having a lot of inventory on hand can lead to spoilage, high capital costs, increased storage space requirements, and other costs.

Inventory turnover rates are not exact, for a few reasons. One is that in many food operations, accurate inventory records are usually kept only for more expensive items. Another is that the simple food cost used in the calculation does not truly reflect the actual food cost. (Food costs are discussed in another chapter in this book.) In addition, not all inventory turns over at the same rate. For example, perishables turn over as quickly as they arrive while canned goods turn over more slowly.

Even though turnover rates are not exact, they do give managers at least a rough idea of how much inventory they are keeping on hand.

8

Purchasing

The purchasing process is an essential part of every food service operation. All competent cooks should be skilled in buying the appropriate ingredients, in accurate amounts, at the right time, and at the best price.

Every kitchen operation has different purchasing procedures. But there is one rule that should always be followed:

This will ensure that foods stay fresh and will create a high inventory turnover. All foods deteriorate in time, some more quickly than others. It is the job of the purchaser to ensure that only those quantities that will be used immediately or in the near future are purchased.

Market Sourcing

Sources of supply vary considerably from location to location. Large cities have a greater number and variety of suppliers than do small towns and isolated communities. Purchasers should establish contact with available suppliers such as wholesalers, local producers and packers, retailers, cooperative associations, and food importers. In most instances, the person in charge of buying will contact several suppliers to obtain the necessary foods. Some wholesalers diversify their product lines in order to meet all food-related kitchen needs.

Food products are obtained from various sources of supply. For example, a packing house supplies meat and meat products, while a food wholesaler supplies dry goods. Once business is established with a supplier, all transactions should be well documented and kept readily available on file.

There are two major food categories: perishables and non-perishables.

Perishables

Perishable items include fruits, vegetables, fresh fish and shellfish, fresh meats, poultry, and dairy products. As a rule, perishables are bought frequently to ensure freshness. Frozen foods, such as vegetables, fish and meat products, have a longer lifespan and can be ordered less frequently and stored in a freezer.

Non-perishables

Non-perishable items include dry goods, flour, cereals, and miscellaneous items such as olives, pickles, and other condiments. These can be ordered on a weekly or monthly basis.

Keep in mind that just because something does not go bad isn’t a reason to buy it in quantities larger than you need. Every item in your inventory is equal to a dollar amount that you could be saving or spending on something else. Consider that a case of 1000 sheets of parchment paper may cost $250. If you have a case and a half sitting in your inventory, but only use a few sheets a day, that is a lot of money sitting in your storeroom.

Factors That Impact Prices

Food products in particular fluctuate in price over the year, due to many factors:

Before purchasing any food items, ask the following questions.

Specifications

Meat, seafood, poultry, processed fruits and vegetables, and fresh fruits and vegetables can be ordered under different specifications. For example,

Figure 4 shows an example of a purchasing specification sheet that might be kept in a commercial kitchen or receiving area.

Purchasing Specifications

Beef Grade Weight, Size, and Cut Specifications
Prime rib Grade AA 7 kg, fully trimmed
New York strip Grade AAA 6 kg, bone out, fully trimmed, max. 15 cm width, min. 5 cm depth
Tenderloin Grade AAA 3 kg, fully trimmed to silverside
Roast sirloin Grade A 7 kg, boneless butt
Short loins Grade AAA 6 kg, fully trimmed, 5 cm from eye
Pork Grade Weight, Size, and Cut Specifications
Pork leg Fresh—Canada #1 6 kg, oven ready, lean
Pork loin Fresh—Canada #1 5-6 kg, trimmed, lean
Ham 6-8 kg, fully cooked, lean, bone in
Poultry Grade Weight, Size, and Cut Specifications
Chicken—Frying Fancy, Eviscerated 1.5 kg, always fresh
Turkey Fancy, Eviscerated 9-13 kg
Lamb Grade Weight, Size, and Cut Specifications
Legs Fresh—Canada #1
Lamb loin 3-5 kg, bone in
2-3 kg, trimmed with all fat removed
Seafood  Grade Weight, Size, and Cut Specifications
Shrimp Jumbo 24-30/kg, fresh
Oysters Canada #1 35/L

Figure 4: Purchasing specifications

Contract Buying

Some restaurants and hotels, particularly those belonging to chains, will have contracts in place for the purchasing of all products or for certain items. This may mean that the property can only purchase from a specific supplier, but in return it will have negotiated set pricing for the duration of the contract. This has advantages and disadvantages. On the positive side, the contract price remains stable and the job of managing food costs becomes more consistent since there are no price fluctuations. On the negative side, contract buying takes away the opportunity to compare prices between suppliers and take advantage of specials that may be offered.

Additional Resources

The CFIA (Canadian Food Inspection Agency) has specifications for food labelling, packaging, an so forth: http://www.inspection.gc.ca/food/eng/1299092387033/1299093490225

These books are great resources for purchase specifications:

The Visual Food Encyclopedia

The Visual Food Lover’s Guide: Includes essential information on how to buy, prepare, and store over 1000 types of food

Chef’s Book of Formulas, Yields and Sizes

Purchasing Procedures

In most kitchens, purchasing and ordering are done by the chef and sous-chefs, although in larger hotels there may be purchasing departments assigned this responsibility. Most kitchens will have a list of suppliers, contacts, delivery dates and schedules, and order sheets with par stock levels to make purchasing easier. For a special function or event, such as a banquet, it may also be necessary to determine the required supplies for that function alone.

Production Control Chart

To calculate the quantities of food items to be ordered for any size banquet, a portion control chart must be consulted first. Most establishments will have a portion control chart similar to the one shown in Figure 5. The chart indicates the portions to be used per person for any given menu item.

Food Item Menu Item Portion Size
Shrimp Shrimp cocktail 80 g (2.82 oz.)
Lemon Shrimp cocktail 1 wedge (6/lemon)
Cocktail sauce Shrimp cocktail 60 mL (2.11 oz.)
Head lettuce Tossed salad 1/4 head
Tomato Tossed salad 1/2 each
Dressing Tossed salad 60 mL (2.11 oz.)
Prime rib, raw, trimmed ready Prime rib 500 g (17.6 oz.)
Potato Baked potato 1 each (100 count)
Green beans Green beans 80 g (2.82 oz.)
Carrots Carrots 80 g (2.82 oz.)
Strawberries Fresh strawberries 100 g (3.52 oz.)
Whipping cream Berries and cream 60 mL (2.11 oz.)
Coffee Coffee 500 g (17.6 oz.) for 75 people
Coffee cream Coffee 60 mL (2.11 oz.)

Figure 5: Portion control chart

One use for a portion control chart is to estimate the quantity of major ingredients and supplies needed to produce a predicted number of menu servings.

Example

You need to prepare shrimp cocktails and prime rib for a 100-person banquet. Using the portion control chart in Figure 5, you can quickly determine what amounts of major ingredients (Figure 6).

Required Servings Amount to Order
100 x 80 g shrimp 8000 g or 8 kg (17.6 lbs.) shrimp
100 x 1 wedge of lemon 100 wedges = 17 lemons (6 wedges per lemon)
100 x 1/4 head of lettuce 25 heads lettuce
100 x 500 g prime rib raw oven ready 50 kg (110 lbs.) prime rib

Figure 6: Calculating purchase amounts

Purchase Order Chart with Par Levels

The primary purpose for using a purchasing standard is to ensure that sufficient quantities of all food are on hand to meet daily requirements. To establish and maintain these standards, food inventory must become a daily routine. Having set par levels (the amount you should have on hand to get through to the next order) will help in this regard.

There are three main things you need to know:

To find the amount to order, subtract the amount on hand from the amount required (Figure 7). In some cases, you may have to order a minimum amount based on the package size, so will need to round your quantity up (such as the whole tub of garlic and full cases of mushrooms, apples, and lettuce in Figure 7).

Meats Amount Required (Par Level) Amount on Hand Amount to Order Actual Order
  • Corned beef
10 kg 2 kg 8 kg 8 kg
  • Ribs of beef
20 kg 5 kg 15 kg 15 kg
  • Ground beef
10 kg 10 kg 10 kg
  • Veal liver
5 kg 500 g 4.5 kg 4.5 kg
  • Pork loin
10 kg 3 kg 7 kg 7 kg
Fish  Amount Required (Par Level) Amount on Hand Amount to Order Actual Order
  • Sole fillet
25 kg 5 kg 20 kg 20 kg
Vegetables  Amount Required (Par Level) Amount on Hand Amount to Order Actual Order
  • Garlic, peeled
2 kg tub 250 g 1.750 kg 2 kg tub
  • Mushrooms
5 kg case 500 g 4.5 kg 5 kg case
  • Lettuce
2 cases (24/case) 12 (1/2 case) 1 1/2 cases 2 cases
Fruits Amount Required (Par Level) Amount on Hand Amount to Order Actual Order
  • Apples
2 cases 1/2 case 1 1/2 cases 2 cases
  • Strawberries
10 kg 10 kg
  • Oranges
1 case 2 cases

Figure 7: Purchase order chart

Integrating these par levels into your regular ordering sheets or your ordering system will make it very easy to manage inventory coming in.

More and more suppliers are moving to online ordering systems, which have current prices, case sizes, and often your purchase history available to you when placing an order. Online ordering can often be more convenient as the person placing the order does not have to make call into an order desk during regular office hours.

3

Food Costing

9

Learning Objectives

Learning Objectives

  • Describe food cost controls
  • Perform yield and cost calculations
  • Cost and price menu items
  • Describe overall food costs
  • Describe the principles of menu engineering


10

Standard Purchase Specifications

Food service establishments are businesses. In order to stay in business, everyone involved with the enterprise should have at least a basic idea of how costs are determined and how such costs have an impact on an operating budget.

Food costs are controlled by five standards to which all employees and managers must adhere:

To calculate the cost of each item, you need to understand the relationship between standardized recipes, standard portions, and yield tests. All of these play a role in calculating the cost of each item on your menu.

After goods are ordered, there should be no surprises when the goods arrive. The more specific the order, the less the chance of receiving supplies that are too high in price, too poor in quality, or too many in number.

Specifications can include brand names, grades of meat, product size, type of packaging, container size, fat content, count per kilogram, special trimming, and so on. The specifications should be specific, realistic, and easy to verify.

Precise specifications can:

Specifications usually do not include general delivery procedures or purchase price. Directions and prices can change quickly. Specifications should be well thought out and are usually not subject to quick change.

Standardized Recipes

A standardized recipe is one that holds no surprises. A standardized recipe will produce a product that is close to identical in taste and yield every time it is made, no matter who follows the directions. A standardized recipe usually includes:

Standard Yields

The yield of a recipe is the number of portions it will produce. Standard yields for high-cost ingredients such as meat are determined by calculating the cost per cooked portion. For example, a 5 kg roast might be purchased for $17 a kilogram. The cooked roast is to be served in 250 g portions as part of a roast beef dinner. After trimming and cooking, the roast will not weigh 5 kg, but significantly less. By running a yield test, the cost per portion and unit weight, and the standard yield and yield percentage, can be determined.

Standard Portions

A standard recipe includes the size of the portions that will make up a serving of the recipe. Controlling portion size has two advantages in food management: portion costs for the item will be consistent until ingredient or labour costs increase, and customers will receive consistent quantities each time they order a given plate or drink.

Standard portions mean that every plate of a given dish that leaves the kitchen will be almost identical in weight, count, or volume. Only by controlling portions is it possible to control food costs. If one order of bacon and eggs goes out with six rashers of bacon and another goes out with three rashers, it is impossible to determine the actual cost of the menu item.

Adhering to the principles of standard portions is crucial to keeping food costs in line. Without portion control, there is no consistency. This not only could have drastic effects on your food costs (having no real constant costs to budget for) but also on your customers. Customers appreciate consistency. They expect that the food you prepare will taste good, be presented properly, and be the same portion size every time they order it. Consider how the customer would feel if the portion size fluctuated with the cook’s mood. A cook’s bad mood might mean a smaller portion or, if the cook was in a good mood because the work week was over, the portion might be very large. It may be hard to grasp the importance of consistency with one single portion, but consider if fast-food outlets did not have portion control. Their costs as well as their ordering and inventory systems would be incredibly inaccurate, all of which would impact negatively on their profit margin.

Strict portion control has several side benefits beyond keeping costs under control. First, customers are more satisfied when they can see that the portion they have is very similar to the portions of the same dish they can see around them. Second, servers are quite happy because they know that if they pick up a dish from the kitchen, it will contain the same portions as another server’s plate of the same order.

Simple methods to control portion include weighing meat before it is served, using the same size juice glasses when juice is served, counting items such as shrimp, and portioning with scoops and ladles that hold a known volume. Another method is using convenience products. These products are received usually frozen and are ready to cook. Portions are consistent in size and presentation and are easily costed out on a per unit basis. This can be helpful when determining the standard portion costs.

Note: Using convenience products is usually more costly than preparing the item in-house. However, some chefs and managers feel that using premade convenience products is easier than hiring and training qualified staff. But always keep in mind that if the quality of the convenience item is not comparable to an in-house made product, the reputation of the restaurant may suffer.

Standard portions are assured if the food operation provides and requires staff to use such tools as scales, measured ladles, and standard size scoops. Many operations use a management portion control record for menu items, similar to the one shown in Figure 8. The control record is posted in the kitchen so cooks and those who plate the dishes know what constitutes standard portions. Some operations also have photographs of each item posted in the kitchen area to remind workers what the final product should look like.

Portion Control Record

Item Purchased Size Yield % Cooked Yield Portion Size No. of Portions
Baked ham 6-7 kg 50% 3.0-3.5 kg
Lunch 50 g 60-70
Dinner 85 g 35-41
Prime rib 9-12 kg 40% 3.6-4.8 kg 150 g 24-32
Fillet of sole 500 g 100% 500.0 g
Lunch 50 g 10
Dinner 85 g 6
Potatoes: 50 kg
  • Roasted
75% Peeled – 37.5 kg 100 g 375
  • French fries
56% Peeled – 28.0 kg 100 g 280
Daily veg 5 kg
Green beans 80% Trimmed – 4 kg 50 g 80
Carrots 80% Peeled – 4 kg 50 g 80

Figure 8: Portion control record

Standard Portion Costs

A standard recipe served in standard portions has a standard portion cost. A standard portion cost is simply the cost of the ingredients (and sometimes labour) found in a standard recipe divided by the number of portions produced by the recipe. Standard portion costs change when food costs change, which means that standard portion costs should be computed and verified regularly, particularly in times of high inflation. If market conditions are fairly constant, computing standard portion costs need not be done more than every few months.

Details about recipe costs are not usually found on a standard recipe document but on a special recipe detail and cost sheet or database that lists the cost per unit (kilogram, pound, millilitre, ounce, etc.) and the cost per amount of each ingredient used in the recipe or formula.

The standard portion cost can be quickly computed if portions and recipes are standardized. Simply determine the cost of each ingredient used in the recipe and ingredients used for accompaniment or garnish.

The ingredients in a standard recipe are often put on a recipe detail sheet (Figure 9). The recipe detail sheet differs from the standard recipe in that room is provided for putting the cost of each ingredient next to the ingredient. Recipe detail sheets often have the cost per portion included as part of their information, and need to be updated if ingredient costs change substantially. They can also be built in a POS system database or spreadsheet program that is linked to your inventory to allow for the updating of recipe costs as ingredient costs change.

Menu item: Seafood Newburg
Yield: 10 portions
Portion size: 125 g of seafood
Selling price: $12.99
Cost/portion: $4.07
Food cost %: 31.3%

Ingredients Quantity Units Cost/Unit Extension
Lobster meat 500 g kg $38.00 $19.00
Scallops 250 g kg $25.00 $6.25
Shrimps 250 g kg $14.00 $3.50
Sole 250 g kg $8.50 $2.13
Cream, heavy 250 mL L $4.00 $1.00
Fish Velouté 750 mL L $1.00
Butter 250 g 500 g $2.85 $1.43
Pepper and salt
Paprika 5 g $0.15
Sherry 250 mL 750 mL $12.00 $4.00
Egg yolks 6 12 $2.00 $1.00
Patty shells 10 each $0.12 $1.20
Total $40.66

Procedure

Quarter the scallops, dice the lobster meat, halve the shrimps, and chop the sole before sautéing well in melted butter. Add sherry and simmer for a few minutes. Add the fish velouté sauce and paprika and continue to simmer. Combine the egg yolks and the heavy cream before adding them slowly to the simmering pan. Season to taste with salt and white pepper. Serve in patty shells.

Figure 9: Recipe detail and cost sheet


Note that the portion cost and selling price used in Figure 9 is for the Seafood Newburg alone (a true à la carte price) and not the cost of all accompaniments found on the plate when the dish is served.

For example, the cost of bread and butter, vegetables, and even garnishes such as a wedge of lemon and a sprig of parsley must be added to the total cost to determine the appropriate selling price for the Seafood Newburg.

Costing Individual Items on a Plate

If you need to determine the total cost of a plate that has multiple components, rather than a recipe, you can follow the procedure in the example below.

Example

Standard order of bacon and eggs: the plate contains two eggs, three strips of bacon, toast, and hash browns.

The cost of ingredients used for accompaniment and garnish can be determined by using the standard portion cost formula, which is the purchase price of a container (often called a unit) divided by the number of portions in the container. That is,

standard portion cost = unit cost/portions in the unit

An example is a carton of eggs. If eggs cost $2.00 a dozen and a standard portion in a menu breakfast item is two eggs, the standard portion cost can be found.

Recall the equation:

standard portion cost = unit cost/portions in the unit

Now, find the portions in the unit.

portions in the unit = number in unit/number in a portion

= 12/2

= 6

That is, there are six 2-egg portions in a dozen eggs.

Substitute the known quantities into the equation.

standard portion cost  = unit cost/portions in unit

= $2.00/6

= $0.33

You could get the same answer by calculating how much each egg in the dozen is worth ($2.00/12 = $0.17) and then multiplying the cost per egg by the number of eggs needed ($0.17 x 2 = $0.34). No matter what method is used, the standard portion of two eggs in this order of bacon and eggs has a standard portion cost of $0.34.

You can find the standard portion cost of the bacon in the same way. If a 500 g package of bacon contains 20 rashers and costs $3.75, the standard portion cost of a portion consisting of four rashers can be found quickly:

portions in the unit = 20/4

= 5

standard portion cost = unit cost/portions in unit

= $3.75/5

= $0.75

The bacon and eggs on the plate would have a standard portion cost of $1.09. You could determine the cost of hash browns, toast, jam, and whatever else is on the plate in the same manner.

Often, restaurants will serve the same accompaniments with several dishes. In order to make the costing of the entire plate easier, they may assign a “plate cost,” which would include the average cost of the standard starch and vegetable accompaniments. This makes the process of pricing daily specials or menu items that change frequently easier, as you only need to calculate the cost of the main dish and any specific sauces and garnishes, and then add the basic plate cost to the total to determine the total cost of the plate.

Figures 10 and 11 provide an example for calculating the basic plate cost and the cost of daily features.

Mashed potatoes, one serving $0.50
Mixed vegetables, one serving $0.75
Demi-glace, one serving $0.30
Herb garnish $0.20
Total basic plate cost $1.75

Figure 10: Calculating basic plate cost for daily meat special

Day Feature Feature Cost per Portion Basic Plate Cost Total Cost
Monday Roast beef $5.00 + $1.75 = $6.75
Tuesday Pork chop $3.75 + $1.75 = $5.50
Wednesday Half roast chicken $4.00 + $1.75 = $5.75

Figure 11: Calculating the cost of daily features using a basic plate cost


11

Yield Testing

Yield in culinary terms refers to how much you will have of a finished or processed product. Professional recipes should always state a yield; for example, a tomato soup recipe may yield 15 L, and a muffin recipe may yield 24 muffins. Yield can also refer to the amount of usable product after it has been processed (peeled, cooked, butchered, etc.)

For example, you may be preparing a recipe for carrot soup. The recipe requires 1 kg of carrots, which you purchase. However, once you have peeled them and removed the tops and tips, you may only have 800 grams of carrots left to use.

In order to do accurate costing, yield testing must be carried out on all ingredients and recipes. When looking at yields, you must always consider the losses and waste involved in preparation and cooking. There is always a dollar value that is attached to vegetable peel, meat and fish trim, and packaging like brines and syrups. Any waste or loss has been paid for and is still money that has been spent. This cost must always be included in the menu price.

Note: Sometimes, this “waste” can be used as a by-product. Bones from meat and fish can be turned into stocks. Trimmings from vegetables can be added to those stocks or, if there is enough, made into soup.

All products must be measured and yield tested before costing a menu. Ideally, every item on a menu should be yield tested before being processed. Most big establishments will have this information on file, and there are many books that can also be used as reference for yields, such as The Book of Yields: Accuracy in Food Costing and Purchasing.


The procedure for testing for yields

1. Record the original weight/volume of your item. This is your raw weight or as purchased (AP) weight.

A) Whole tenderloin – 2.5 kg

B) Whole sockeye salmon – 7.75 kg

C) Canned tuna flakes in brine – 750 mL

2. Process your product accordingly, measure and record the waste or trim weight.

A) Tenderloin fat, sinew, chain, etc. – 750 g tenderloin trim

B) Salmon head, bones, skin, etc. – 2.75 kg salmon trim

C) Brine – 300 mL canned tuna waste

3. Subtract the amount of trim weight from the AP weight and you will have what is referred to as your processed or edible product (EP) weight. The formula is: AP weight – waste = EP weight.

A) 2500 g – 750 g = 1750 g processed tenderloin

B) 7750 g – 2750 g = 5000 g processed salmon

C) 750 mL – 300 mL = 400 mL processed canned tuna

4. Get your yield percentage by converting the edible product weight into a percentage. The formula is EP weight ÷ AP weight x 100 = yield %.

A) (1750 ÷ 2500) x 100 = 70% for the tenderloin

B) (5000 ÷ 7750) x 100 = 64.51% for the salmon

C) (400 ÷ 750) x 100 = 53.33% for the canned tuna


Yield percentage is important because it tells you several things: how much usable product you will have after processing; how much raw product to actually order; and the actual cost of the product per dollar spent.

Using Yield to Calculate Food Costs

Once you have your yield percentage, you can translate this information into monetary units. Considering the losses incurred from trimmings and waste, your actual cost for your processed ingredient has gone up from what you originally paid, which was your raw cost or AP cost. These calculations will provide you with your processed cost or EP cost.

The procedure for determining EP cost

1. Record the AP cost, what you paid for the item:

A) Whole tenderloin – $23.00/kg

B) Whole sockeye salmon – $5.00/kg

C) Canned tuna flakes in brine – $5.50/750 mL can

2. Obtain your factor. This factor converts all your calculations into percentages. The formula is:
100 ÷ yield % = factor

A) 100 ÷ 70 tenderloin = 1.42

B) 100 ÷ 64.51 salmon = 1.55

C) 100 ÷ 53.33 canned tuna = 1.875

3) Once the factor has been determined, it is now an easy process to determine your EP cost. The formula is:
factor x as purchased cost per (unit) = edible product cost per (unit)

A) Tenderloin $23.00 x 1.42 = $32.66/kg

B) Salmon $5.00 x 1.55 = $7.75/kg

C) Canned tuna $5.50 x 1.875 = $10.78/750 mL

There could be a considerable difference in costs between the raw product and the processed product, which is why it is important to go through all these steps. Once the EP cost is determined, the menu price can be set.

Yield Tests and Percentages

Meat and seafood products tend to be the most expensive part of the menu. They also have significant amounts of waste, which must be accounted for when determining standard portion cost.

When meat is delivered, unless it has been purchased precut, it must be trimmed and cut into portions. The losses due to trimming and cutting must be accounted for in the portion cost of the meat. For example, if a 5 kg roast costing $8 a kilogram (total cost is $40) is trimmed of fat and sinew and then weighs 4 kg, the cost of usable meat (the EP cost), basically, has risen from $8 a kilogram to $10 a kilogram ($40/4 kg). The actual determination of portion cost is found by conducting a meat cutting yield test.

The test is conducted by the person who breaks down or trims the wholesale cut while keeping track of the weight of the parts. The information is placed in columns on a chart, as shown in Figure 12. The column names and their functions are discussed below.

The meat cutting yield test shows the item as pork loin, with a grade of A-1 and then a place for the date. A whole piece is weighted at 2.5 kg, the value per kg is $12.14 and the total value is $30.35. The breakdown is noted as fat and gristle as a weight of 850 g, making up 34% of the total, with a value of $0.20 and a total value of $0.17. The loss in cutting breakdown is 100 g with a 4% of the total, 0 value per kg. The trim is 250 g, making it 10% of the total, with a value of $7.49 per kg and a total value of $1.87. The usable meat is 1300 g, making it 52% of the total, and the total value is $28.31. The cost factor is 1.79, the EP cost per kg is $21.7, portion size is 250 g and the portion cost is $5.45.

Figure 12: Meat cutting yield test


The parts of the meat are listed on the yield test sheet under the heading “Breakdown.” In the example in Figure 12, a pork loin has been broken down into fat and gristle, loss in cutting, trim, and usable meat. Various measures and calculations are then recorded in the different columns:

% of total weight = weight of part/total weight

For example, in Figure 12, the fat and gristle weighs 850 g (or 0.850 kg). The total weight of the pork loin before trimming is 2.5 kg.

Percentage of fat and gristle equation

% of fat and gristle = weight of part/total weight

= 0.850 kg/2.5 kg

= 0.34

= 34%

Using the same procedure, you can calculate:

% of loss in cutting = 0.100 kg/2.5 kg

= 0.04

= 4%

% of trim = 0.250 kg/2.5 kg

= 0.1

= 10%

% of usable meat = 1.300 kg/2.5 kg

= 0.52

= 52%

Note: The percentage of usable meat is an important concept. It is often referred to as the yield percentage or yield factor. It will be looked at in some detail later in this chapter.

The entry for the “Usable Meat” in the total value column is determined by subtracting the value of the breakdown parts from the total cost of the pork loin ($30.35). The total cost is found by multiplying the weight of the whole piece (2.5 kg) by the value per kg ($12.14).

The total value of usable meat equation

total value of usable meat = total cost – total value of breakdown parts

= $30.35 – ($0.17 + $1.87)

= $30.35 – (2.04)

= $28.31


Cost of usable kg (or EP cost) equation

cost per usable kg  = total value of usable meat/kg weight of usable meat

= $28.31/1.3 kg (remember 1300 g = 1.3 kg)

= $21.78


Notice the difference between the wholesale cost ($12.14 kg) and the cost of usable meat ($21.78). This difference shows why the basic formula for determining standard portion costs will not work with meat.

The portion cost is determined by multiplying the cost of a usable kg by the portion size.

That is,

portion cost = portion size x cost of usable kg


Using the correct units is very important. The portion size should be converted into kilograms as the cost per usable kg has been found.

Portion size equation

portion cost = portion size x cost of usable kg

= 0.250 kg x $21.78/kg

= $5.44


Cost factor equation

cost factor per kg = cost per usable kg/original cost per kg

In this example,

cost factor per kg = cost per usable kg/original cost per kg

= $21.78/$12.14

= 1.79

This cost factor can be used to find the cost of a usable kg if the wholesale cost changes with the following formula.

Finding the cost of usable kg if wholesale cost changes

new cost of usable kg = cost factor per kg x new wholesale cost

For example, if the cost of pork loin should rise to $13.00 a kilogram from the $12.14 per kilogram given on the cutting yield test sheet, the new cost per usable kg can be quickly calculated:

new cost of usable kg  = cost factor per kg x new wholesale cost

= 1.79 x $13.00

= $23.27


Notice the size of the increase is in usable kg cost. The wholesale cost rose by ($13.00 – $12.14) $0.86 a kg, but the new cost of usable meat rose by $1.49 a kg.

Cost factor per portion equation

The cost factor per portion is found by multiplying the portion size by the cost factor per kilogram. In this example,

cost factor per portion = portion size x cost factor per kg

= 0.250 kg x 1.79

= 0.45

The cost factor per portion is important because it can be used to find the cost per portion from the wholesale cost of meat. This is done by multiplying the two quantities. For example, if the wholesale price of pork loin should rise to $13.00 a kg, the portion cost will become:

new portion cost = cost factor per portion x new wholesale cost

= 0.45 x $13.00

= $5.85


The cost factor per kilogram and the cost factor per portion are the most important entries on a meat cutting yield test as they can be used to adjust to changing wholesale costs.

Today, the meat cutting yield test is losing some of its popularity because of the introduction of pre-portioned meats. But there remain several benefits to performing meat cutting tests:

12

Cooking Loss Test

Some meats cannot be accurately portioned until they are cooked. This applies particularly to roasts, which shrink during cooking. The amount lost due to shrinkage can be minimized by incorporating the principles of low-temperature roasting, but some shrinkage is unavoidable.

The cooking loss test serves the same function as the meat cutting yield test. Their similarities and differences will become evident in the discussion below. Figure 13 shows a sample cooking loss test form.

Cooking Loss Test

Item: Leg of Lamb

Portion: 125 g

Cost factor: 0.2931

Number cooked: One

Time: 2 hours and 30 minutes

Temperature: 175°C

Cooking Loss Test2

Figure 13: Cooking loss test form

When using a cooking loss test form, note the following, referring to Figure 13:

As with the meat cutting yield test, the most important entries on the cooking loss test sheet are the portion cost and the cost factor per kg as they can be used to directly determine the portion and kilogram costs if the wholesale cost unit price changes.

Yield percentages are the ratio to total weight values found for usable meat on the meat cutting yield test sheet and the saleable weight found on the cooking loss test. Once found, yield percentages (or yield factors as they are sometimes called) are used in quantity calculations.

The general relationship between quantity and yield percentage can be seen in the following equation:

quantity needed = (number of portions x portion size)/yield percentage

Equation

Find the quantity of pork loin needed to serve 50 people 250-g portions if the yield percentage is 52% as in Figure 12. The solution is:

quantity needed = (number of portions x portion size)/yield percentage

= (50 x 0.250 kg)/52%

= 12.5 kg/0.52

= 24.03 kg

You need just over 24 kg of untrimmed pork loin to serve 50 portions of 250 g each.


The yield formula can be restated in other ways. For example, if you needed to find how many 125 g portions of lamb can be served from 12 kg of uncooked lamb given a yield factor of 43%, you could use the following procedure:

Equation

number of portions  = (quantity on hand x yield percentage)/portion size

= (12 kg x 0.43)/0.125 kg

= 5.16 kg/0.125

= 41.28

As with the inventory sheets, using a spreadsheet to help calculate the yields and factors is helpful. Some sample tools are provided in the Appendix.

13

Monthly Food Costs

Monthly food costs are determined by taking a monthly physical inventory of food stock, evaluating the inventory, and then adjusting the valuation to more accurately reflect the cost of food consumed.

The basic formula to determine the cost of food in a month is:

cost of food = opening inventory + purchases – closing inventory

Example

For example, if opening inventory is $10 000 and purchases amount to $7500, and the closing inventory (which is also the beginning inventory for the next month) is $9000, then the basic cost of food is:

cost of food = opening inventory + purchases – closing inventory

= $10 000 + $7500 – $9000

= $17 500 – $9000

= $8500

The value of the inventory is the critical component in deriving an accurate cost figure from the basic formula given above.

The information needed to accurately assess the value of inventory is obtained from daily receiving reports (that is, purchases), perpetual inventory cards (that is, inventory records that indicate what is in storage and what supplies have been removed from storage at the request of the kitchen), and by doing a physical inventory.

Adjusting (Credits and Transfers) the Evaluation of Food Costs

Some food inventory is used for purposes other than generating direct sales. For example, if employees are fed or are given a significant discount, the food cost for these meals is usually subtracted from the total found by the basic food cost formula. The cost of employee meals should not be ignored, but it might better be considered a labour cost and not a true food cost.

Promotional expenses are also subtracted from the basic cost of food figure. These include “2 for 1 specials,” coupon discounts, and other promotions. The deduction made, remember, is not the menu price but the actual cost of the food to the operation. Again, this expense cannot be ignored, but should be included as a different type of operating expense.

In some restaurant and hotel operations, food is transferred to the bar where it is served as as hors d’oeuvre to promote the sale of alcoholic beverages. This is really an expense of the bar and should not be considered a kitchen expense. The cost of transferred food should be deducted from the basic food cost figure. This cost is best considered a promotional expense borne by the bar.

Other adjustments might have to be made to the gross cost of food, depending on how the individual restaurant operates. For example, in some cases, the kitchen might acquire wine or liquor from the bar for cooking or flambéing, and that should be considered a food cost.

Net cost of food for an operation

In general, the net cost of food for an operation is summarized in the following equation:

net food cost = basic food cost – (employee meal cost + promotional expenses + transferred out food costs) + transferred in food costs

Food Cost Report

A monthly food cost report is often required by management. The basic form of the food cost report tends to be a comparison of food cost percentages. Percentages are used instead of actual net food cost as such costs vary according to sales. Percentage food cost tends to remain constant regardless of sales.

Food cost percentages

Food cost percentages are computed by using the following equation:

food cost percentage = net food cost/food sales

For example, if net food costs are $5500 and food sales were $13 700, then
food cost percentage = net food cost/food sales
= $5500/$13 700
= 0.401
= 40%

The food cost report often compares the current month’s results with the food cost percentage of the previous month or the cost percentage of the same month a year ago (Figure 14). Management can then decide if monthly food costs are under control.

Date Food Costs Food Sales Food Cost Percentage
Last month $8000 $32 000 25.0%
Previous month $8500 $30 000 28.3%
Same month last year $9500 $31 000 30.6%

Figure 14: Comparative monthly sales

Other costs must also be taken into account to properly understand where the food income dollar is going within the operation. In some restaurant businesses, the breakdown of expenses is recorded in a monthly percentage costing report on a form as shown in Figure 15.

Year: …..                             Month:
Amount % Remarks
Total sales
Food cost
Labour cost
Rent/Lease
Other operating expenses
Total cost      
Profit      

Figure 15: Percentage costing report

The cost percentages are determined by dividing the individual costs by the total sales. Near the beginning of each month, the percentage costing form of the previous month is completed and compared to the results on past forms.

Food costs can be further analyzed by investigating the costs and percentage of total food cost of individual categories of food items, as shown in the example in Figure 16.

October November December
Item Cost % of Total Cost Cost % of Total Cost
Meat $ 874.70 27.1% $ 811.12 28.2%
Fish $ 264.67 8.2% $ 184.08 6.4%
Poultry $ 390.55 12.1% $ 330.77 11.5%
Dairy $ 532.56 16.5% $ 440.07 15.3%
Eggs $ 203.34 6.3% $ 212.85 7.4%
Bakery $ 129.11 4.0% $ 143.82 5.0%
Produce $ 254.99 7.0% $ 238.73 8.3%
Dry goods $ 490.60 15.2% $ 414.19 14.4%
Beverages $   87.15 2.7% $ 100.67 3.5%
Total cost $3227.67 100% $2876.30 100%
Total sales $9143.50 $8560.35
Food cost % 35.3% 33.6%

Figure 16: Food cost analysis report

An important line in the chart shown in Figure 16 is the last one, “Food cost %.” In the example, total sales have dropped in November, but the food cost percentage has also decreased. As long as labour costs have not changed markedly from October, the food cost percentages suggest that this operation copes well with changing sales and is probably in a strong financial position even though demand is down. Sales have dropped by 6.4%, but food costs have decreased by 10.9%.

Describe Daily Food Cost Controls

A month is a long time between reports, particularly if the reports are financial in nature and will determine if the operation is keeping costs under control. If costs are not controlled, the business is likely to fail.

Daily food costs are calculated much the same way as the basic monthly food costs and the monthly net food costs. However, the inventory used is the actual amount of money that is spent daily on direct supplies or directs (that is, supplies that are purchased and used that day, such as breads and dairy products in many operations) and the value of stores used (that is, the value of the materials already on hand that have been requested and received from the storage area).

Basic daily food costs

Basic daily food costs can be expressed as:

daily food costs = cost of direct supplies + cost of stores

The daily food costs found by using the basic formula can be adjusted in much the same way as the basic monthly food cost. That is,

net daily food costs = daily food cost – (employee meal costs + promotional expenses + transferred out food costs) + transferred in food costs

Cumulative Cost Records

The easiest way to keep track of daily food costs is to use a form like the one shown in Figure 17. On this form, the cost of direct supplies, the cost of stores, total costs today, cumulative cost for the month, sales for the day, cumulative sales for the month, cost percentages for the day, and cost percentages for the month can be entered. Note that the form does not take into account transfers.

Some POS systems have this feature and can be used to track daily food costs.

Date Stores Directs Cost Today Cost to Date Sales Today Sales to Date Cost % Today Cost % to Date

Figure 17: Daily cumulative food cost record

A new form is started each month. Nothing is carried forward from month to month. The month-end totals should be close to the figures obtained using other monthly food cost procedures, such as those calculated after doing a physical inventory.

The information needed to fill in the food cost record are the daily food purchase reports for direct costs, copies of requisitions for stores, and the daily sales figures.

The following example explains how to fill out the form.

Example

On the first day of the month, $35.00 was spent on directs, $102.00 on stores, and total sales were $360.00. On the second day of the month, $12.50 was spent on directs, $95.00 on stores, and sales were $345.00. On the third day, $30.00 was spent on directs, $99.50 on stores, and total sales for the day were $310.50.

  • On the first day, the date is inserted.
  • Next to the date in Column B the cost from stores is entered.
  • In Column C the cost of directs is entered.
  • In Column F the days sales is entered.
  • Column G is the same as F or is left blank.
  • Column H is determined by dividing Column D by Column F.
  • Column I is blank or has the same value as Column H.

Columns A, B, C, D, F, and H for the second day are filled in with the cost and sales information given. Column E is the sum of the previous day’s value in Column E and today’s value in Column D. Similarly, Column G is the sum of the previous day’s Column G and today’s Column F. The value of Column I is determined by dividing Column E by Column G.

The costs and sales of the rest of the month are entered in the same way as on the second day. The final result is shown in Figure 18.

Daily cumulative food cost record

Figure 18: Daily cumulative food cost record

The daily cumulative food cost record will quickly indicate if daily food costs are getting out of hand. A single bad food cost percentage day may not be anything to worry about as supplies charged against that day may not have been entirely used that day. For example, directs might be received only twice a week and so on those days, costs will look high. However, the directs might be used over a period of two or three days. Changes in the pattern of the cost percentages may indicate problems.

Daily Reports

The daily report is usually a simple statement containing total food costs, total food sales, and cost percentages. The form can contain other columns that indicate cumulative totals or totals for the same day a month ago. A sample form is shown in Figure 19.

Date: 10/3

Today Month to Date Year to Date Last Year to Date
Food cost $129.50 $2025 $32 600 $31 750
Food sales $310.50 $5330 $92 500 $85 750
Food cost % 42% 38% 35% 37%

Figure 19: Daily report

Small variations will show up in the daily reports and are to be expected. However, if changes seem to be part of a pattern, managers who receive the daily reports will have a maximum of warning time to remedy the possible problem.

Causes of cost percentage overruns include:

In many food service operations, daily food costs are broken down into the daily costs of individual categories of raw food items. A typical form is shown in Figure 20.


Daily food cost control sheet

Figure 20: Daily food cost control sheet


Key Takeaway

Managing food costs is one of the most critical aspects of running a successful food service operation. Having procedures and tools in place to track sales and costs help to identify any possible issues and create the opportunity to remedy the problem before it gets out of control.

14

The Principles of Menu Engineering

Although you likely have a target overall food cost in your establishment, not every menu item will carry exactly the same food cost percentage. Some items are more costly than others, but most establishments will have a range of prices that all the menu items fit into. Consequently, it is important to balance the menu so that the low and high food cost items work together to help you reach your target food cost. This process is called menu engineering. Menu engineering means balancing the high and low food cost items; it also includes strategically featuring or promoting items to help reach your targets.

Calculating Menu Item Costs

The cost per portion derived from yield tests done on the main ingredient of a menu item usually represents the greatest part of the cost of preparing the item (see the section above on yield tests for more information).

However, of equal importance is the portion cost factor. For example, the portion cost factor can be used to determine the cost of a portion of the main ingredient regardless of the price of the meat (which is often the main cost factor) charged by the supplier as long as the restaurant’s preparation of the meat remains unchanged. The cost per portion is determined by multiplying the portion cost factor by the packing house’s price per kilogram (or pound).

Quite often the cost per portion of the main ingredient is used by itself to determine the selling price of a menu item. This works well with items on an à la carte menu as the basic main ingredient (such as a steak) is sold by itself and traditional add-ons (such as a baked potato and other vegetables) are sold separately.

As discussed earlier in this book, in many cases, some of the components will be the same, so a basic plate cost can be used to add to the cost of the main protein to get a total cost for the dish.

In dishes where the main ingredients are not sold as entities but as part of a prepared dish, the cost of all the items in the recipe must be determined to find an accurate portion cost price. In this case, a recipe detail and cost sheet is used to determine the cost price of menu items. (Refer back to the section on costing individual menu items for more information.)

Once the potential cost of a menu item is determined, the selling price of the item can also be calculated by using the food cost percentage.

Food Cost Percentages

As you may recall, food cost percentage is determined by dividing the portion cost by the selling price:

Food cost percentage

food cost percentage = portion cost/selling price

If the portion cost is $4.80 and the selling price is $14.00, the food cost percentage is:

food cost percentage = portion cost/selling price

= $4.80/$14.00

= 0.34285

= 34.285%

= 34% (rounded off)

Another way of expressing the food cost is as a cost mark-up.

Cost mark-up

The cost mark-up is determined by reversing the food cost percentage equation:

cost mark-up = selling price/portion cost

The cost mark-up can also be determined by dividing the food cost percentage into 1. The equation then becomes:

cost mark-up = 1/food cost percentage

In the example above, where the portion cost is $1.20 and the selling price is $3.50, the cost mark-up can be solved in the following ways:

cost mark-up = selling price/portion cost

= $14.00/$4.80

= 2.9166

= 2.92

or cost mark-up = 1/food cost percentage

= 1/34.285%

= 1/0.34285

= 2.91674

= 2.92

The cost mark-up can be used to determine a selling price when a portion cost is known by multiplying the cost mark-up and the portion cost:

Determine a selling price

selling price = portion cost x cost mark-up

For example, if the ingredients for a portion of soup costs $1.05 and the restaurant has a cost mark-up of 3.6, the menu price of the soup is:

selling price = portion cost x cost mark-up

= $1.05 x 3.6

= $3.78

The restaurant would charge at least $3.78 for the menu item if it wants to keep its mark-up margin at 3.6, which is about a 28% food cost percentage. This price might be adjusted because of competition selling the same item for a different price, price rounding policies of the restaurant or the whims of management. For example, many restaurants have prices that end in 5 or 9 (such as $4.99 or $5.95). Prices on such menus tend to be rounded to the nearest number ending in 5 or 9. No matter what the final menu price is, at least a base price has been established.

The problem with the above approach is it doesn’t explain how to select a food percentage or a selling price from which to derive the percentage. In many cases, the food percentage is based on past experiences of the manager, or by a supposed awareness of industry averages. For example, many people simply set their food percentage at 30% and never work out a more appropriate figure. Similarly, the selling price of a menu item is often the product of guessing what the market will bear: $4.50 for a bowl of soup may seem like a good deal or as much as a reasonable person might pay in that restaurant. Unfortunately, none of these methods takes into account the unique situations affecting most restaurants.

A more accurate way of computing a target food cost percentage is to estimate total sales, labour costs, and hoped-for profits. These figures are used to determine allowed food costs. The total of projected food costs is divided by the projected sales to produce a food cost percentage. The food cost percentage can be turned into a mark-up margin by dividing the percentage into 1, as shown above.

Example

For example, to determine the food cost percentage of a restaurant that has projected sales of $10 000 and labour costs of $6000, overhead of $1000, and a goal of before-tax profits of $500, the following procedure is used:

food costs = sales – (labour costs + overhead + profit)

= $10 000 – ($6000 + $1000 + $500)

= $10 000 – ($7500)

= $2500

food percentage = food costs/sales

= $2500/$10 000

= 0.25

= 25%

mark-up margin = 1/food percentage

= 1/25%

= 1/0.25

= 4

In this example, the menu prices would be determined by multiplying the portion costs of each item by the mark-up margin of 4. Adjustments would then be made to better fit the prices to local market conditions.

If the application of the derived mark-up margin produces unreasonable prices, then one or more of the projected sales, labour costs, overhead, or profits are probably unreasonable. The advantage of using this system is that it points out (but does not pinpoint) such problem assumptions early in the process.

A similar approach uses a worksheet as shown in Figure 21.

The worksheet to calculate menu prices.

Figure 21. Worksheet to Calculate Menu Prices

In the middle section of the worksheet in Figure 21, a food cost percentage is determined by subtracting other known cost percentages from 100%. Food costs are then determined in the bottom half of the sheet and a menu price derived by multiplying the total cost by the mark-up margin.

In this pricing method, a “profit wanted” percentage is added to the cost of each menu item. This builds some potential profit into the menu prices. If you were to price everything according to costs only, the restaurant would only ever be able to break even and never turn a profit.

Contribution Margins

On the surface, it seems that the lower the food cost, the more room there is for profit. In one sense this is true, as the percentage profit is obviously greater for an item that has a food cost percentage of 25% (or 75% percentage profit) than an item that has a food percentage cost of 45% (or 55% percentage profit). However, in terms of monetary profit, the issue is not that straightforward. What has to be determined is how much money the menu item generates. This calculation involves finding the contribution margin of each item.

Contribution margin

Contribution margin is determined by subtracting the cost from the selling price. An item that costs $2.00 to make and sells for $3.00 has a contribution margin of:

contribution margin = selling price – cost price
= $3.00 – $2.00
= $1.00

Consider the contribution margin of two menu items that have different food costs and food cost percentages shown in Figure 22.

Item Food Cost Selling Price Food Cost % Contribution Margin
Chicken $4.50 $16.50 27% $12.00
Steak $9.00 $24.00 38% $15.00

Figure 22: Contribution margin

In terms of percentage profit, the chicken is higher. However, in terms of money in the till, the steak creates more money that can be used to pay bills. The key to a good menu is not necessarily to just keep food cost percentages low; it is to also to keep contribution margins high.

Balancing the Menu to Achieve Targets

Menu Analysis

A basic menu analysis determines how often each item on the menu is sold. This basic statistic can be used with cost percentages, menu prices, and sales values to make generalizations about the relative value of each menu item. Figure 23 shows a menu analysis worksheet for a lunch menu. Most POS systems can generate this type of information at the end of a shift, day, week, or month.

MenuAnalysisFigure 23: Menu analysis worksheet

*C.M.= contribution margin

The statistics provided in a menu analysis have several uses. For example, the total sold statistics can be used to predict what future sales numbers will be. This information is valuable for ordering supplies and organizing the kitchen and kitchen staff to produce the predicted number of items.

Even more important than popularity is the contribution margin of each item. Often an average contribution margin is found and compared with the contribution margin of individual items.

 Average contribution margin

The average contribution margin in the example above is found by dividing the total contribution margin (total of Column I) by the number of sales (total of Column B):
average margin = total margin/number of sales

= $415.25/50

= $8.31

The contribution margin for each item is found by subtracting the cost of the item from the selling price. In the example in Figure 23, the contribution margins are given in Column F.

Some decisions can be made comparing items:

The type of menu analysis must be tempered with common sense. Because averages are used to determine an acceptable margin or level of sales, some menu items will automatically be under the average just as some will have to be above the average. If items that are under the average are replaced, the next time a menu analysis is done there will be a new average and other items under that average. Taken logically, your menu options will run out before you have every item being exactly at the average!

Given that menu items are usually broken down into categories, this type of analysis is most effective when comparing similar items. An analysis of all of the desserts or starters to compare their margins is much more effective than comparing the margin of a dessert against a lobster dinner, which by the very nature of its price and cost will always have a higher contribution margin.

Profitability

You want to sell menu items that have a high margin of profitability. The relative profitability of an item is calculated by comparing its contribution margin to the average contribution margin (ACM) of all items. The contribution margin is the selling price of a menu item minus the standard food cost of the item. This is the amount that the item contributes to the labour cost, other costs of doing business, and profit. The ACM equals the total contribution margin divided by total numbers of items sold. Profitable items have a contribution margin equal to or higher than the ACM.

Desserts and appetizers may have lower contribution margins than entrées. This is because these items generally have lower prices and cannot contribute the same dollar value of contribution margin, even though their food cost percentage may be lower than entrée items. Also, the restaurant may wish to tempt patrons to add these items to their purchase, increasing the average cheque size. If you can sell more to an individual guest, you increase the revenues without increasing the labour costs and other costs to the same extent.

For example, if the customer orders and appetizer before the entrée, he or she does not take up any more time in the restaurant (that is, the customer does not decrease seat turnover) because the appetizer is served and eaten during the normal waiting time for preparing the main dish. As well, the additional labour of the server is minimal because even without ordering an appetizer service may still be needed to provide additional bread or refill water glasses. Thus, the sale of the appetizer will increase the profitability of the restaurant even though the contribution margin is not as high.

Desserts may also have a low contribution margin. Often desserts are purchased ready-made (e.g., cakes and cheesecakes). There may be little labour cost in serving these items so the overall contribution of the dessert item to profitability is high.

Items that require little preparation (that is, have a low labour cost) may still generate a significant contribution to margin even when their food costs are higher. Even if the food cost of the item was very high and the CM low, you would want to keep this item because the combined labour cost and food cost is low. Thus the amount this item contributes to the fixed cost of the business is high.

Potential Profitability of Menu Items

To determine the potential profit in a menu item, you must have a good idea of the potential cost of producing the item. Pre-costing the menu means you determine the cost of producing every item on the menu under ideal conditions. The assumption is that cooks will follow directions, the portions will be accurately measured, and all the portions will be sold. The results are the optimum costs; in reality costs could be higher.

Popularity

Another factor to consider when reviewing your menus is the popularity of an item. Popularity is determined by comparing sales of items to expected popularity. The expected popularity is the predicted menu mix (sometimes called the sales mix) if each of the menu items in a category were equally popular.

An example is provided in Figure 24, which lists seven appetizers. The expected popularity would be 100% divided by 7 (the number of menu items) or 14.3%. Menu analysis assumes that popular items have sales of 70% or more of the expected popularity. In the example, appetizers would have to exceed 10% (70% of 14.3%) of appetizer sales in order to be considered popular. Which of the items are popular?

popularity_of_an_itemFigure 24: Menu analysis worksheet

*C.M.= contribution margin

You can see at a glance that Dry Ribs is the most popular appetizer, followed by Thai Salad and Cajun Caesar. Nachos and Soup & Salad fall just slightly over the 10% boundary. Thai Wings and Calamari show dismal results in terms of popularity with only 4.63% and 2.84% of appetizer sales.

Sales of menu items are analyzed to put menu items in four categories:

Figure 25 displays graphs the popularity of the appetizers from the example over these four categories. The graph shows popularity on the vertical axis and contribution margin on the horizontal axis. A line is drawn vertically to indicate the ACM and horizontally to show 70% of expected popularity. This allows you to see at a glance which category an item falls into.


Analysis of popularity and profitability of appetizers

Figure 25: Analysis of popularity and profitability of appetizers


The graph shows that Thai Wings and Calamari were very unpopular menu items, but it also provides information on profitability? Thai Wings has a contribution margin that is lower than the ACM for appetizers. Calamari has a contribution margin that is higher than the ACM.

Computer programs may automatically calculate contribution margins and popularity. The information may be presented in tables or spreadsheets as shown above, or in a four-box analysis, with less detail, as shown in Figure 26.

  Unprofitable Profitable
Popular

Thai Salad

Soup and Salad

Dry Ribs

Cajun Caesar

Nachos

Unpopular Thai Wings Calamari

Figure 26: Four-box analysis of appetizer items

Menu Revisions

Popular and profitable items are ones you want to maintain on your menu. Maintain the specifications of the item rigidly. Do not change the quality of the product served. Feature the item in a prominent location on the menu. You want to sell this item, so make sure that customers see it. Have servers suggestively sell the item. For example, when asked for suggestions, they could say, “You may want to try our Linguine Chicken. It is very popular. It has a cream sauce with lots of fresh basil.” Test the possibility of increasing prices by raising the price slightly.

If an item is popular but not profitable, you want to see if you can increase the contribution margin without reducing its popularity. Increase prices carefully and gradually. If the item is attractive because of its high value, it may still be a good value after a price increase. You could also increase the contribution margin by reducing the cost of the accompaniments. For example, you might substitute less costly vegetables. You might also try to reduce costs by decreasing the portion size. If you are unable to improve the item’s popularity, you may want to relocate it to a lower profile part of menu. If the item has a very low labour cost, you may be able to justify the lower contribution margin because less revenue is needed to compensate for the labour cost.

Not popular but profitable items are often a puzzle. You want to sell these items, but your challenge is to encourage the guests to buy them. Shift demand to these items by repositioning them on the menu. Encourage servers to suggestively sell these items. Consider decreasing the price slightly or adding value by offering a larger portion size, more expensive accompaniments or garnishes. However, you need to be cautious so that you do not change the item into a popular but unprofitable item.

Items that are neither popular nor profitable are obvious candidates to remove from the menu. They are not pulling their weight. The only time such an item might be left on the menu is if it provides an opportunity to use leftovers and has low labour costs associated with its preparation.

Using Specials and Feature Items

Another way to balance the menu is by using daily specials and feature items. For example, assume you have been tracking your food costs using a daily food cost control sheet (refer back to Figure 20). It is halfway through the month and you are running a slightly higher than average food cost for the month so far. Choosing to run specials that have lower food costs or having the staff feature and promote the better food cost items should help to bring the targets in line by the end of the month.

Arranging Items on the Menu

Another way of engineering the menu is by strategically arranging the items on the menu. Some menus use callout or feature boxes to highlight certain items, others have pictures featuring certain menu items, and others may note an item as a house specialty. These are all ways to attract the attention of the customer, and in most cases, you will find that it is these items that sell the best. If these items also have high contribution margins and/or low food costs, they will increase profitability. Featuring the items with the lowest margins and highest food costs will have the opposite effect, and likely mean that you will not be in business for very long.

There are also some psychological reasons that things will sell on a menu. Often the most expensive or the least expensive item will not sell as well as other items on the menu because customers do not wanting to appear either extravagant or cheap in front of their guests. Using descriptions that entice the customer (e.g., “award-winning,” “best in the city”) will increase the sale of a particular item, but make sure you can deliver on the promise!

All in all, balancing the menu is something that takes time and experience to do well, but is a skill that you will need to run a profitable kitchen.

4

Labour Costing

15

Learning Objectives

Learning Objectives

  • Describe labour cost controls
  • Describe the principles of planning personnel requirements


16

Productivity

Controlling food costs is an important component of ensuring the profitability of your food service operation. However, food costs are only part of the picture. It is also necessary to control labour costs and forecast labour demands accurately if your business is to succeed. If you have more staff than is required, your labour costs will be too high and the company will lose money. If you have insufficient staff for a particular time period, customer service will suffer. Your goal in planning staffing needs is to match labour supply with customer volume so that you can provide quality service without excessive cost.

The food service industry is labour intensive. Technology has not replaced people with equipment. Unlike an automobile manufacturing plant, a restaurant cannot store its product until tomorrow or the next day if customers are not buying today. The same seat in the restaurant can only be sold a fixed number of times, based on the operating hours and number of turns (rate of turnover of customers). Therefore, it is critical to be able to forecast the number of customers you will have, the peak customer periods, and the staffing needed to provide service to those customers.

Sound human resource management policies can increase the productivity of staff. You must first choose qualified, interested, and trainable employees. Once these employees have been recruited, they must go through an orientation period in which they learn about the job and their responsibilities, the company’s way of doing things, and the required level of product quality. During this initial period, the employee’s productivity might be low.

Accurate job descriptions, a good orientation to the job, adequate on-the-job training, and good supervision with lots of feedback about job performance will assist employees in becoming productive as soon as possible.

17

Factors Affecting Working Performance

In addition to sound human resource management, other factors influence the required amount of labour. These factors include:

Menu Items

The number and complexity of menu items affects the production hours needed. If you have a menu with many items requiring difficult production techniques, you will require more preparation time per item. If your menu consists of a limited number of items requiring minimal preparation, you will require less time.

Use of Convenience Foods

Foods prepared on site require more preparation than similar menu items made with convenience foods, such as pre-portioned meats or desserts. You can reduce your labour costs by using convenience foods. However, you must consider two other factors: convenience foods can increase your food costs and may affect the quality of your product.

The second factor – affecting the quality of the product – is not always evident. Convenience foods made with high-quality ingredients and prepared exactly as recommended by the manufacturer can provide uniform portions of very good quality.

Type of Service

A restaurant featuring complex dishes with multiple components will require more labour than a cafeteria-style operation or a fast-food restaurant. Also, a restaurant that requires a higher level of skill to prepare complex dishes will require more experienced staff, which in turn means higher wages.

Quantity of Meals and Number of Meal Periods

The volume of business will affect the amount of labour required. Each restaurant will have a minimum staffing level without which it cannot operate. If it serves fewer people than this minimum staffing level can handle, the labour costs will be very high.

The number of meal periods can affect the productivity of the restaurant if different menus for each period require set-up and tear-down time. As well, different menus will usually mean a larger number of menu items, also affecting labour.

Facility Layout and Design and Production Equipment

Restaurant kitchens are often designed last, after all of the seating area has been designed. As a result, the space may be awkward and inefficiently laid out. To work efficiently, all work surfaces and storage areas required to produce an item should be located close together, as shown in Figure 27. This includes dry storage, refrigerated storage, freezers, storage for plates and glassware, work counters, grills, fryers, and ovens.

Kitchen layout can affect productivity

Figure 27: Kitchen layout can affect productivity

Poor kitchen layout can limit the number of individuals who can work efficiently. It may require time-consuming trips to distant storage areas to obtain food items or dishes. If the layout of the kitchen is too spread out, the minimum staff needed to operate each station may increase. For example, if a salad preparation station is located away from the main kitchen, you may require a salad preparation person even when the restaurant is not busy.

Production equipment such as mechanical peelers, choppers, and mixers can reduce the amount of time spent doing these tasks. The key in selecting the appropriate facility design and equipment is to match these parameters to expected volume of business. For example, if you purchase too large a mixer for the volume of business, the work involved in cleaning the machine after use will not warrant the extra expense of purchasing the equipment. On the other hand, too small a mixer will reduce efficiency as you will be unable to mix the quantities needed in a single batch.

Similarly, if your kitchen layout is very compact, you may be able to run efficiently with only one cook. However, you may be unable to meet the demands of a high volume of sales because the kitchen is too small to accommodate more than a couple of staff.

Work Environment and Number of Hours Worked

A hot, humid, noisy environment reduces comfort and increases stress and may negatively affect performance. Long hours and hard work without reasonable breaks can lead to reduced productivity. The same is true if you are understaffed. Not having enough staff means that everyone else has to work harder or for longer hours, resulting in tired staff and reduced productivity.

Productivity Standards

A first step in determining staffing needs is to establish productivity standards. These standards must take into account the amount of time necessary to produce food of the required quality. The standards are based on procedures dictated by standard recipes.

Productivity standards are measured in labour dollars or labour hours. Labour dollars measure productivity in terms of the number of dollars that must be paid out in labour to generate a certain revenue. The advantage of this approach is that budgets and financial statements are also expressed in dollars so comparisons can be easily made. However, it can be very time-consuming to calculate the labour dollars given different wage and salary scales. Labour hours must still be calculated because the number of hours determines wages.

Labour hours indicate the number of hours of labour needed to produce a given number of meals or generate a certain amount of sales income. When you use labour hours as a standard, it is less time-consuming to calculate. As well, some simple tasks may take the same amount of time to complete, whether they are performed by a chef or a dishwasher.

Determining Requirements

The productivity standard is determined by comparing number of labour hours scheduled to meals served or to sales income generated. It can be produced by department, by shift, by position, or by position and shift. More detailed standards make it easier to pinpoint problem areas and take corrective action. The most detailed is to prepare productivity standards by position and shift. This allows you to examine the efficiency of each staff member.

It makes sense to look at each position and shift. For example, a breakfast cook working with a limited breakfast menu and items that are easy to prepare can produce many more meals in a hour than the cook on your evening shift who has a large number of menu items with more elaborate preparation needed. Generally, more servers are needed than cooks for a given number of meals. Fewer dishwashers may be required. If only a single labour standard is developed for the restaurant, it will be harder to pinpoint problems with labour costs.

Staffing Guide

A staffing guide tells the manager how many labour hours are needed for each position and shift to produce and serve a given number of meals in the given restaurant. It incorporates the productivity standards. It tells managers what number of labour hours are needed for the volume of business forecast for a given meal period. The labour hours can be converted into labour dollars to establish standard labour costs.

The staffing guide serves as a tool for planning work schedules and controlling labour costs. The labour hours in the guide can be converted into labour dollar and standard labour costs by multiplying the labour hours for each position by the wage scale for that position. The staffing guide should be based on the performance of good employees. When scheduling new employees who have not completed an orientation training period, allowances will have to be made for their lower productivity.

This form of staffing guide is much more useful than industry guidelines that do not take into account the specific factors which affect the productivity in your workplace. It may still be useful to compare your staffing guide to other properties in order to assess how competitive you are.

An example of a staffing guide is shown Figure 28. Note that the staffing guide shows the minimum number of staff per peak service period.

Type of Restaurant Servers Bus Persons Chef or Sous Chef Cooks Dishwashers Hosts
Coffee shop 1 per 25 seats 1 per 5 servers 1 per shift 2 per 65 meals 1 per 100 meals 1 per 10 servers
Casual dining room 1 per 20 seats 1 per 4 servers 1 per shift 2 per 50 meals 1 per 65 meals 1 per 8 servers
Formal dining room 1 per 15 seats 1 per 2 servers 1 per shift 2 per 40 meals 1 per 65 meals 1 per 4 servers

Figure 28: Staffing guide

Fixed Labour Costs

One factor that must be considered before developing a staffing guide is fixed costs. Fixed costs refer to the costs of running the operation that do not vary depending on the volume of business. For many businesses, the cost of the building, heating, lighting, insurance, and other similar costs are fixed. They do not change if the restaurant is busy or half empty. In fact, they continue even when the restaurant is closed.

Some labour costs are also fixed. If a restaurant has salaried employees, these costs are fixed and do not change depending on the volume of business. The business must pay the salary of these employees, even if the restaurant is not busy. In most restaurants, management positions, including the chef and sous-chefs, are salaried employees.

Variable Labour Costs

Variable costs must also be accounted for. Variable costs are costs that change based on the volume of the business. Food costs are the most obvious example of variable costs. Provided that the restaurant has not overstocked food, food costs will increase in a direct correlation with the volume of business. Labour hours above the salaried staffing levels are also variable costs. As the volume of business increases, hourly labour costs will increase proportionately.

Peak Periods

When the staffing guide is used to develop a staff schedule, the supervisor needs to consider the peak periods. For example, if the volume reaches 150 meals, 10.5 labour hours may be needed in the kitchen. An analysis of sales shows that the busiest period is between 6 p.m. and 9 p.m. The supervisor might schedule the cooks so that the first cook comes in from 4:00 p.m. to 9:30 p.m. and the second cook comes in from 6:00 p.m. to 11:00 p.m. This would ensure that there are two cooks available to prepare meals throughout the busiest period.

Scheduling Staff

The scheduling of staff is based on the labour hours needed to meet the projected sales volume. The supervisor also needs to keep an eye on labour dollars by considering whether staff on a lower wage scale could be scheduled. For example, on holidays or other times when overtime rates must be paid, it would be less costly to bring in a new employee who is not eligible for statutory holiday pay. Other factors to consider when developing schedules include the following:

No matter how well you have planned the schedule, problems can arise. A staff member may call in sick or fail to show up without warning. The volume of sales may be lower or higher than anticipated. You must have contingency plans to deal with these problems. You could have a staff member (or a casual employee) on call in case he or she is needed. You also have to know the capabilities of your staff. On a night when you have mostly experienced, capable servers and cooks who can handle stressful situations, you may be able to get by with one fewer staff than your staffing guide calls for.

When demand is lower than expected, you must know what limitations there are on sending staff home early, while still maintaining the minimum staffing needed to remain open. Of course, you must comply with collective agreements and all legislation that affects your workplace. If you understand the agreements and the Employment Standards Act well, you will know what flexibility you have to adjust to the situations that arise in the workplace.

Staying within Budgeted Labour Cost

A comparison of actual to budgeted labour costs can be used to plan future expenses. If your labour costs are higher than desired, you need to find ways to reduce them. One method of analyzing the labour costs is to look at the actual and budgeted labour cost percentage. The projected labour cost percentage is calculated by dividing labour dollars by the projected volume of sales. The actual labour cost percentage is the actual labour dollars spent for a given time period divided by the actual volume of sales.

Example

A small restaurant has the standard labour hours and rates of pay shown in Figure 29.

Position Labour Hours for 50 Meals Labour Hours for 75 Meals Labour Hours for 100 Meals Hourly Rate (inc. benefits)
Food server 8.5 12.5 16 $9.85
Bus person 6.5 6.5 9 $10.95
Cook 7 10 14 $16.50
Steward 6.5 6.5 9 $12.00
Host 0 0 4 $10.25

Figure 29: Labour planning and cost sheet

Based on previous sales figures for a Tuesday night, the manager expected 77 customers on a particular Tuesday evening. The projected revenue for this evening was $1500.25. The manager developed a staff schedule based on the labour hours for 75 meals. The labour dollars were computed by multiplying the scheduled hours for each position by the hourly rate. The total labour cost for the evening was $437.30. The projected labour cost percentage was:

$437.30 ÷ $1500.25 x 100 = 29.1%

On this evening, the sales were down. Although 76 customers were served, very close to the number expected, the average cheque size was lower. Only $1425.95 worth of menu items was sold. The actual labour cost percentage was:

$437.30 ÷ $1425.95 x 100 = 30.7%

One of the best ways to improve productivity is to continually review and revise performance standards. Use the problem-solving process to identify the problem, generate alternatives, evaluate the alternatives, choose the best ideas, and implement them. Some questions you might ask yourself are:

After considering all of these factors, you may still not be able to reduce your labour costs. You may have to raise your menu prices to improve the profitability of your operation. Of course, you need to consider the price the market will bear and the prices charged by your competitors before taking such an action.

It is often useful to look at both your food costs and labour costs when deciding whether a price increase is needed. If your labour costs are a little higher than anticipated and your food costs are lower, there may not be a problem. Some companies use a figure of 70% to 80% as a target for the sum of labour and food costs. Another strategy is to have lower contribution margins, but increase your volume. This makes sense because the more volume you have, the more money is contributed toward meeting your fixed costs of doing business.

Position Performance Analysis

Productivity standards are developed by considering the labour hours needed to perform assigned tasks. During a designated observation period, employees are asked to perform their jobs, adhering carefully to all established policies and procedures. They are carefully observed to ensure compliance. For example, cooks would be expected to follow all standard recipes, take scheduled rest breaks, and meet the required quality standards. This process of analyzing productivity is called a position performance analysis.

The employee is observed over several shifts. At the end of each shift, the supervisor completes a report, as shown in Figure 30, which indicates the name of the employee observed, the meal period considered, the number of meals prepared, number of hours worked, and number of guests per labour hour. The supervisor also records comments on workflow, adequacy of service, problems that arose, etc.

Position:  

Name of employee:

Shift:  
Date Apr 5 Apr 6 Apr 7 Apr 8 Apr 9
Number of meals served
Number of hours worked
Number of meals per labour hour
Supervisor comments
General comments

Recommended meals/labour hour for this position 30

Performance review by:

Restaurant Manager

Figure 30: Position performance analysis

Tools like this can help you identify the productivity of each staff member. Perhaps one cook is capable of producing 40 meals to the same standard in the time it takes another cook to produce 30. The first cook is more productive, and therefore a better choice to schedule on the busier evenings. You may also use this analysis to set goals and identify development options.

All in all, food costs and labour costs make up the bulk of the costs in running a successful kitchen. Having a solid understanding of both and how to manage them will be key in running a successful food service operation, whether it be a food truck or a major hotel.

5

Budget and Business Planning

18

Learning Objectives

Learning Objectives

  • Describe the basic calculation of operating costs
  • Describe budgets and profit/loss statements
  • Interpret point-of-sale information


19

Goals

In order to make a profit and stay in business, a food service operator must be aware of costs. The biggest cost in most operations is the raw ingredients used in the preparation of menu items.

Labour costs are also a significant part of a restaurant’s operating costs. You must schedule enough staff to meet the labour demands of the food service operation without incurring unnecessary costs. Point-of-sale (POS) reports provide information that is useful in analyzing both food and labour costs. They can also help you review your menu to make it more profitable.

A basic understanding of accounting is a useful skill in the food service industry. In fact, budgeting and interpreting profit and loss statements are essential management skills.

20

The Basic Calculation of Operating Costs

Fixed Costs

A fixed cost does not vary in relation to sales. A typical fixed cost is rent. In most cases, the cost of rent does not vary from month to month in response to how many meals you serve. Rent tends to be a constant cost for the length of the lease agreement signed by the restaurant and the landlord of the building. Property taxes, insurance premiums, and equipment depreciation are all fixed costs.

Some labour costs are often considered to be fixed. Those staff who are paid regardless of the amount of business being generated have a predictable cost that remains constant during the life of the contract or understanding you have with the employees. Such staff often includes full-time cashiers, managers, the head chef, and bookkeeper. Janitorial services are considered a fixed cost. The cost of staff who are hired as a result of an increase in business, technically, should not be considered a fixed cost.

To a certain extent, basic energy costs such as heat and light are fixed in that it is possible to determine a minimum level of need for energy regardless of the number of sales. Costs above the minimum level should reflect an increase in business and so often are not considered fixed, but in these examples, energy costs will be considered fixed costs.

Fixed costs themselves can be categorized as controllable and non-controllable.

A controllable cost is one that can be changed in the short term. For example, even though janitorial cost has been budgeted as a constant cost, it may be possible (if there is no ironclad contract with a janitorial service) to reduce the service and the cost on short notice. Advertising and promotion are also controllable fixed costs as a decision to change the amount of money spent can be made very quickly.

Non-controllable fixed costs are those costs that cannot be changed quickly by management. The most common non-controllable fixed cost is rent or lease payments and depreciation.

In most basic calculations, the only truly fixed costs are overhead costs, those ongoing expenses required to operate the business that are not direct costs of producing the food or presenting the service.

Variable Costs

Variable costs are directly related to sales. For example, the use of napkins or linen often varies due to an increase or decrease in sales. Other variable costs include food, beverages, and some labour costs. Usually, the major variable cost is food and most of the labour.

Variable costs are controllable. Less expensive ingredients can be purchased, portion sizes can be changed, and some workers can have their hours reduced usually on short notice.

In most basic calculations, the only variable cost used is food cost.

Semi-variable Costs

Labour costs are sometimes categorized as semi-variable because some are fixed but many are variable. In most situations labour cost is fully controllable. That is, you are in control of how many people work how many hours per day through proper scheduling. For basic calculations, labour is often given a category all on its own. In this context, labour costs will be considered semi-variable.

Breakeven Point

The only way costs can be recovered is through sales. When the sales income equals the cost for labour, overhead, and food, the breakeven point has been reached. That is, the breakeven point occurs when

sales = labour + overhead + food costs

Example

Labour for a week is $3000, overhead is $2000, and food cost is $4000. Therefore, the breakeven point for sales occurs at $9000, which means in order to stay in business, this operation must have sales of at least $9000 each week. Any amount above $9000 is profit,

The profit is determined by subtracting the total costs from the sales. That is,

profit = sales – (labour + overhead + food costs)

Cost Percentages

The breakeven point determined above is in raw dollar figures. Of more importance in the industry are cost percentages in general and food cost percentage in particular. In a well-run operation, cost percentages will remain relatively constant even though the dollar figures can vary widely week to week or month to month. However, if volume increases, so will efficiency which will, in turn, lower the production costs and increase the profits.

A cost percentage is derived by dividing a cost by the sales and expressing the answer as a percentage. That is, in general,

cost percentage = cost/total sales

and, in particular,

food cost percentage = cost of food/total sales

labour cost percentage = cost of labour/total sales

overhead cost percentage = cost of overhead/total sales

To illustrate the use of these formulas, consider the example below.

Example

A restaurant has total sales of $2500. The food cost was $1000, labour cost was $850, and overhead was $650.

Determine the cost percentages. Remember that percentages are always expressed as a portion of 100, and therefore the decimal figure resulting from the cost divided by total sales should be multiplied by 100.

food cost percentage = cost of food/total sales
= $1000/$2500
= 0.4
= 40% (0.4×100)

labour cost percentage = cost of labour/total sales
= $850/$2500
= 0.34
= 34% (0.34 x 100)

overhead cost percentage = cost of overhead/total sales
= $650/$2500
= 0.26
= 26% (0.26 x 100)

In this example, the sales figure used is actually the breakeven point. In most instances, the total sales will be more than the breakeven point and the excess represents the before-tax profits of the business.

Example

A restaurant has sales of $3500, food costs of $1250, labour costs of $800, and overhead costs of $700. Determine the cost and profit percentages.

food cost percentage = $1250/$3500
= 0.357
= 35.7%

labour cost percentage = $800/$3500
= 0.2285
= 22.9%

overhead cost percentage = $700/$3500
= 0.2
= 20%

profit in dollars = total sales – (food cost + labour cost + overhead cost)
= $3500 – ($1250 + $800 + $700)
= $3500 – ($2750)
= $750

profit percentage based on total sales = $750/$3500
= 0.214
= 21.4%

The before-tax profit percentage is over 20% in this example. Most restaurant operations probably do not reach this high a profit figure.

Another way to determine the percentage profit is to add the cost percentages and subtract the answer from 100%. Using the example above,

profit percentage = 100% – cost percentages

= 100% – (35.7% + 22.9% + 20%)
= 100% – 78.6%
= 21.4%

Note: All of the prices/costs used are examples and not intended to reflect the current costs of ingredients, labour, or menu items.

Interpreting Cost Percentages

Cost percentages are useful because they allow you to compare the performance of an operation at separate times during the year or to compare two similar restaurants. They also allow you to make generalizations about types of restaurant operations. For example, fast-food restaurants often rely on convenience foods that are expensive to purchase. In these restaurants, food percentage costs can be slightly higher, but the labour cost tends to be lower than in full-service restaurants. The profit is derived by having a high turnover of products and keeping labour costs low.

Fine-dining, high-margin restaurants tend to rely less on convenience foods and more on quality ingredients and a high level of service. Although food costs in raw dollars are high for such restaurants, the food cost percentage may be lower than in fast-food restaurants because menu prices are much higher. Labour cost percentages also tend to be higher because higher trained personnel is needed. The profit in these operations often is derived from serving relatively few customers but collecting more dollars per sale compared to more casual places that operate based on high volume.

Using Cost Percentages

The basic equation for cost percentages can be written several ways:

cost % = cost/total sales

sales = cost/cost %

cost = total sales x cost %

These formulas are useful when restaurant management decides on a cost percentage value and then has to see what that percentage means in terms of menu prices.

Example

Management has decided that a minimum food percentage of 30% must apply to all menu items. You wish to introduce an item that costs $4.50 in actual food costs. To find the menu price (selling price) you would do the following:

selling price = cost/cost %
= $4.50/30%
= $4.50/0.3
= $15.00


Example

A group of people wish to have a Christmas banquet meal at a cost to them of no more than $18.50 per person excluding tax and gratuity. If the food percentage is 30%, you can determine the actual food cost by doing the following:

cost = selling price x cost %
= $18.50 x 30%
= $18.50 x 0.30
= $5.55

The cost figure is used to determine the banquet items that could be produced by the restaurant using no more than $5.55 in raw materials per serving.

For additional information on cost percentages and establishing menu prices, refer to the chapter on food costing.

Sales Ratios and Other Statistics

Very often, restaurant managers generate statistics to determine the efficiency of their operation. Some of these statistics are based on dollar sales while others are based on non-monetary items such as the number of customers in the restaurant during a busy or slow time period. These statistics are used to determine trends in sales, identify menu items that are not moving, calculate staffing requirements, and so forth.

The statistical data tends to be quite straightforward. For example, total dollar sales is simply the amount of money that has gone through the cash register over a designated period of time (a day, a week, a month, or a year). Sometimes the total dollar sales figure is divided by the number of customers served to produce an average dollar sale (average cover). The average dollar sale is useful if the impact of a new menu or a special sales promotion has to be evaluated.

Sales per server and average sales per server are often used to determine the effectiveness of individual waiters and waitresses. The statistics are compiled by either just noting the total number of sales of each server over a period of time (sales per server) or by dividing the total number of sales by the number of servers (producing the average sales per server). In many restaurant operations, these statistics are automatically produced by a point-of-sales terminal.

Some chain restaurant managers compute a sales-per-seat statistic by dividing the total sales by the number of seats in their restaurant. The statistic is useful in comparing the activity among members of a chain of restaurants.

Rational menu changes can be made only after data has been collected that can be used to analyze the popularity of the dishes offered. In older operations, current statistics are often compared to historical statistics so trends can be predicted. The most common menu statistic is simply the number of times each item on the menu is ordered over a given period.

Closely related to the number of times a menu item is ordered is the sales mix of the restaurant. Sales mix is determined by comparing the relative popularity of, for example, all entrées by expressing the number sold of each entrée as a percentage of all the entrées sold.

Example

Over a one-month period a total of 1200 entrées are sold of which 450 are steak sandwiches, 300 are fish and chips, 350 are hot roast beef sandwiches, and 100 are grilled cheese sandwiches. The sales mix percentages are:

sale percentage = entrée types sold/total entrées sold
steak sandwich percentage = 450/1200
= 0.375
= 38%

fish and chips percentage = 300/1200
= 0.25
= 25%

roast beef sandwich percentage = 350/1200
= 0.29
= 29%

grilled cheese sandwiches = 100/1200
= 0.083
= 8%

The sales mix is about 38% steak sandwiches, 25% fish and chips, 29% hot roast beef sandwiches, and 8% grilled cheese sandwiches.

Seat turnover might be used to determine staffing. This statistic is simply the number of customers in a restaurant over a period of time (usually a busy period or a slow period) divided by the number of seats in the restaurant. For example, if a 50-seat restaurant serves 165 meals at lunch time, the seat turnover is 3.3, which means that the average seat was used over three times during that period. This can be valuable information for staffing arrangements.

Almost all of the statistics in the restaurant trade are now automatically collected by computers built into electronic cash registers or ordering equipment. Small operations may have to collect this data by observation.

21

Operating Budgets and Income Statements

An operating budget is management’s plan for generating revenue and incurring expenses over the time of the budget. Operating budgets are usually in effect for a fiscal year, but they are subject to alterations if anticipated revenues or costs change markedly from what was projected.

In the following section, it is assumed that there are records from previous years that can be used to create an operating budget. When a business first starts up, the operating budget is based upon a careful analysis of the market and the expertise senior management brings with them to the new enterprise from other jobs in the food service industry. Creating a first budget is beyond the intent of this book.

A budget is developed by calculating projected sales, determining required profit levels and fixed expenses, and calculating food costs.

Sales/Cost/Profit Equation

Profit can only occur when sales exceed the breakeven point. That is,

profit = sales – costs

= sales – (labour + food costs + overhead)

or  sales = labour + food costs + overhead + profit

Overhead is a fixed cost. Your rent payment usually is the same regardless of the level of your sales. Labour costs are semi-variable costs. As was explained earlier, some labour costs are constant and must be paid even if sales do not meet expectations while other labour costs are the result of increases in sales.

Since labour costs are not truly fixed, the variable part of the cost of labour can be manipulated in times of poor sales by cutting back on paid hours, introducing shift changes, and even laying off personnel. Personnel working in the food industry often learn how flexible their hours can become in times of poor sales!

Hoped-for profit can be treated as a fixed cost. Often, profit is considered to be that which is left over after all costs have been paid. However, more and more businesses try to treat profit as an expense that should be met.

With the exception of some labour costs, only the cost of food is truly a variable cost in the cost/profit equation because the amount of food purchased is directly influenced by the amount of food sold by the establishment.

By determining overhead, labour, and profit costs, you can calculate optimum food costs by subtracting all the other costs from projected total sales. This relationship can be seen by manipulating the sales equation presented above (sales = labour + food costs + overhead + profit) into food costs = sales – (labour + overhead + profit).

Planning for a Profit

The first step in planning for a profit is to determine how much return the investor or company needs. The restaurant business is considered a risky investment. Some people make a lot of money; more people go broke. If people can earn 10% by investing their money in safer investments, investors will expect to earn more than this as they have a chance of losing all their money.

Example

A restaurant owner has put up $100 000. The owner wishes to have a profit of 15%. The cost to the restaurant for the use of this money is:

cost (profit) = principle x interest rate

= $100 000 x 15%

= $100 000 x 0.15

= $15 000

Calculating Other Costs

Remember, fixed costs include rent, heat, light, and other overhead costs. For this discussion, assume the restaurant has been in business for a number of years and last year the overhead costs amounted to $55 000. These costs have been increasing at about 5% per year.

Projected Food Cost

The projected fixed cost for next year will be:

new overhead cost = old overhead cost + increase in overhead cost

= $55 000 + (5% of old cost)

= $55 000 + (0.05 x $55 000)

= $55 000 + ($2750)

= $57 750

The semi-variable cost of labour can be treated in much the same manner. Assume that last year labour costs were $75 000 which was an increase of 5% over the previous year. Other indicators suggest that labour costs will increase about the same for the coming year.

Projected labour cost

The projected labour cost for next year will be:

new labour cost  = old labour cost + increase in labour cost

= $75 000 + (5% of old cost)

= $75 000 + (0.05 x $75 000)

= $75 000 + ($3750)

= $78 750

Calculating Projected Sales Levels

To forecast sales it helps to have a past record on which to base projections. Assume such records are available and the last year sales were at $225 000. It is thought sales can be increased by 10% this year.

Projected sales

new sales level  = old sales level + increase in sales level

= $225 000 + (0.10 x $225 000)

= $225 000 + $22 500

= $247 500

Calculating Food Costs

To calculate food costs, use the equation derived previously.

Food costs

food costs = sales – (labour + overhead + profit)

In the example being developed, food costs are:

food costs  = sales – (labour + overhead + profit)

= $247 500 – $78 750 – $57 750 – $15 000

= $96 000

If all the expenses are to be met, the restaurant should not spend more than $96 000 in food costs. From this amount, the restaurant must generate $247 500 in sales.

Cost Percentages

Once all the costs have been determined (predicted), it is fairly easy to determine cost percentages. In the example under discussion, the cost percentage can be determined using the basic cost percentage equation below.

Cost percentage

cost %  = cost/sales

labour cost % = labour cost/sales

= $78 750/$247 500

= 0.318

= 31.8%

overhead cost % = overhead cost/sales

= $57 750/$247 500

= 0.233

= 23.3%

profit %  = profit/sales

= $15 000/$247 500

= 0.0606

= 6.1%

food cost % = food cost/sales

= $96 000/$247 500

= 0.3878

= 38.8%

The information gathered above can be used to generate a projected budget.

Calculating Projected Sales

Past sales figures are collected from monthly up-to-date income statements and from the audited budget of the previous year. The past sales should be carefully analyzed to see if any trends are emerging. For example, if sales have been falling in the last quarter, you want to ask why, as the drop in revenue may be a sign of continuing trouble in the new fiscal year.

The assumption is usually made that growth in the past year will mean growth into the new year. This is probably true but only if the conditions of the new year are thought to be nearly the same as the past year. If a new restaurant is going in across the street, if the local mill is going to lay off 150 workers, if previously untaxed food is going to be subjected to a sales tax, or if the minimum wage is going to be increased and you depend on help paid at or near that level, past growth records may mean very little. Equally important are positive changes in the community. For example, an excellent review from a restaurant critic can have a huge impact on business that was not counted in your projections.

If possible, compare the monthly food sales of last year with its corresponding sales for the previous year. Again, this is only possible if the restaurant has been in business a few years. Such a comparison is shown in Figure 31.

Month Sales This Year Sales Last Year Difference Percentage Change
January $20 925 $19 020 $1 905 10%
February $21 390 $19 810 $1 580 8%
March $22 090 $19 725 $2 365 12%
April $23 020 $21 320 $1 700 8%
May $23 030 $21 730 $1 300 6%
June $23 950 $21 780 $2 170 10%
July $23 715 $21 365 $2 350 11%
August $23 720 $21 200 $2 520 12%
September $23 320 $20 710 $1 610 8%
October $25 110 $22 900 $2 210 10%
November $24 830 $22 200 $2 630 12%
December $24 900 $21 240 $3 660 17%
Totals $279 000 $253 000 $26 000 10%

Figure 31: Sales comparison year over year

The sales picture looks bright in Figure 31. Management could probably safely assume that next year the growth will continue. They would then draw up an estimated monthly sales chart.

The monthly projections can be used in the next fiscal year to track sales in relation to the projection. For example, if sales in January are significantly less than the projection, is it time to worry, or can the loss be picked up next month? That is the type of question management has to be constantly asking.

A monthly projection is shown in Figure 32. Last year’s sales are increased by 10%, which is the total percentage change in sales as reflected in Figure 31. Less conservative managers might be tempted to project a greater percentage increase based on the steady growth since June. However, it is usually best to err on the side of caution as it tends to be easier to handle excess income than it is to handle income shortfalls. But, if sales do increase dramatically, management should be prepared to redraw the budget.

Month Sales This Year Increase by 10% Projected Sales
January $20 925 $2 090 $23 015
February $21 390 $2 140 $23 530
March $22 090 $2 210 $24 300
April $23 020 $2 300 $25 320
May $23 030 $2 300 $25 350
June $23 950 $2 400 $26 350
July $23 715 $2 370 $26 085
August $23 720 $2 370 $26 090
September $22 320 $2 230 $24 550
October $25 110 $2 510 $27 620
November $24 830 $2 490 $27 320
December $24 900 $2 500 $27 400
Totals $279 000 $27 910 $306 910

Figure 32: Sales projections based on previous year’s growth

Determining Profit Levels and Costs

Again, the best plan is to analyze past costs and see if they can be lowered and to determine if the profit level must be adjusted. Costs tend to go up, but fixed costs may stay at the same level as in the previous year while some controllable costs might actually decline after careful analysis.

Costs include the following:

If the figures are available, monthly costs of the current and last operating years can be used. However, it is quite acceptable to use the annual current cost and prorate across every month by using cost percentage figures on the projected sales for each month.

To find annual cost figures, monthly reports can be used and summarized on a single form (Figure 33). Alternatively, the previous year’s income statement can be used.

Food cost $110 000
Payrolls costs $75 000
Other controllable costs $35 000
Occupancy costs $25 000
Depreciation $12 000
Profit (before taxes) $22 000
Total $279 000

Figure 33: Annual cost figures

To convert the figures into cost percentages, the individual costs are divided by the total sales (Figure 34). The percentages have been rounded off to the nearest percent.

Item Cost Cost Percentage
Food cost $110 000 39%
Payroll costs $75 000 27%
Other controllable costs $35 000 13%
Occupancy costs $25 000 9%
Depreciation $12 000 4%
Profit (before taxes) $22 000 8%
Total $279 000 100%

Figure 34: Annual cost percentages

If management feels that before-tax profits have to be increased by more than the amount that will be generated by multiplying the present profit percentage by the projected sales, decisions will have to be made regarding increasing sales or reducing costs.

Creating the Projection Budget

For simplicity, costs have not been broken down into the subcategories as they would appear on an actual budget statement. However, the example shown in Figure 35 provides a general idea of what a monthly budget looks like.

Creating_the_Projection_BudgetFigure 35: Sample budget

Notice the food sales projection amounts (Columns C and D) are from Figure 32 and the cost percentages (Column B) are from Figure 34. The actual amounts (Column E and F) would be computed from the monthly sales report.

The monthly budget form should be completed soon after all expenses are known. Most business will have accounting software that will track the costs and actual sales against the budgets.

Interpreting a Budget

The simplest way to examine a budget is to go through it in point form line by line. The following refers to Figure 35.

Income Statement

An income statement is an official financial document that presents the actual income and expenses of a business for a declared period of time — often the end of each month and at the end of the fiscal year.

The income statement is essentially the monthly budget with actual cost and income figures inserted. For example, the income statement from the example above (Figure 35) could be laid out as shown in Figure 36.

Income Statement for year ending December 31

Amount Percentage
Sales
Food sales $279 000
Total $279 000
Cost of sales
Food costs $110 000 39%
Gross profit on sales $169 000 61%
Controllable costs
Payroll $75 000 27%
Other $35 000 13%
Total $110 000 40%
Profit after
Controllable costs $59 000 21%
Occupancy costs $25 000 9%
Profit before
Depreciation  $34 000
Depreciation $12 000 4%
Profit before income tax  $22 000

Figure 36: Income statement

Income statements are also known as profit and loss statements. An example of a detailed profit and loss statement is shown in Figure 37.

End of December, 20—

Sales

Customers                                              $ 258 310     (92.6%)

Staff meals                                                  $ 12 500        (4.5 %)

Returns and promotions                            $8190        ( 2.9 %)

Total sales                                        $ 279 000


Cost of sales

Beginning inventory                            $ 16 500

Purchases                                                   $105 900

Ending inventory                                       $ 12 400

Cost of food sold                             $ 110 000      (39.4%)


Gross profit                                       $ 169 000     (60.6%)


Expenses

Payroll

Salaries and wages                            $ 63 750     (22.8%)

E. I. and WorkSafe                                    $ 6000        ( 2.2% )

Casual labour                                               $5250        ( 1.9% )


Other controllable costs

Advertising                                            $ 9 800        ( 3.5 %)

Laundry and linen                                      $ 7700        ( 2.8% )

Cleaning and paper supplies                  $10 500       ( 3.8 %)

Freight and cartage                                     $ 5250       ( 1.9% )

Office supplies                                              $ 1750       ( 0.6% )


Occupancy costs

Insurance                                               $ 3000        ( 1.1% )

Utilities and fuel                                         $ 2750       ( 1.0% )

Repairs and maintenance                            $500       ( 0.2% )

Lease                                                          $  18 750        ( 6.7% )


Depreciation                                           $ 12 000        ( 4.3% )

Total operating expenses           $ 147 000     (52.7%)


Total net profit                                  $ 22 000     ( 7.9%)


Note: The figures in brackets are cost percentage.

Figure 37: Detailed profit and loss statement

As you can see, there is a great deal of financial information that goes into the operation of a restaurant. Learning to understand and interpret the information is a skill that you will need to develop in order to manage a kitchen successfully.

22

Interpreting Point-of-Sale Information

Point-of-sale information is information that is gathered from your daily (or even hourly) receipts. Before computerized equipment was available, a supervisor would analyze the sales at the end of each day using the handwritten guest cheques. The total number of customers, the average cheque size, and the amounts of each entrée sold were tallied and recorded. The supervisor would also compute total sales, check cash against cash register totals, and complete other financial records. The information from the sales analysis was used by the chef or restaurant manager to manage inventory, predict volume of sales, and judge the popularity of items.

Types of Point-of-Sale Equipment

Today, most point-of-sales reports are generated automatically by point-of-sales (POS) hardware and software. A simple POS system may be a single cash register connected to a computer terminal that stores data, or it may be more complex with multiple terminals, handheld devices or tablets, and even smartphones connected to the system by supported applications, and also connected to printers at various points in the system that will print orders directly in the kitchen or bar area.

POS systems consist of a number of terminals connected to a central processing unit (Figure 38). For a terminal to process transactions, it must be connected to the central unit which houses the software and memory to process the information. Several types of terminals may be available. A pre-check terminal is used to enter orders; it has no cash drawer. Many pre-check terminals are now available in hand-held cordless models, or tablets or smartphones can be used for this purpose.

In some systems, a pre-check terminal is used to enter and print the orders for a table. The printed copy is then given to the kitchen to relay the order. In other systems, the order is sent directly from the pre-check machine to a printer in the kitchen or bar. The server does not have to carry the order over to the pickup counter.

A separate cashier terminal is used to settle guests’ cheques. The information may also be sent automatically to a journal printer and a manager workstation. The journal printer is usually located in a secure area and provides management with a detailed systems audit.

POS terminals connected to central processing unit

Figure 38: POS terminals connected to central processing unit

POS systems produce very detailed receipts (Figure 39). The wealth of information recorded by the machine allows much more detailed analysis of sales than was possible when guest cheques were handwritten.

Guest cheque produced by a POS system

Figure 39: Guest cheque produced by a POS system

POS information is a powerful tool that permits you to analyze menu performance and revise menus, forecast labour requirements, forecast inventory requirements, and analyze staff performance and sales. POS systems have the ability to generate

Sales Analysis Report

A sales analysis report analyzes sales by menu item. It can be computed for any period of time including an hour, a meal period (e.g., breakfast, lunch), a day, a week, or a month. The detailed reporting permits you to identify peak periods precisely. Fast-food restaurants will often want to analyze sales hourly to maximize the utilization of labour. The report includes:

Ideal Food Cost

The ideal food cost is based on actual items sold. It is calculated by multiplying the actual number of items sold by the standard food cost per item, then summing the costs for all menu items. The ideal food cost is then compared to actual food costs. The standard recipe and standard cost must be regularly updated and recalculated for the comparison to be valid. The two costs should be fairly close. Minor variations can be the result of special purchases of bulk items or the use of small quantities of some items that are not restocked on a weekly basis. Larger discrepancies may indicate waste due to spills and spoilage, pilferage, poor portion control, changes in quality and yield of stock (e.g., due to overcooking). Customer complaints can result in an item being discarded without being charged or a second item being cooked.

Example

You have noticed that your actual costs are higher than the ideal costs. You have been very careful about entering standard recipes and costs so you know that the comparison should be valid. You suspect poor portion control might be responsible. You could take a plate ready for service and scale all of the items on the plate. You might also check the weight of items that come portioned from the supplier. If your recipe specifies a 250 g (8 oz.) boneless chicken breast and the supplier is sending you chicken breasts that average 275 g, your food costs will be higher than expected.

Menu Analysis and Engineering

Sales analysis reports provide detailed information that can be very helpful in menu planning. The reports can analyze the profitability and popularity of each item. You can then use the results to review the menu and make changes. Refer to the section of this book on menu engineering for more detail on how to use this information.

Forecasting Inventory Requirements

POS information can also be used to forecast inventory and staff requirements. If you have sales records that indicate that in a typical week you sell 84 portions of salmon and 97 portions of sirloin steak, you can look at your current inventory and decide how much you need to order for the coming week. Figure 40 illustrates this scenario.

image

Figure 40. Forecasting Inventory Requirements

If you have detailed reports that indicate the sales mix over the week, you can predict the required quantities of stock more precisely. In this example (Figure 40), the sales shown for the entire week are broken down into daily totals. If you look at the sales for sirloin steak, you will notice that they are not evenly spread throughout the week. If you have a delivery on Friday that must last you until Monday, you must have at least 70 steaks on hand to last you through the weekend.

Forecasting Staffing Requirements

If you have detailed reports that indicate levels of sales by hour, meal period, and day, you will be able to identify peak days and times more easily. Figure 41 shows an example.

Meal Period Mon Tues Wed Thu Fri Sat Sun
5:00-6:00 56 72 48 54 53 119 123
6:00-7:00 94 156 117 119 94 121 131
7:00-8:00 145 183 156 173 156 163 165
8 :00-9:00 89 87 101 115 203 207 177
9:00-10:00 73 66 54 78 177 177 96
10:00-11:00 45 42 47 37 72 74 45
Total 502 606 523 576 755 861 737

Figure 41: Volume of sales by hour and day

You need to schedule staff for the restaurant. You need to know what times are busiest and how much staffing you will need for each period. In Figure 41, you can see that Monday and Wednesday are your slowest days, while Friday and Saturday are the busiest. There is also a different pattern for the peak times on weekdays versus the weekend. On Saturday and Sunday nights, volume peaks later in the evening and the peak period is much longer. For example, on Wednesday the peak of 156 guests comes between 7:00 p.m. and 8:00 p.m., while on Saturday, the peak is between 8:00 p.m. and 9:00 p.m.

Historical data collected from month to month and year to year is useful for projecting trends and seasonal variations in sales and, therefore, staffing needs. It may also be used to determine whether the sales figures you had for last Tuesday show an unexplained blip, or whether indeed Tuesday is usually a better day for your restaurant than Monday or Wednesday.

Another use for historical data is to project sales for holidays and special occasions. For example, last year, you had 250 guests for brunch on Mother’s Day. If this year, your average sales are up 10%, you might conclude that you need to have sufficient staff to handle 275 guests.

Manage Staff

POS information can also be used to manage staff. The software will allow you to prepare reports that track the sales of each server. You might be able to determine the average cheque size of guests served by each server. You could also track the amount of alcohol, appetizer, and dessert sales to see whether your servers are suggestively selling these items. If you have an incentive program to sell specific menu items or specials, you could track the staff member’s performance. These reports may be used to give feedback to staff on their performance and suggest methods of improving their sales.

Summary

Overall, the POS system has become a very effective tool for the industry to collect and manage a wide array of information. The advantages that the technology has brought are in the rapid calculation and analysis of a large amount of data, but all of these systems still require those who operate them and interpret the data to have a solid understanding of the principles of effective kitchen management and cost controls.

1

Key Terms

Key Terms

as purchased (AP) weight

The gross weight

average cover

The average amount spent by a customer in a meal period or month

baker’s percentage

A formula that states the ingredients in relation to the amount of flour

breakeven point

The point at which cost and revenue are equal

capital

Physical assets or money used in the production of goods and services

closing inventory

The amount of product on hand at the end of the inventory period

contribution margin

Portion of sales that can be applied against fixed costs; gross sales minus variable costs

count

1. Number of items in stock
2. Number of items in a case or to the pound or kilogram

directs

Products purchased and used as soon as they arrive or on the same day

edible product (EP) weight

The amount of usable product after cleaning or portioning

extending

Calculating the total value of goods on hand after taking a physical inventory

FIFO

First in, first out; a system of managing inventory so that the product received first gets used first

fixed costs

Costs which do not change based on the volume of business

food cost

The direct cost of food

inventory

Total goods in stock at any one time

invoice

A document indicating the amount owed for goods or services

labour cost

The cost of labour required for a fixed period of time; usually reflected as a percentage of sales

menu engineering

1. To maximize profitability by encouraging customers to buy what you want them to buy
2. Structuring of a menu to balance low- and high-profit items to achieve overall target food costs and profit

opening inventory

The amount of product on hand at the start of the inventory period.

overhead

The ongoing expenses required to operate a business that are not direct costs of producing goods or services

packing slip

A document indicating the products shipped for delivery

par stock

Maximum amount of an item that should be in stock at any one time

perpetual inventory

A system of tracking product as it is received and used, thereby keeping a running total of items on hand


physical inventory

A physical inventory requires that all items in storage be counted periodically.

point-of-sale (POS) system

A computerized system that coordinates customer purchases, sales, and costs through various linked terminals in a business

portion cost

The cost of a single portion

productivity

A measure of the amount of work done in a fixed period

profit

Any revenue left over after all costs have been covered

profitability

The amount of profit a business generates compared to sales, usually reflected in a percentage

purchase order

A document indicating the approval of a quantity of goods ordered from a supplier

ratio

The proportion between two amounts, usually with one item being referred to as 1

receiver

The individual responsible for accepting and checking deliveries

rotate

To rearrange inventory so that the oldest product is placed in front of newly acquired product

sales

Total revenue received for goods or services in a fixed period

specifications

Purchase criteria such as size, grade, packaging, market form

specific gravity

The density of a substance (mass for a given volume), when compared against a reference substance, such as water

standardized recipe

Consistent, tested recipe that is used by everyone in the kitchen to prepare the same product

stores

Goods taken from the storage area and used

turnover

1. Number of times in a period that inventory is turned into revenue
2. Number of times in a day that a seat is filled

variable costs

Costs that change based on business volume or sales

volume

1. Quantity of product or business
2. A type of measurement that measures the space taken up by a substance

yield

Amount of usable product

yield test

A test to determine the net or edible product (EP) weight from the gross or as purchased (AP) weight


2

About the Authors

This series of Open Textbooks has been developed collaboratively on behalf of the BC Provincial Cook Articulation Committee and go2HR. The committee would like to thank the following individuals for their contributions to developing, editing, and reviewing these texts:

Wendy Anderson Selkirk College
Martin Barnett Vancouver Island University
David Bensmiller University of the Fraser Valley
Fionna Chong Vancouver Community College
Ron Christian College of New Caledonia
Darren Clay Pacific Institute of Culinary Arts
Tim Curnow College of the Rockies
Corey Davison Thompson Rivers University
Michael French Northern Lights College
Rita Gower Vancouver Island University
Dennis Green go2HR
Linda Halingten go2HR
Ken Harper Vancouver Island University
Ken Jakes Jakes and Associates Meat Industry Consultants
Kimberly Johnstone Thompson Rivers University
Zito Kare go2HR
Stuart Klassen Okanagan College
Philip Lie Vancouver Community College
Christine Lilyholm North Island College
Tobias Macdonald Vancouver Community College
Robyn Mitz Selkirk College
Gilbert Noussitou Camosun College
Harry Pringle Selkirk College
Tony Rechsteiner College of New Caledonia
Debbie Shore Vancouver Island University
Ysabel Sukic Vancouver Community College
Brad Vennard Northwest Community College
Luzia Zemp Vancouver Community College