Human Nutrition

Human Nutrition

University of Hawai’i at Mānoa Food Science and Human Nutrition Program

Allison Calabrese, Cheryl Gibby, Billy Meinke, Marie Kainoa Fialkowski Revilla, and Alan Titchenal

Contents

1

Preface

‘A‘ohe pau ka ‘ike i ka hālau ho‘okahi

Knowledge isn’t taught in all one place


This open access textbook was developed as an introductory nutrition resource to reflect the diverse dietary patterns of people in Hawai‘’i and the greater Pacific. Using the ‘ōlelo no‘eau, or Hawaiian proverb, stated above, we believe that the principles of nutrition should be taught through the context of our communities and environments. Its intended audience are students from the University of Hawai‘i at Mānoa enrolled in the Food Science and Human Nutrition (FSHN) 185 course, The Science of Human Nutrition. However, this open access textbook may be of interest to other courses interested in teaching nutrition through a Hawai‘i-Pacific framed lens. This book is best viewed online using the pressbooks format however, multiple formats (e.g., pdf, epub, mobi) are also made available.

2

About the Contributors

This open access textbook was made possible through the collaboration of faculty, students and staff at the University of Hawai‘i at Mānoa demonstrating the value of working together, ho‘okahi ka ‘ilau like ana.

Faculty

Marie Kainoa Fialkowski Revilla

Marie Kainoa Fialkowski Revilla is a Native Hawaiian faculty member in the Department of Human Nutrition, Food, and Animal Sciences at the University of Hawai‘i at Mānoa. She teaches a number of courses in nutrition both face to face and online. She is dedicated to developing readily available and accessible nutrition education materials and curricula that reflect Hawai‘i and the Pacific to ensure that her students can relate to the content being learned. She enjoys spending time with her ‘ohana (family) at their home in Ahuimanu on the island of O‘ahu.

Alan Titchenal

Dr. Titchenal received a PhD in nutrition from the University of California at Davis with emphasis on exercise physiology and physiological chemistry. His work at the University of Hawai‘i at MānoaUniversity of Hawaii has focused on the broad areas of nutrition and human performance and translation of nutrition science for public consumption. This has included the “Got Nutrients?” project that provides daily messages on topics related to nutrition, fitness, and health and the publication of over 600 articles in the Honolulu Star-Advertiser newspaper.

Students

Allison Calabrese

Allison Calabrese is currently an MS graduate student in Nutritional Sciences Program at University of Hawai‘i at Mānoa. She obtained her BS from California Lutheran University in Exercise Science with an emphasis in Health Professions.  Her research interests include the relationship between diet and optimal health.

Cheryl Gibby

Cheryl Gibby was born and raised in Hawai‘i and is a wife and mother of three. She received her BA, MS in Nutritional Sciences, and PhD in Nutrition from the University of Hawai‘i at Mānoa. She has served as an instructor for the introductory Nutrition course at the University of Hawai‘i at Mānoa, and her research interests include infant and child health, dental and bone health, mobile health interventions, school nutrition policies, and online education.

Staff

Billy Meinke

Billy is the Open Educational Resources Technologist for the Outreach College at the University of Hawai‘i at Mānoa.

Contact Person

Dr. Marie Kainoa Fialkowski Revilla

marief@hawaii.edu

808-956-8337

1955 East West Road

Honolulu, HI 96822

University of Hawaii at Manoa

Department of Human Nutrition, Food, and Animal Sciences

Note to Educators Using this Resource

Please send edits and suggestions directly to Dr. Fialkowski Revilla on how we may improve the textbook. We also welcome others to adopt the book for their own course needs, however, we would like to be able to keep a record of users so that we may update them on any critical changes to the textbook. Please contact Dr. Fialkowski Revilla if you wish to adopt the textbook to your course’s needs.

3

Acknowledgements


This open resource textbook has been adapted from:

OpenStax Anatomy and Physiology // CC BY

Flat World Knowledge An Introduction to Human Nutrition // CC BY

Kansas State University Human Nutrition| goo.gl/vOAnR // CC BY

Chapters and sections were borrowed and adapted from the above existing OER textbooks on human nutrition. Without these foundational texts, a lot more work would have been required to complete this project. Mahalo (thank you) to those who shared before us, and are now sharing our own work.

Content that is not taken from the above three OERs should include the following attribution statement:

Licensed under a Creative Commons Attribution 4.0 International License. Human Nutrition by Marie K. Fialkowski Revilla, Alan Titchenal, Allison Calabrese, Cheryl Gibby, Billy Meinke. Download this book for free at:  http://pressbooks.library.ryerson.ca/vitalsign/

Edited and Reviewed by

Cecille Farnum — Ryerson University, Copyeditor

Changqi Leu — San Diego State University, Chapter reviewer

Billy Meinke — University of Hawai’i at Mānoa, Project manager

Paula Parslow — Private, Copyeditor

Trina Robertson — Saddleback College, Chapter reviewer

Allison Tepper — American University, Chapter reviewer

Special Thanks to

Bill Chismar – University of Hawai’i at Mānoa, Dean of Outreach College

Open Educational Resources

This text is provided to you as an Open Educational Resource (OER) which you access online. It is designed to give you a comprehensive introduction to human nutrition at no or very nominal cost.  It contains both written and graphic text material, intra-text links to other internal material which may aid in understanding topics and concepts, intra-text links to the appendices and glossary for tables and definitions of words, and extra-text links to videos and web material that clarifies and augments topics and concepts.

4

Acknowledgements: eCampusOntario

Share

If you adopt this book, as a core or supplemental resource, please report your adoption in order for us to celebrate your support of students’ savings. Report your commitment at www.openlibrary.ecampusontario.ca.

We invite you to adapt this book further to meet your and your students’ needs. Please let us know if you do! If you would like to use Pressbooks, the platform used to make this book, contact eCampusOntario for an account using open@ecampusontario.ca.

If this text does not meet your needs, please check out our full library at www.openlibrary.ecampusontario.ca. If you still cannot find what you are looking for, connect with colleagues and eCampusOntario to explore creating your own open education resource (OER).

About eCampusOntario

eCampusOntario is a not-for-profit corporation funded by the Government of Ontario. It serves as a centre of excellence in online and technology-enabled learning for all publicly funded colleges and universities in Ontario and has embarked on a bold mission to widen access to post-secondary education and training in Ontario. This textbook is part of eCampusOntario’s open textbook library, which provides free learning resources in a wide range of subject areas. These open textbooks can be assigned by instructors for their classes and can be downloaded by learners to electronic devices or printed for a low cost by our printing partner, The University of Waterloo. These free and open educational resources are customizable to meet a wide range of learning needs, and we invite instructors to review and adopt the resources for use in their courses.

I

Chapter 1. Basic Concepts in Nutrition

Introduction

ʻO ke kahua ma mua, ma hope ke kūkulu

The foundation comes first, then the building


tropical fruit on a table

Image by Jim Hollyer / CC BY 4.0


Learning Objectives

By the end of this chapter, you will be able to:

  • Describe basic concepts in nutrition
  • Describe factors that affect your nutritional needs
  • Describe the importance of research and scientific methods to understanding nutrition

What are Nutrients?

The foods we eat contain nutrients. Nutrients are substances required by the body to perform its basic functions. Nutrients must be obtained from our diet, since the human body does not synthesize or produce them. Nutrients have one or more of three basic functions: they provide energy, contribute to body structure, and/or regulate chemical processes in the body. These basic functions allow us to detect and respond to environmental surroundings, move, excrete wastes, respire (breathe), grow, and reproduce. There are six classes of nutrients required for the body to function and maintain overall health. These are carbohydrates, lipids, proteins, water, vitamins, and minerals. Foods also contain non-nutrients that may be harmful (such as natural toxins common in plant foods and additives like some dyes and preservatives) or beneficial (such as antioxidants).

Macronutrients

Nutrients that are needed in large amounts are called macronutrients. There are three classes of macronutrients: carbohydrates, lipids, and proteins. These can be metabolically processed into cellular energy. The energy from macronutrients comes from their chemical bonds. This chemical energy is converted into cellular energy that is then utilized to perform work, allowing our bodies to conduct their basic functions. A unit of measurement of food energy is the calorie. On nutrition food labels the amount given for “calories” is actually equivalent to each calorie multiplied by one thousand. A kilocalorie (one thousand calories, denoted with a small “c”) is synonymous with the “Calorie” (with a capital “C”) on nutrition food labels. Water is also a macronutrient in the sense that you require a large amount of it, but unlike the other macronutrients, it does not yield calories.

Carbohydrates

Carbohydrates are molecules composed of carbon, hydrogen, and oxygen. The major food sources of carbohydrates are grains, milk, fruits, and starchy vegetables, like potatoes. Non-starchy vegetables also contain carbohydrates, but in lesser quantities. Carbohydrates are broadly classified into two forms based on their chemical structure: simple carbohydrates, often called simple sugars; and complex carbohydrates.

Simple carbohydrates consist of one or two basic units. Examples of simple sugars include sucrose, the type of sugar you would have in a bowl on the breakfast table, and glucose, the type of sugar that circulates in your blood.

Complex carbohydrates are long chains of simple sugars that can be unbranched or branched. During digestion, the body breaks down digestible complex carbohydrates to simple sugars, mostly glucose. Glucose is then transported to all our cells where it is stored, used to make energy, or used to build macromolecules. Fiber is also a complex  carbohydrate, but it cannot be broken down by digestive enzymes in the human intestine. As a result, it passes through the digestive tract undigested unless the bacteria that inhabit the colon or large intestine break it down.

One gram of digestible carbohydrates yields four kilocalories of energy for the cells in the body to perform work. In addition to providing energy and serving as building blocks for bigger macromolecules, carbohydrates are essential for proper functioning of the nervous system, heart, and kidneys. As mentioned, glucose can be stored in the body for future use. In humans, the storage molecule of carbohydrates is called glycogen, and in plants, it is known as starch. Glycogen and starch are complex carbohydrates.

Lipids

Lipids are also a family of molecules composed of carbon, hydrogen, and oxygen, but unlike carbohydrates, they are insoluble in water. Lipids are found predominantly in butter, oils, meats, dairy products, nuts, and seeds, and in many processed foods. The three main types of lipids are triglycerides (triacylglycerols), phospholipids, and sterols. The main job of lipids is to provide or store energy. Lipids provide more energy per gram than carbohydrates (nine kilocalories per gram of lipids versus four kilocalories per gram of carbohydrates). In addition to energy storage, lipids serve as a major component of cell membranes, surround and protect organs (in fat-storing tissues), provide insulation to aid in temperature regulation, and regulate many other functions in the body.

Proteins

Proteins are macromolecules composed of chains of subunits called amino acids. Amino acids are simple subunits composed of carbon, oxygen, hydrogen, and nitrogen. Food sources of proteins include meats, dairy products, seafood, and a variety of different plant-based foods, most notably soy. The word protein comes from a Greek word meaning “of primary importance,” which is an apt description of these macronutrients; they are also known colloquially as the “workhorses” of life. Proteins provide four kilocalories of energy per gram; however providing energy is not protein’s most important function. Proteins provide structure to bones, muscles and skin, and play a role in conducting most of the chemical reactions that take place in the body. Scientists estimate that greater than one-hundred thousand different proteins exist within the human body. The genetic codes in DNA are basically protein recipes that determine the order in which 20 different amino acids are bound together to make thousands of specific proteins.

Figure 1.1 The Macronutrients: Carbohydrates, Lipids, Protein, and Water

Water

There is one other nutrient that we must have in large quantities: water. Water does not contain carbon, but is composed of two hydrogens and one oxygen per molecule of water. More than 60 percent of your total body weight is water. Without it, nothing could be transported in or out of the body, chemical reactions would not occur, organs would not be cushioned, and body temperature would fluctuate widely. On average, an adult consumes just over two liters of water per day from food and drink combined. Since water is so critical for life’s basic processes, the amount of water input and output is supremely important, a topic we will explore in detail in Chapter 4.

Micronutrients

Micronutrients are nutrients required by the body in lesser amounts, but are still essential for carrying out bodily functions. Micronutrients include all the essential minerals and vitamins. There are sixteen essential minerals and thirteen vitamins (See Table 1.1 “Minerals and Their Major Functions” and Table 1.2 “Vitamins and Their Major Functions” for a complete list and their major functions). In contrast to carbohydrates, lipids, and proteins, micronutrients are not sources of energy (calories), but they assist in the process as cofactors or components of enzymes (i.e., coenzymes). Enzymes are proteins that catalyze chemical reactions in the body and are involved in all aspects of body functions from producing energy, to digesting nutrients, to building macromolecules. Micronutrients play many essential roles in the body.

Table 1.1 Minerals and Their Major Functions

Minerals Major Functions
Macro
Sodium Fluid balance, nerve transmission, muscle contraction
Chloride Fluid balance, stomach acid production
Potassium Fluid balance, nerve transmission, muscle contraction
Calcium Bone and teeth health maintenance, nerve transmission, muscle contraction, blood clotting
Phosphorus Bone and teeth health maintenance, acid-base balance
Magnesium Protein production, nerve transmission, muscle contraction
Sulfur Protein production
Trace
Iron Carries oxygen, assists in energy production
Zinc Protein and DNA production, wound healing, growth, immune system function
Iodine Thyroid hormone production, growth, metabolism
Selenium Antioxidant
Copper Coenzyme, iron metabolism
Manganese Coenzyme
Fluoride Bone and teeth health maintenance, tooth decay prevention
Chromium Assists insulin in glucose metabolism
Molybdenum Coenzyme

Minerals

Minerals are solid inorganic substances that form crystals and are classified depending on how much of them we need. Trace minerals, such as molybdenum, selenium, zinc, iron, and iodine, are only required in a few milligrams or less. Macrominerals, such as calcium, magnesium, potassium, sodium, and phosphorus, are required in hundreds of milligrams. Many minerals are critical for enzyme function, others are used to maintain fluid balance, build bone tissue, synthesize hormones, transmit nerve impulses, contract and relax muscles, and protect against harmful free radicals in the body that can cause health problems such as cancer.

Vitamins

The thirteen vitamins are categorized as either water-soluble or fat-soluble. The water-soluble vitamins are vitamin C and all the B vitamins, which include thiamine, riboflavin, niacin, pantothenic acid, pyridoxine, biotin, folate and cobalamin. The fat-soluble vitamins are A, D, E, and K. Vitamins are required to perform many functions in the body such as making red blood cells, synthesizing bone tissue, and playing a role in normal vision, nervous system function, and immune system function.

Table 1.2 Vitamins and Their Major Functions

Vitamins Major Functions
Water-soluble
Thiamin (B1) Coenzyme, energy metabolism assistance
Riboflavin (B2 ) Coenzyme, energy metabolism assistance
Niacin (B3) Coenzyme, energy metabolism assistance
Pantothenic acid (B5) Coenzyme, energy metabolism assistance
Pyridoxine (B6) Coenzyme, amino acid synthesis assistance
Biotin (B7) Coenzyme, amino acid and fatty acid metabolism
Folate (B9) Coenzyme, essential for growth
Cobalamin (B12) Coenzyme, red blood cell synthesis
C (ascorbic acid) Collagen synthesis, antioxidant
Fat-soluble
A Vision, reproduction, immune system function
D Bone and teeth health maintenance, immune system function
E Antioxidant, cell membrane protection
K Bone and teeth health maintenance, blood clotting

Vitamin deficiencies can cause severe health problems and even death. For example, a deficiency in niacin causes a disease called pellagra, which was common in the early twentieth century in some parts of America. The common signs and symptoms of pellagra are known as the “4D’s—diarrhea, dermatitis, dementia, and death.” Until scientists found out that better diets relieved the signs and symptoms of pellagra, many people with the disease ended up hospitalized in insane asylums awaiting death. Other vitamins were also found to prevent certain disorders and diseases such as scurvy (vitamin C), night blindness (vitamin A), and rickets (vitamin D).

Table 1.3 Functions of Nutrients

Protein Necessary for tissue formation, cell reparation, and hormone and enzyme production. It is essential for building strong muscles and a healthy immune system.
Carbohydrates Provide a ready source of energy for the body and provide structural constituents for the formation of cells.
Fat Provides stored energy for the body, functions as structural components of cells and also as signaling molecules for proper cellular communication. It provides insulation to vital organs and works to maintain body temperature.
Vitamins Regulate body processes and promote normal body-system functions.
Minerals Regulate body processes, are necessary for proper cellular function, and comprise body tissue.
Water Transports essential nutrients to all body parts, transports waste products for disposal, and aids with body temperature maintenance.


Food Quality

A raw mango and avocado cut open

Image by David De Veroli on unsplash.com / CC0

One measurement of food quality is the amount of nutrients it contains relative to the amount of energy it provides. High-quality foods are nutrient dense, meaning they contain significant amounts of one or more essential nutrients relative to the amount of calories they provide. Nutrient-dense foods are the opposite of “empty-calorie” foods such as carbonated sugary soft drinks, which provide many calories and very little, if any, other nutrients. Food quality is additionally associated with its taste, texture, appearance, microbial content, and how much consumers like it.

Food: A Better Source of Nutrients

It is better to get all your micronutrients from the foods you eat as opposed to from supplements. Supplements contain only what is listed on the label, but foods contain many more macronutrients, micronutrients, and other chemicals, like antioxidants, that benefit health. While vitamins, multivitamins, and supplements are a $20 billion industry in the United States, and more than 50 percent of Americans purchase and use them daily, there is no consistent evidence that they are better than food in promoting health and preventing disease.

Everyday Connection

Make a list of some of your favorite foods and visit the “What’s In the Foods You Eat?” search tool provided by the USDA. What are some of the nutrients found in your favorite foods?

Image by David De Veroli on unsplash.com / CC0

http://www.ars.usda.gov/Services/docs.htm?docid=17032

Units of Measure

In nutrition, there are two systems of commonly used measurements: Metric and US Customary. We need both because the US won’t adopt the metric system completely.

The Metric and US Customary System

These are commonly used prefixes for the Metric System:

Micro- (μ) 1/1,000,000th (one millionth)
Milli- (m) 1/1000th (one thousandth)
Centi- (c) 1/100th (one hundredth)
Deci- (d) 1/10th (one tenth)
Kilo- (k) 1000x (one thousand times)

Mass

Metric System US Customary System Conversions
Microgram (μg) Ounce (oz) 1 oz = 28.35 g
Milligram (mg) Pound (lb) 1 lb = 16 oz
Gram (g) 1 lb = 454 g
Kilogram (kg) 1 kg = 2.2 lbs

Volume

Metric System US Customary System Conversions
Milliliter (mL) Teaspoon (tsp) 1 tsp = 5 mL
Deciliter (dL) Tablespoon (tbsp) 1 tbsp = 3 tsp = 15 mL
Liter (L) Fluid ounce (fl oz) 1 fl oz = 2 tbsp = 30 mL
Cup (c) 1 c = 8 fl oz = 237 mL
Pint (pt) 1 pt = 2 c = 16 fl oz
Quart (qt) 1 qt = 4 c = 32 fl oz = 0.95 L
Gallon (gal) = 4 qt 1 gal = 4 qt

Length

Metric System US Customary System Conversions
Millimeter (mm) Inch (in) 1 in = 25.4 mm
Centimeter (cm) Foot (ft) 1 ft= 30.5 cm
Meter (m) Yard (yd) 1 yd = 0.9 m
Kilometer (km) Mile (mi) 1 mi = 1.6 km

Lifestyles and Nutrition

Woman running up stairs

Image by John Towner on unsplash.com / CC0

In addition to nutrition, health is affected by genetics, the environment, life cycle, and lifestyle. One facet of lifestyle is your dietary habits. Recall that we discussed briefly how nutrition affects health. A greater discussion of this will follow in subsequent chapters in this book, as there is an enormous amount of information regarding this aspect of lifestyle. Dietary habits include what a person eats, how much a person eats during a meal, how frequently meals are consumed, and how often a person eats out. Other aspects of lifestyle include physical activity level, recreational drug use, and sleeping patterns, all of which play a role in health and impact nutrition. Following a healthy lifestyle improves your overall health.

Physical Activity

In 2008, the Health and Human Services (HHS) released the Physical Activity Guidelines for Americanshttps://health.gov/paguidelines/. The HHS states that “Being physically active is one of the most important steps that Americans of all ages can take to improve their health. The 2008 Physical Activity Guidelines for Americans provides science-based guidance to help Americans aged six and older improve their health through appropriate physical activity.” The guidelines recommend exercise programs for people in many different stages of their lifecycle. The HHS reports that there is strong evidence that increased physical activity decreases the risk of early death, heart disease, stroke, Type 2 diabetes, high blood pressure, and certain cancers; prevents weight gain and falls; and improves cognitive function in the elderly. These guidelines are scheduled for an update in 2018. Also unveiled recently are the Canadian Physical Activity Guidelines, which are available at the website of The Canadian Society for Exercise Physiologyhttp://www.csep.ca/english/view.asp?x=804.

Recreational Drug Use

Recreational drug use, which includes tobacco-smoking, electronic smoking device use, and alcohol consumption along with narcotic and other illegal drug use, has a large impact on health. Smoking cigarettes can cause lung cancer, eleven other types of cancer, heart disease, and several other disorders or diseases that markedly decrease quality of life and increase mortality. In the United States, smoking causes more than four hundred thousand deaths every single year, which is far more than deaths associated with any other lifestyle componentCenters for Disease Control and Prevention (CDC). “Smoking and Tobacco Use.” http://www.cdc.gov/tobacco/data_statistics/fact_sheets/health_effects/tobacco_related_mortality/Index.htm. Updated December 1, 2016. Accessed September 20, 2017..

Also, according to the Centers for Disease Control and Prevention (CDC), excessive alcohol intake causes an estimated seventy-five thousand deaths per yearCenters for Disease Control and Prevention. “Alcohol and Drug Use.” http://www.cdc.gov/healthyyouth/alcoholdrug/.  Updated June 7, 2012. Accessed September 20, 2017.. Staying away from excessive alcohol intake lowers blood pressure, the risk from injury, heart disease, stroke, liver problems, and some types of cancer. While excessive alcohol consumption can be linked to poor health, consuming alcohol in moderation has been found to promote health such as reducing the risk for heart disease and Type 2 diabetes in some people. The United States Department of Health and Human Services (HHS) defines drinking in moderation as no more than one drink a day for women and two drinks a day for menU.S. Department of Health and Human Services and U.S. Department of Agriculture. 2015 – 2020 Dietary Guidelines for Americans. 8th Edition. http://health.gov/dietaryguidelines/2015/guidelines/. Published December 2015.  Accessed September 2017..

Illicit and prescription drug abuse are associated with decreased health and is a prominent problem in the United States. The health effects of drug abuse can be far-reaching, including the increased risk of stroke, heart disease, cancer, lung disease, and liver diseaseNational Institute on Drug Abuse. Health Consequences of Drug Misuse.  https://www.drugabuse.gov/related-topics/health-consequences-drug-misuse. Updated March, 2017. Accessed September 20, 2017..

Sleeping Patterns

Inadequate amounts of sleep, or not sleeping well, can also have remarkable effects on a person’s health. In fact, sleeping can affect your health just as much as your diet. Scientific studies have shown that insufficient sleep increases the risk for heart disease, Type 2 diabetes, obesity, and depression. Abnormal breathing during sleep, a condition called sleep apnea, is also linked to an increased risk for chronic diseaseNational Sleep Foundation. Sleep Disorders. https://sleepfoundation.org/sleep-disorders-problems. Updated 2017. Accessed September 2017..

Personal Choice: The Challenge of Choosing Foods

There are other factors besides environment and lifestyle that influence the foods you choose to eat. Different foods affect energy level, mood, how much is eaten, how long before you eat again, and if cravings are satisfied. We have talked about some of the physical effects of food on your body, but there are other effects too.

Food regulates your appetite and how you feel. Multiple studies have demonstrated that some high fiber foods and high-protein foods decrease appetite by slowing the digestive process and prolonging the feeling of being full or satiety. The effects of individual foods and nutrients on mood are not backed by consistent scientific evidence, but in general, most studies support that healthier diets are associated with a decrease in depression and improved well-being. To date, science has not been able to track the exact path in the brain that occurs in response to eating a particular food, but it is quite clear that foods, in general, stimulate emotional responses in people. Food also has psychological, cultural, and religious significance, so your personal choices of food affect your mind, as well as your body. The social implications of food have a great deal to do with what people eat, as well as how and when. Special events in individual lives—from birthdays to funerals—are commemorated with equally special foods. Being aware of these forces can help people make healthier food choices—and still honor the traditions and ties they hold dear.

Typically, eating kosher food means a person is Jewish; eating fish on Fridays during Lent means a person is Catholic; fasting during the ninth month of the Islamic calendar means a person is Muslim. On New Year’s Day, Japanese take part in an annual tradition of Mochitsuki also known as Mochi pounding in hopes of gaining good fortune over the coming year. Several hundred miles away in Hawai‘i, people eat poi made from pounded taro root with great significance in the Hawaiian culture, as it represents Hāloa, the ancestor of chiefs and kanaka maoli (Native Hawaiians). National food traditions are carried to other countries when people immigrate. The local cuisine in Hawai’i would not be what it is today without the contributions of Japanese, Chinese, European, and other immigrant communities.

Factors that Drive Food Choices

Along with these influences, a number of other factors affect the dietary choices individuals make, including:

People choose a vegetarian diet for various reasons, including religious doctrines, health concerns, ecological and animal welfare concerns, or simply because they dislike the taste of meat. There are different types of vegetarians, but a common theme is that vegetarians do not eat meat. Four common forms of vegetarianism are:

  1. Lacto-ovo vegetarian. This is the most common form. This type of vegetarian diet includes the animal foods eggs and dairy products.
  2. Lacto-vegetarian. This type of vegetarian diet includes dairy products but not eggs.
  3. Ovo-vegetarian. This type of vegetarian diet includes eggs but not dairy products.
  4. Vegan. This type of vegetarian diet does not include dairy, eggs, or any type of animal product or animal by-product.

Achieving a Healthy Diet

Achieving a healthy diet is a matter of balancing the quality and quantity of food that is eaten. There are five key factors that make up a healthful diet:

  1. A diet must be adequate, by providing sufficient amounts of each essential nutrient, as well as fiber and adequate calories.
  2. A balanced diet results when you do not consume one nutrient at the expense of another, but rather get appropriate amounts of all nutrients.
  3. Calorie control is necessary so that the amount of energy you get from the nutrients you consume equals the amount of energy you expend during your day’s activities.
  4. Moderation means not eating to the extremes, neither too much nor too little.
  5. Variety refers to consuming different foods from within each of the food groups on a regular basis.

A healthy diet is one that favors whole foods. As an alternative to modern processed foods, a healthy diet focuses on “real” fresh whole foods that have been sustaining people for generations. Whole foods supply the needed vitamins, minerals, protein, carbohydrates, fats, and fiber that are essential to good health. Commercially prepared and fast foods are often lacking nutrients and often contain inordinate amounts of sugar, salt, saturated and trans fats, all of which are associated with the development of diseases such as atherosclerosis, heart disease, stroke, cancer, obesity, diabetes, and other illnesses. A balanced diet is a mix of food from the different food groups (vegetables, legumes, fruits, grains, protein foods, and dairy).

Adequacy

An adequate diet is one that favors nutrient-dense foods. Nutrient-dense foods are defined as foods that contain many essential nutrients per calorie. Nutrient-dense foods are the opposite of “empty-calorie” foods, such as sugary carbonated beverages, which are also called “nutrient-poor.” Nutrient-dense foods include fruits and vegetables, lean meats, poultry, fish, low-fat dairy products, and whole grains. Choosing more nutrient-dense foods will facilitate weight loss, while simultaneously providing all necessary nutrients.

Balance

Balance the foods in your diet. Achieving balance in your diet entails not consuming one nutrient at the expense of another. For example, calcium is essential for healthy teeth and bones, but too much calcium will interfere with iron absorption. Most foods that are good sources of iron are poor sources of calcium, so in order to get the necessary amounts of calcium and iron from your diet, a proper balance between food choices is critical. Another example is that while sodium is an essential nutrient, excessive intake may contribute to congestive heart failure and chronic kidney disease in some people. Remember, everything must be consumed in the proper amounts.

Moderation

Eat in moderation. Moderation is crucial for optimal health and survival. Eating nutrient-poor foods each night for dinner will lead to health complications. But as part of an otherwise healthful diet and consumed only on a weekly basis, this should not significantly impact overall health. It’s important to remember that eating is, in part, about enjoyment and indulging with a spirit of moderation. This fits within a healthy diet.

Monitor food portions. For optimum weight maintenance, it is important to ensure that energy consumed from foods meets the energy expenditures required for body functions and activity. If not, the excess energy contributes to gradual, steady accumulation of stored body fat and weight gain. In order to lose body fat, you need to ensure that more calories are burned than consumed. Likewise, in order to gain weight, calories must be eaten in excess of what is expended daily.

Variety

Variety involves eating different foods from all the food groups. Eating a varied diet helps to ensure that you consume and absorb adequate amounts of all essential nutrients required for health. One of the major drawbacks of a monotonous diet is the risk of consuming too much of some nutrients and not enough of others. Trying new foods can also be a source of pleasure—you never know what foods you might like until you try them.

Developing a healthful diet can be rewarding, but be mindful that all of the principles presented must be followed to derive maximal health benefits. For instance, introducing variety in your diet can still result in the consumption of too many high-calorie, nutrient poor foods and inadequate nutrient intake if you do not also employ moderation and calorie control. Using all of these principles together will promote lasting health benefits.

Research and the Scientific Method

Photo by Jonathon Simcoe on unsplash.com / CC0

Nutritional scientists discover the health effects of food and its nutrients by first making an observation. Once observations are made, they come up with a hypothesis, test their hypothesis, and then interpret the results. After this, they gather additional evidence from multiple sources and finally come up with a conclusion. This organized process of inquiry used in science is called the scientific method.

Figure 1.2 Scientific Method Steps

In 1811, French chemist Bernard Courtois was isolating saltpeter for producing gunpowder to be used by Napoleon’s army. To carry out this isolation, he burned some seaweed and in the process, observed an intense violet vapor that crystallized when he exposed it to a cold surface. He sent the violet crystals to an expert on gases, Joseph Gay-Lussac, who identified the crystal as a new element. It was named iodine, the Greek word for violet. The following scientific record is some of what took place in order to conclude that iodine is a nutrient.


Observation. Eating seaweed is a cure for goiter, a gross enlargement of the thyroid gland in the neck.

Hypothesis. In 1813, Swiss physician Jean-Francois Coindet hypothesized that the seaweed contained iodine, and that iodine could be used instead of seaweed to treat his patientsZimmerman, M.B. Research on Iodine Deficiency and Goiter in the 19th and Early 20th Centuries. Journal of Nutrition. 2008; 138(11), 2060–63. http://jn.nutrition.org/content/138/11/2060.full  Accessed September 17, 2017.

Experimental test. Coindet administered iodine tincture orally to his patients with goiter.

Interpret results. Coindet’s iodine treatment was successful.


Hypothesis. French chemist Chatin proposed that the low iodine content in food and water in certain areas far away from the ocean was the primary cause of goiter, and renounced the theory that goiter was the result of poor hygiene.

Experimental test. In the late 1860s the program, “The stamping-out of goiter,” started with people in several villages in France being given iodine tablets.

Results. The program was effective and 80 percent of goitrous children were cured.


Hypothesis. In 1918, Swiss doctor Bayard proposed iodizing salt as a good way to treat areas endemic with goiter.

Experimental test. Iodized salt was transported by mules to a small village at the base of the Matterhorn where more than 75 percent of school children were goitrous. It was given to families to use for six months.

Results. The iodized salt was beneficial in treating goiter in this remote population.


Experimental test. Physician David Marine conducted the first experiment of treating goiter with iodized salt in America in Akron, Ohio.Carpenter, K.J. David Marine and the Problem of Goiter. Journal of Nutrition. 2005; 135(4), 675–80. http://jn.nutrition.org/content/135/4/675.full?sid=d06fdd35-566f -42a2-a3fd- efbe0736b7ba Accessed September 17, 2017.

Results. This study was conducted on over four-thousand school children, and found that iodized salt prevented goiter.

Conclusions. Seven other studies similar to Marine’s were conducted in Italy and Switzerland, which also demonstrated the effectiveness of iodized salt in treating goiter. In 1924, US public health officials initiated the program of iodizing salt and started eliminating the scourge of goiter. Today, more than 70% of American households use iodized salt and many other countries have followed the same public health strategy to reduce the health consequences of iodine deficiency.

Career Conenction

What are some of the ways in which you think like a scientist, and use the scientific method in your everyday life? Any decision-making process uses some aspect of the scientific method. Think about some of the major decisions you have made in your life and the research you conducted that supported your decision. For example, what brand of computer do you own? Where is your money invested? What college do you attend?

Evidence-Based Approach to Nutrition

It took more than one hundred years from iodine’s discovery as an effective treatment for goiter until public health programs recognized it as such. Although a lengthy process, the scientific method is a productive way to define essential nutrients and determine their ability to promote health and prevent disease. The scientific method is part of the overall evidence-based approach to designing nutritional guidelinesMyers E. Systems for Evaluating Nutrition Research for Nutrition Care Guidelines: Do They Apply to Population Dietary Guidelines? J Am Diet Assoc. 2003; 12(2), 34–41. http://jandonline.org/article/S0002-8223(03)01378-6/abstract. Accessed September 17, 2017.. An evidence-based approach to nutrition includesBriss PA, Zara S, et al. Developing an Evidence-Based Guide to Community Preventive Services—Methods. Am J Prev Med. 2000; 18(1S), 35–43. https://www.ncbi.nlm.nih.gov/pubmed/10806978. Accessed September 17, 2017.:

The Food and Nutrition Board of the Institute of Medicine, a nonprofit, non-governmental organization, constructs its nutrient recommendations (i.e., Dietary Reference Intakes, or DRI) using an evidence-based approach to nutrition. The entire procedure for setting the DRI is documented and made available to the public. The same approach is used by the USDA and HHS, which are departments of the US federal government. The USDA and HHS websites are great tools for discovering ways to optimize health; however, it is important to gather nutrition information from multiple resources, as there are often differences in opinion among various scientists and public health organizations. Full text versions of the DRI publications are available in pdf format at https://www.nap.edu/, along with many other free publications.

Types of Scientific Studies

There are various types of scientific studies on humans that can be used to provide supporting evidence for a particular hypothesis. These include epidemiological studies, interventional clinical trials, and randomized clinical trials. Valuable nutrition knowledge also is obtained from animal studies and cellular and molecular biology research.

Table 1.4 Types of Scientific Studies

Type Description Example Notes
Epidemiological Observational study of populations around the world and the impact of nutrition on health. Diets with a high consumption of saturated fat are associated with an increased risk of heart attacks. Does not determine cause-and-effect relationships.
Intervention Clinical Trials Scientific investigations where a variable is changed between groups. Testing the effect of different diets on blood pressure. One group consumes an American diet, group 2 eats a diet rich in fruits and vegetables, and group 3 eats a combination of groups 1 and 2. If done correctly, it does determine cause-and-effect relationships.
Randomized Clinical Trials Participants are assigned by chance to separate groups that compare different treatments. Neither the researchers nor the participants can choose which group a participant is assigned. Testing the effect of calcium supplements on women with osteoporosis. Participants are given a pill daily of a placebo or calcium supplement. Neither the participant nor the researcher know what group the participant is in. Considered the “gold” standard for scientific studies.
Animal and Cellular Biology Studies are conducted on animals or on cells. Testing the effects of a new blood pressure drug on guinea pigs or on the lipid membrane of a cell. Less expensive than human trials. Study is not on whole humans so it may be not applicable.

Nutrition Assessment

Nutritional assessment is the interpretation of anthropometric, biochemical (laboratory), clinical and dietary data to determine whether a person or groups of people are well nourished or malnourished (overnourished or undernourished).

Nutritional assessment can be done using the ABCD methods. These refer to the following:

Anthropometry methods of assessing nutritional status

The word anthropometry comes from two words: Anthropo means ‘human’ and metry means ‘measurement’. The different measurements taken to assess growth and body composition are presented below.

To assess growth, several different measurements including length, height, weight, head circumference, mid-arm circumference, skin-fold thickness, head/chest ratio, and hip/waist ratio can be used. Height and weight measurements are essential in children to evaluate physical growth. As an additional resource, the NHANES Anthropometry Procedures Manual (revised January 2004) can be viewed here https://www.cdc.gov/nchs/data/nhanes/nhanes_03_04/BM.pdf

Figure 1.3 Measuring Height

(Source: UNICEF, 1986, How to weigh and measure children: assessing the nutrition status of young children)

Biochemical methods of assessing nutritional status

Biochemical or laboratory methods of assessment include measuring a nutrient or its metabolite in the blood, feces, urine or other tissues that have a relationship with the nutrient. An example of this method would be to take blood samples to measure levels of glucose in the body. This method is useful for determining if an individual has diabetes.

Figure 1.4 Measuring Blood Glucose Levels

A woman testing her blood sugar levels

Image by TesaPhotography / CC0

Clinical methods of assessing nutritional status

In addition to the anthropometric assessments, you can also assess clinical signs and symptoms that might indicate potential specific nutrient deficiency. Special attention are given to organs such as skin, eyes, tongue, ears, mouth, hair, nails, and gums. Clinical methods of assessing nutritional status involve checking signs of deficiency at specific places on the body or asking the patient whether they have any symptoms that might suggest nutrient deficiency.

Dietary methods of assessing nutritional status

Dietary methods of assessment include looking at past or current intakes of nutrients from food by individuals or a group to determine their nutritional status. There are several methods used to do this:

24 hour recall

A trained professional asks the subject to recall all food and drink consumed in the previous 24 hours. This is a quick and easy method. However, it is dependent upon the subject’s short-term memory and may not be very accurate.

Food frequency questionnaire

The subject is given a list of foods and asked to indicate intake per day, per week, and per month. This method is inexpensive and easy to administer. It is more accurate than the 24 hour recall.

Food Diary

Food intake is recorded by the subject at the time of eating. This method is reliable but difficult to maintain. Also known as a food journal or food record.

Observed food consumption

This method requires food to be weighed and exactly calculated. It is very accurate but rarely used because it is time-consuming and expensive.

Evolving Science

Science is always moving forward, albeit sometimes slowly. One study is not enough to make a guideline or a recommendation, or cure a disease. Science is a stepwise process that builds on past evidence and finally culminates into a well-accepted conclusion. Unfortunately, not all scientific conclusions are developed in the interest of human health, and some can be biased. Therefore, it is important to know where a scientific study was conducted and who provided the funding, as this can have an impact on the scientific conclusions being made. For example, an air quality study paid for by a tobacco company diminishes its value in the minds of readers as well as a red meat study performed at a laboratory funded by a national beef association.

Nutritional Science Evolution

One of the newest areas in the realm of nutritional science is the scientific discipline of nutritional genetics, also called nutrigenomics. Genes are part of DNA and contain the genetic information that make up all of our traits. Genes are codes for proteins and when they are turned “on” or “off,” they change how the body works. While we know that health is defined as more than just the absence of disease, there are currently very few accurate genetic markers of good health. Rather, there are many more genetic markers for disease. However, science is evolving, and nutritional genetics aims to identify what nutrients to eat to “turn on” healthy genes and “turn off” genes that cause disease.

Using Science and Technology to Change the Future

As science evolves, so does technology. Both can be used to create a healthy diet, optimize health, and prevent disease. Picture yourself not too far into the future: you are wearing a small “dietary watch” that painlessly samples your blood, and downloads the information to your cell phone, which has an app that evaluates the nutrient profile of your blood and then recommends a snack or dinner menu to assure you maintain adequate nutrient levels. What else is not far off? How about another app that provides a shopping list that adheres to all dietary guidelines and is emailed to the central server at your local grocer, who then delivers the food to your home? The food is then stored in your smart fridge which documents your daily diet at home and delivers your weekly dietary assessment to your home computer. At your computer, you can compare your diet with other diets aimed at weight loss, optimal strength training, reduction in risk for specific diseases or any other health goals you may have. You also may delve into the field of nutritional genetics and download your gene expression profiles to a database that analyzes your genes against millions of others.

Nutrition and the Media

A motivational speaker once said, “A smart person believes half of what they read. An intelligent person knows which half to believe.” In this age of information, where instant Internet access is just a click away, it is easy to be misled if you do not know where to go for reliable nutrition information.

Using Eyes of Discernment

“New study shows that margarine contributes to arterial plaque.”

“Asian study reveals that two cups of coffee per day can have detrimental effects on the nervous system.”

How do you react when you read news of this nature? Do you boycott margarine and coffee? When reading nutrition-related claims, articles, websites, or advertisements, always remember that one study does not substantiate a fact. One study neither proves nor disproves anything. Readers who may be looking for complex answers to nutritional dilemmas can quickly misconstrue such statements and be led down a path of misinformation. Listed below are ways that you can develop discerning eyes when reading nutritional news.

  1. The scientific study under discussion should be published in a peer reviewed journal, such as the Journal of Nutrition. Question studies that come from less trustworthy sources (such as non peer-reviewed journals or websites) or that are not formally published.
  2. The report should disclose the methods used by the researcher(s). Did the study last for three or thirty weeks? Were there ten or one hundred participants? What did the participants actually do? Did the researcher(s) observe the results themselves or did they rely on self reports from program participants?
  3. Who were the subjects of this study? Humans or animals? If human, are any traits/characteristics noted? You may realize you have more in common with certain program participants and can use that as a basis to gauge if the study applies to you.
  4. Credible reports often disseminate new findings in the context of previous research. A single study on its own gives you very limited information, but if a body of literature supports a finding, it adds to credibility.
  5. Peer-reviewed articles deliver a broad perspective and are inclusive of findings of many studies on the exact same subject.
  6. When reading such news, ask yourself, “Is this making sense?” Even if coffee does adversely affect the nervous system, do you drink enough of it to see any negative effects? Remember, if a headline professes a new remedy for a nutrition-related topic, it may well be a research-supported piece of news, but more often than not, it is a sensational story designed to catch the attention of an unsuspecting consumer. Track down the original journal article to see if it really supports the conclusions being drawn in the news report.

When reading information on websites, remember the following criteria for discerning if the site is valid:

  1. Who sponsors the website?
  2. Are names and credentials disclosed?
  3. Is an editorial board identified?
  4. Does the site contain links to other credible informational websites?
  5. Even better, does it reference peer-reviewed journal articles? If so, do those journal articles actually back up the claims being made on the website?
  6. How often is the website updated?
  7. Are you being sold something at this website?
  8. Does the website charge a fee?

For more information, visit http://www.csuchico.edu/lins/handouts/eval_websites.pdf

Trustworthy Sources

Now let’s consider some reputable organizations and websites from which you can usually obtain valid nutrition information.

Organizations Active in Nutrition Policy and Research

Authoritative nutritional news will be based upon solid scientific evidence, supported by multiple studies, and published in peer-reviewed journals. Whatever the source of your nutritional news, remember to apply the criteria outlined above to help ensure the validity of the information presented. Below are some examples of websites which can be considered credible sources for nutritional news.

II

Chapter 2. The Human Body

Introduction

I ola no ke kino i ka māʻona o ka ʻōpū

The body enjoys health when the stomach is full


Woman eating soup at a table

Image by Henrique Felix on unsplash.com / CC0


Learning Objectives

By the end of this chapter, you will be able to:

  • Explain the anatomy and physiology of the digestive system and other supporting organ systems
  • Describe the relationships between each of the organ systems

The Native Hawaiians believed there was a strong connection between health and food. Around the world, other cultures had similar views of food and its relationship with health. A famous quote by the Greek physician Hippocrates over two thousand years ago, “Let food be thy medicine and medicine be thy food” bear much relevance on our food choices and their connection to our health. Today, the scientific community echoes Hippocrates’ statement as it recognizes some foods as functional foods. The Academy of Nutrition and Dietetics defines functional foods as “whole foods and fortified, enriched, or enhanced foods that have a potentially beneficial effect on health when consumed as part of a varied diet on a regular basis, at effective levels.”

In the latter nineteenth century, a Russian doctor of immunology, Elie Metchnikoff, was intrigued by the healthy life spans of people who lived in the tribes of the northern Caucasus Mountains. What contributed to their long lifespan and their resistance to life-threatening diseases? A possible factor lay wrapped up in a leather satchel used to hold fermented milk. Observing the connection between the beverage and longevity, Dr. Elie Metchnikoff began his research on beneficial bacteria and the longevity of life that led to his book, The Prolongation of Life. He studied the biological effects and chemical properties of the kefir elixir whose name came from the Turkish word “kef” or “pleasure.” To this day, kefir is one of the most widely enjoyed beverages in Russia.

Kefir has since found its way into America, where it is marketed in several flavors and can be found at your local grocery store. It is one product of the billion-dollar functional food industry marketed with all sorts of health claims from improving digestion to preventing cancer. What is the scientific evidence that kefir is a functional food? Expert nutritionists agree that probiotics, such as kefir, reduce the symptoms of lactose intolerance and can ward off virally caused diarrhea. While some health claims remain unsubstantiated, scientific studies are ongoing to determine the validity of other health benefits of probiotics.

The Native Hawaiians also consumed a daily probiotic in their diet commonly known as poi (pounded taro). In precolonial Hawai‘i, poi was used for a wide variety of dietary and medicinal purposes. Aside from poi’s nutrient dense composition, fermented poi has numerous compounds created in the fermentation process that are very beneficial to the health of the human body. As a probiotic, evidence suggests that poi can be useful in helping diseases such as diarrhea, gastroenteritis, irritable bowel syndrome, inflammatory bowel disease, and cancer.Brown A, Valiere A. The Medicinal Uses of Poi. Nutrition in Clinical Care. 2004; 7(2), 69-74. https://www.ncbi.nlm.nih.gov/pmc/articles/PMC1482315/. Accessed September 20, 2017.

Another well-known probiotic to the local people of Hawai‘i is Kimchi. Kimchi is a traditional Korean food that is manufactured by fermenting vegetables (usually cabbage). Similar to the kefir and poi, kimchi also has shown to have similar health benefits as a probiotic food.Park K, Jeong J, et al. Health Benefits of Kimchi. Journal of Medicinal Food. 2014; 17(1), 6-20. https://www.ncbi.nlm.nih.gov/pubmed/24456350. Accessed September 20, 2017.

The Japanese also have traditional fermented foods such as natto. Natto is made from fermented soybeans and has many health benefits as a probiotic. Along with the beneficial components, natto is very nutrient-dense containing carbohydrates, fats, protein, fiber, vitamins and minerals.Sanjukta S, Rai AK. Production of bioactive peptides during soy fermentation and their potential health benefits. Trends in Food Science and Technology. 2016; 50, 1-10. http://www.sciencedirect.com/science/article/pii/S0924224415300571. Accessed September 20, 2017. Other common foods we ferment in our diet include miso, sauerkraut, kombucha, and tempeh.

Figure 2.1 Components of Organ Systems in the Human Body

Knowing how to maintain the balance of friendly bacteria in your intestines through proper diet can promote overall health. Recent scientific studies have shown that probiotic supplements positively affect intestinal microbial flora, which in turn positively affect immune system function. As good nutrition is known to influence immunity, there is great interest in using probiotic foods and other immune-system-friendly foods as a way to prevent illness. In this chapter we will explore not only immune system function, but also all other organ systems in the human body. We will learn the process of nutrient digestion and absorption, which further reiterates the importance of developing a healthy diet to maintain a healthier you. The evidence abounds that food can indeed be “thy medicine.”

Basic Biology, Anatomy, and Physiology

The Basic Structural and Functional Unit of Life: The Cell

What distinguishes a living organism from an inanimate object? A living organism conducts self-sustaining biological processes. A cell is the smallest and most basic form of life.

The cell theory incorporates three principles:

Cells are the most basic building units of life. All living things are composed of cells. New cells are made from preexisting cells, which divide in two. Who you are has been determined because of two cells that came together inside your mother’s womb. The two cells containing all of your genetic information (DNA) united to begin making new life. Cells divided and differentiated into other cells with specific roles that led to the formation of the body’s numerous body organs, systems, blood, blood vessels, bone, tissue, and skin. As an adult, you are made up of trillions of cells. Each of your individual cells is a compact and efficient form of life—self-sufficient, yet interdependent upon the other cells within your body to supply its needs.

Independent single-celled organisms must conduct all the basic processes of life. The single-celled organism must take in nutrients (energy capture), excrete wastes, detect and respond to its environment, move, breathe, grow, and reproduce. Even a one-celled organism must be organized to perform these essential processes. All cells are organized from the atomic level to all its larger forms. Oxygen and hydrogen atoms combine to make the molecule water (H2O). Molecules bond together to make bigger macromolecules. The carbon atom is often referred to as the backbone of life because it can readily bond with four other elements to form long chains and more complex macromolecules. Four macromolecules—carbohydrates, lipids, proteins, and nucleic acids—make up all of the structural and functional units of cells.

Although we defined the cell as the “most basic” unit of life, it is structurally and functionally complex (Figure 2.2 “The Cell Structure”). A cell can be thought of as a mini-organism consisting of tiny organs called organelles. The organelles are structural and functional units constructed from several macromolecules bonded together. A typical animal cell contains the following organelles: the nucleus (which houses the genetic material DNA), mitochondria (which generate energy), ribosomes (which produce protein), the endoplasmic reticulum (which is a packaging and transport facility), and the golgi apparatus (which distributes macromolecules). In addition, animal cells contain little digestive pouches, called lysosomes and peroxisomes, which break down macromolecules and destroy foreign invaders. All of the organelles are anchored in the cell’s cytoplasm via a cytoskeleton. The cell’s organelles are isolated from the surrounding environment by a plasma membrane.

Figure 2.2 The Cell Structure

The cell is structurally and functionally complex.

Tissues, Organs, Organ Systems, and Organisms

Unicellular (single-celled) organisms can function independently, but the cells of multicellular organisms are dependent upon each other and are organized into five different levels in order to coordinate their specific functions and carry out all of life’s biological processes (see Figure 2.3 “Organization of Life”.

Figure 2.3 Organization of Life

Table 2.1 The Eleven Organ Systems in the Human Body and Their Major Functions

Organ System Organ Components Major Function
Cardiovascular heart, blood/lymph vessels, blood, lymph Transport nutrients and waste products
Digestive mouth, esophagus, stomach, intestines Digestion and absorption
Endocrine all glands (thyroid, ovaries, pancreas) Produce and release hormones
Immune white blood cells, lymphatic tissue, marrow Defend against foreign invaders
Integumentary skin, nails, hair, sweat glands Protective, body temperature regulation
Muscular skeletal, smooth, and cardiac muscle Body movement
Nervous brain, spinal cord, nerves Interprets and responds to stimuli
Reproductive gonads, genitals Reproduction and sexual characteristics
Respiratory lungs, nose, mouth, throat, trachea Gas exchange
Skeletal bones, tendons, ligaments, joints Structure and support
Urinary kidneys, bladder, ureters Waste excretion, water balance

The Digestive System

The process of digestion begins even before you put food into your mouth. When you feel hungry, your body sends a message to your brain that it is time to eat. Sights and smells influence your body’s preparedness for food. Smelling food sends a message to your brain. Your brain then tells the mouth to get ready, and you start to salivate in preparation for a meal.

Once you have eaten, your digestive system (Figure 2.4 “The Human Digestive System”) starts the process that breaks down the components of food into smaller components that can be absorbed and taken into the body. To do this, the digestive system functions on two levels, mechanically to move and mix ingested food and chemically to break down large molecules. The smaller nutrient molecules can then be absorbed and processed by cells throughout the body for energy or used as building blocks for new cells. The digestive system is one of the eleven organ systems of the human body, and it is composed of several hollow tube-shaped organs including the mouth, pharynx, esophagus, stomach, small intestine, large intestine (colon), rectum, and anus. It is lined with mucosal tissue that secretes digestive juices (which aid in the breakdown of food) and mucus (which facilitates the propulsion of food through the tract). Smooth muscle tissue surrounds the digestive tract and its contraction produces waves, known as peristalsis, that propel food down the tract. Nutrients, as well as some non-nutrients, are absorbed. Substances such as fiber get left behind and are appropriately excreted.

Figure 2.4 Digestion Breakdown of Macronutrients

Digestion converts components of the food we eat into smaller molecules that can be absorbed into the body and utilized for energy needs or as building blocks for making larger molecules in cells.

Everyday Connection

Image by Gabriel Lee / CC BY-NC-SA


There has been significant talk about pre- and probiotic foods in the mainstream media. The World Health Organization defines probiotics as live bacteria that confer beneficial health effects on their host. They are sometimes called “friendly bacteria.” The most common bacteria labeled as probiotic is lactic acid bacteria (lactobacilli). They are added as live cultures to certain fermented foods such as yogurt. Prebiotics are indigestible foods, primarily soluble fibers, that stimulate the growth of certain strains of bacteria in the large intestine and provide health benefits to the host. A review article in the June 2008 issue of the Journal of Nutrition concludes that there is scientific consensus that probiotics ward off viral-induced diarrhea and reduce the symptoms of lactose intolerance.Farnworth ER. The Evidence to Support Health Claims for Probiotics. J Nutr. 2008; 138(6), 1250S–4S. http://jn.nutrition.org/content/138/6/1250S.long. Accessed September 22, 2017.

Expert nutritionists agree that more health benefits of pre- and probiotics will likely reach scientific consensus. As the fields of pre- and probiotic manufacturing and their clinical study progress, more information on proper dosing and what exact strains of bacteria are potentially “friendly” will become available.

You may be interested in trying some of these foods in your diet. A simple food to try is kefir. Several websites provide good recipes, including http://www.kefir.net/recipes.htm.
Kefir, a dairy product fermented with probiotic bacteria, can make a pleasant tasting milkshake.


Figure 2.5 The Human Digestive System

Original figure by LadyofHats (Public Domain) with labels added by Allison Calabrese / CC BY 4.0

From the Mouth to the Stomach

There are four steps in the digestion process (Figure 2.5 “The Human Digestive System”). The first step is ingestion, which is the intake of food into the digestive tract. It may seem a simple process, but ingestion involves smelling food, thinking about food, and the involuntary release of saliva in the mouth to prepare for food entry. In the mouth, where the second step of digestion starts, the mechanical and chemical breakdown of food begins. The chemical breakdown of food involves enzymes, such as salivary amylase that starts the breakdown of large starch molecules into smaller components.

Mechanical breakdown starts with mastication (chewing) in the mouth. Teeth crush and grind large food particles, while saliva provides lubrication and enables food movement downward. The slippery mass of partially broken-down food is called a bolus, which moves down the digestive tract as you swallow. Swallowing may seem voluntary at first because it requires conscious effort to push the food with the tongue back toward the throat, but after this, swallowing proceeds involuntarily, meaning it cannot be stopped once it begins. As you swallow, the bolus is pushed from the mouth through the pharynx and into a muscular tube called the esophagus. As the bolus travels through the pharynx, a small flap called the epiglottis closes to prevent choking by keeping food from going into the trachea. Peristaltic contractions also known as peristalsis in the esophagus propel the food bolus down to the stomach (Figure 3.6 “Peristalsis in the Esophagus”). At the junction between the esophagus and stomach there is a sphincter muscle that remains closed until the food bolus approaches. The pressure of the food bolus stimulates the lower esophageal sphincter to relax and open and food then moves from the esophagus into the stomach. The mechanical breakdown of food is accentuated by the muscular contractions of the stomach and small intestine that mash, mix, slosh, and propel food down the alimentary canal. Solid food takes between four and eight seconds to travel down the esophagus, and liquids take about one second.

Figure 2.6 Peristalsis in the Esophagus

From the Stomach to the Small Intestine

When food enters the stomach, a highly muscular organ, powerful peristaltic contractions help mash, pulverize, and churn food into chyme. Chyme is a semiliquid mass of partially digested food that also contains gastric juices secreted by cells in the stomach. These gastric juices contain hydrochloric acid and the enzyme pepsin, that chemically start breakdown of the protein components of food.

The length of time food spends in the stomach varies by the macronutrient composition of the meal. A high-fat or high-protein meal takes longer to break down than one rich in carbohydrates. It usually takes a few hours after a meal to empty the stomach contents completely into the small intestine.

The small intestine is divided into three structural parts: the duodenum, the jejunum, and the ileum. Once the chyme enters the duodenum (the first segment of the small intestine), the pancreas and gallbladder are stimulated and release juices that aid in digestion. The pancreas secretes up to 1.5 liters (.4 US gallons) of pancreatic juice through a duct into the duodenum per day. This fluid consists mostly of water, but it also contains bicarbonate ions that neutralize the acidity of the stomach-derived chyme and enzymes that further break down proteins, carbohydrates, and lipids. The gallbladder secretes a much smaller amount of a fluid called bile that helps to digest fats. Bile passes through a duct that joins the pancreatic ducts and is released into the duodenum. Bile is made in the liver and stored in the gall bladder. Bile’s components act like detergents by surrounding fats similar to the way dish soap removes grease from a frying pan. This allows for the movement of fats in the watery environment of the small intestine. Two different types of muscular contractions, called peristalsis and segmentation, control the movement and mixing of the food in various stages of digestion through the small intestine.

Similar to what occurs in the esophagus and stomach, peristalsis is circular waves of smooth muscle contraction that propel food forward. Segmentation from circular muscle contraction slows movement in the small intestine by forming temporary “sausage link” type of segments that allows chyme to slosh food back and forth in both directions to promote mixing of the chyme and enhance absorption of nutrients (Figure 2.7 “Segmentation”). Almost all the components of food are completely broken down to their simplest units within the first 25 centimeters of the small intestine. Instead of proteins, carbohydrates, and lipids, the chyme now consists of amino acids, monosaccharides, and emulsified components of triglycerides.

Figure 2.7 Segmentation

“Segmentation” by OpenStax College / CC BY 3.0

The third step of digestion (nutrient absorption) takes place mainly in the remaining length of the small intestine, or ileum (> 5 meters). The way the small intestine is structured gives it a huge surface area to maximize nutrient absorption. The surface area is increased by folds, villi, and microvilli. Digested nutrients are absorbed into either capillaries or lymphatic vessels contained within each microvillus.

The small intestine is perfectly structured for maximizing nutrient absorption. Its surface area is greater than 200 square meters, which is about the size of a tennis court. The large surface area is due to the multiple levels of folding. The internal tissue of the small intestine is covered in villi, which are tiny finger-like projections that are covered with even smaller projections, called microvilli (Figure 2.8 “Structure of the Small Intestine”). The digested nutrients pass through the absorptive cells of the intestine via diffusion or special transport proteins. Amino acids, short fatty acids, and monosaccharides (sugars) are transported from the intestinal cells into capillaries, but the larger fatty acids, fat-soluble vitamins, and other lipids are transported first through lymphatic vessels, which soon meet up with blood vessels.

Figure 2.8 Structure of the Small Intestine

“Histology Small Intestines” by

From the Small Intestine to the Large Intestine

The process of digestion is fairly efficient. Any food that is still incompletely broken down (usually less than ten percent of food consumed) and the food’s indigestible fiber content move from the small intestine to the large intestine (colon) through a connecting valve. A main task of the large intestine is to absorb much of the remaining water. Remember, water is present not only in solid foods and beverages, but also the stomach releases a few hundred milliliters of gastric juice, and the pancreas adds approximately 500 milliliters during the digestion of the meal. For the body to conserve water, it is important that excessive water is not lost in fecal matter. In the large intestine, no further chemical or mechanical breakdown of food takes place unless it is accomplished by the bacteria that inhabit this portion of the intestinal tract. The number of bacteria residing in the large intestine is estimated to be greater than 1014, which is more than the total number of cells in the human body (1013). This may seem rather unpleasant, but the great majority of bacteria in the large intestine are harmless and many are even beneficial.

From the Large Intestine to the Anus

After a few hours in the stomach, plus three to six hours in the small intestine, and about sixteen hours in the large intestine, the digestion process enters step four, which is the elimination of indigestible food matter as feces. Feces contain indigestible food components and gut bacteria (almost 50 percent of content). It is stored in the rectum until it is expelled through the anus via defecation.

Nutrients Are Essential for Cell and Organ Function

When the digestive system has broken down food to its nutrient components, the body eagerly awaits delivery. Water soluble nutrients absorbed into the blood travel directly to the liver via a major blood vessel called the portal vein. One of the liver’s primary functions is to regulate metabolic homeostasis. Metabolic homeostasis is achieved when the nutrients consumed and absorbed match the energy required to carry out life’s biological processes. Simply put, nutrient energy intake equals energy output. Whereas glucose and amino acids are directly transported from the small intestine to the liver, lipids are transported to the liver by a more circuitous route involving the lymphatic system. The lymphatic system is a one-way system of vessels that transports lymph, a fluid rich in white blood cells, and lipid soluble substances after a meal containing lipids. The lymphatic system slowly moves its contents through the lymphatic vessels and empties into blood vessels in the upper chest area. Now, the absorbed lipid soluble components are in the blood where they can be distributed throughout the body and utilized by cells (see Figure 2.9 “The Absorption of Nutrients”).


Figure 2.9 The Absorption of Nutrients

Maintaining the body’s energy status quo is crucial because when metabolic homeostasis is disturbed by an eating disorder or disease, bodily function suffers. This will be discussed in more depth in the last section of this chapter. The liver is the only organ in the human body that is capable of exporting nutrients for energy production to other tissues. Therefore, when a person is in between meals (fasted state) the liver exports nutrients, and when a person has just eaten (fed state) the liver stores nutrients within itself. Nutrient levels and the hormones that respond to their levels in the blood provide the input so that the liver can distinguish between the fasted and fed states and distribute nutrients appropriately. Although not considered to be an organ, adipose tissue stores fat in the fed state and mobilizes fat components to supply energy to other parts of the body when energy is needed.

All eleven organ systems in the human body require nutrient input to perform their specific biological functions. Overall health and the ability to carry out all of life’s basic processes is fueled by energy-supplying nutrients (carbohydrate, fat, and protein). Without them, organ systems would fail, humans would not reproduce, and the race would disappear. In this section, we will discuss some of the critical nutrients that support specific organ system functions.

The Cardiovascular System

Figure 2.10 The Cardiovascular system

The cardiovascular system is one of the eleven organ systems of the human body. Its main function is to transport nutrients to cells and wastes from cells (Figure 2.12 “Cardiovascular Transportation of Nutrients”). This system consists of the heart, blood, and blood vessels. The heart pumps the blood, and the blood is the transportation fluid. The transportation route to all tissues, a highly intricate blood-vessel network, comprises arteries, veins, and capillaries. Nutrients absorbed in the small intestine travel mainly to the liver through the hepatic portal vein. From the liver, nutrients travel upward through the inferior vena cava blood vessel to the heart. The heart forcefully pumps the nutrient-rich blood first to the lungs to pick up some oxygen and then to all other cells in the body. Arteries become smaller and smaller on their way to cells, so that by the time blood reaches a cell, the artery’s diameter is extremely small and the vessel is now called a capillary. The reduced diameter of the blood vessel substantially slows the speed of blood flow. This dramatic reduction in blood flow gives cells time to harvest the nutrients in blood and exchange metabolic wastes.

Figure 2.11 The Blood Flow in the Cardiovascular System

Blood’s Function in the Body and in Metabolism Support

You know you cannot live without blood, and that your heart pumps your blood over a vast network of veins and arteries within your body, carrying oxygen to your cells. However, beyond these basic facts, what do you know about your blood?

Blood transports absorbed nutrients to cells and waste products from cells. It supports cellular metabolism by transporting synthesized macromolecules from one cell type to another and carrying waste products away from cells. Additionally, it transports molecules, such as hormones, allowing for communication between organs. The volume of blood coursing throughout an adult human body is about 5 liters (1.3 US gallons) and accounts for approximately 8 percent of human body weight.

What Makes Up Blood and How Do These Substances Support Blood Function?

Blood is about 78 percent water and 22 percent solids by volume. The liquid part of blood is called plasma and it is mostly water (95 percent), but also contains proteins, ions, glucose, lipids, vitamins, minerals, waste products, gases, enzymes, and hormones. We have learned that the protein albumin is found in high concentrations in the blood. Albumin helps maintain fluid balance between blood and tissues, as well as helping to maintain a constant blood pH. We have also learned that the water component of blood is essential for its actions as a transport vehicle, and that the electrolytes carried in blood help to maintain fluid balance and a constant pH. Furthermore, the high water content of blood helps maintain body temperature, and the constant flow of blood distributes heat throughout the body. Blood is exceptionally good at temperature control, so much so that the many small blood vessels in your nose are capable of warming frigid air to body temperature before it reaches the lungs.

The cellular components of blood include red blood cells, white blood cells, and platelets. Red blood cells are the most numerous of the components. Each drop of blood contains millions of them. Red blood cells are red because they each contain approximately 270 million hemoglobin proteins, which contain the mineral iron, which turns red when bound to oxygen. The most vital duty of red blood cells is to transport oxygen from the lungs to all cells in the body so that cells can utilize oxygen to produce energy via aerobic metabolism. The white blood cells that circulate in blood are part of the immune system, and they survey the entire body looking for foreign invaders to destroy. They make up about 1 percent of blood volume. Platelets are fragments of cells that are always circulating in the blood in case of an emergency. When blood vessels are injured, platelets rush to the site of injury to plug the wound. Blood is under a constant state of renewal and is synthesized from stem cells residing in bone marrow. Red blood cells live for about 120 days, white blood cells live anywhere from eighteen hours to one year, or even longer, and platelets have a lifespan of about ten days.

Figure 2.12 Cardiovascular Transportation of Nutrients

The cardiovascular system transports nutrients to all cells and carries wastes out.

Nutrients In

Once absorbed from the small intestine, all nutrients require transport to cells in need of their support. Additionally, molecules manufactured in other cells sometimes require delivery to other organ systems. Blood is the conduit and blood vessels are the highway that support nutrient and molecule transport to all cells. Water-soluble molecules, such as some vitamins, minerals, sugars, and many proteins, move independently in blood. Fat-soluble vitamins, triglycerides, cholesterol, and other lipids are packaged into lipoproteins that allow for transport in the watery milieu of blood. Many proteins, drugs, and hormones are dependent on transport carriers, primarily by the plasma protein albumin. In addition to transporting all of these molecules, blood transfers oxygen taken in by the lungs to all cells in the body. As discussed, the iron-containing hemoglobin molecule in red blood cells serves as the oxygen carrier.

Wastes Out

In the metabolism of macronutrients to energy, cells produce the waste products carbon dioxide and water. As blood travels through smaller and smaller vessels, the rate of blood flow is dramatically reduced, allowing for efficient exchange of nutrients and oxygen for cellular waste products through tiny capillaries. The kidneys remove any excess water from the blood, and blood delivers the carbon dioxide to the lungs where it is exhaled. Also, the liver produces the waste product urea from the breakdown of amino acids and detoxifies many harmful substances, all of which require transport in the blood to the kidneys for excretion.

All for One, One for All

The eleven organ systems in the body completely depend on each other for continued survival as a complex organism. Blood allows for transport of nutrients, wastes, water, and heat, and is also a conduit of communication between organ systems. Blood’s importance to the rest of the body is aptly presented in its role in glucose delivery, especially to the brain. The brain metabolizes, on average, 6 grams of glucose per hour. In order to avert confusion, coma, and death, glucose must be readily available to the brain at all times. To accomplish this task, cells in the pancreas sense glucose levels in the blood. If glucose levels are low, the hormone glucagon is released into the blood and is transported to the liver where it communicates the signal to ramp-up glycogen breakdown and glucose synthesis. The liver does just that, and glucose is released into the blood, which transports it to the brain. Concurrently, blood transports oxygen to support the metabolism of glucose to provide energy in the brain. Healthy blood conducts its duties rapidly, avoiding hypoglycemic coma and death. This is just one example of the body’s survival mechanisms exemplifying life’s mantra “All for one, one for all.”

What Makes Blood Healthy?

Maintaining healthy blood, including its continuous renewal, is essential to support its vast array of vital functions. Blood is healthy when it contains the appropriate amount of water and cellular components and proper concentrations of dissolved substances, such as albumin and electrolytes. As with all other tissues, blood needs macro- and micronutrients to optimally function. In the bone marrow, where blood cells are made, amino acids are required to build the massive amount of hemoglobin packed within every red blood cell, along with all other enzymes and cellular organelles contained in each blood cell. Red blood cells, similar to the brain, use only glucose as fuel, and it must be in constant supply to support red-blood-cell metabolism. As with all other cells, the cells in the blood are surrounded by a plasma membrane, which is composed of mainly lipids. Blood health is also acutely sensitive to deficiencies in some vitamins and minerals more than others.

What Can Blood Tests Tell You About Your Health?

Figure 2.13 Blood Tests

Blood tests are helpful tools in diagnosing disease and provide much information on overall health. Image by Thirteen of Clubs / CC BY-SA

Since blood is the conduit of metabolic products and wastes, measuring the components of blood, and particular substances in blood, can reveal not only the health of blood, but also the health of other organ systems. In standard blood tests performed during an annual physical, the typical blood tests conducted can tell your physician about the functioning of a particular organ or about disease risk.

A biomarker is defined as a measurable molecule or trait that is connected with a specific disease or health condition. The concentrations of biomarkers in blood are indicative of disease risk. Some biomarkers are cholesterol, triglycerides, glucose, and prostate-specific antigen. The results of a blood test give the concentrations of substances in a person’s blood and display the normal ranges for a certain population group. Many factors, such as physical activity level, diet, alcohol intake, and medicine intake can influence a person’s blood-test levels and cause them to fall outside the normal range, so results of blood tests outside the “normal” range are not always indicative of health problems. The assessment of multiple blood parameters aids in the diagnosis of disease risk and is indicative of overall health status. See Table 2.2 “Blood Tests” for a partial list of substances measured in a typical blood test. This table notes only a few of the things that their levels tell us about health.

Table 2.2 Blood Tests

Substance Measured Indicates
Red-blood-cell count Oxygen-carrying capacity
Hematocrit (red-blood-cell volume) Anemia risk
White-blood-cell count Presence of infection
Platelet count Bleeding disorders, atherosclerosis risk
pH Metabolic, kidney, respiratory abnormalities
Albumin Liver, kidney, and Crohn’s disease, dehydration, protein deficiency
Bilirubin Liver-function abnormality
Oxygen/Carbon Dioxide Respiratory or metabolic abnormality
Hemoglobin Oxygen-carrying capacity
Iron Anemia risk
Magnesium Magnesium deficiency
Electrolytes (calcium, chloride, magnesium, potassium) Many illnesses (kidney, metabolic, etc.)
Cholesterol Cardiovascular disease risk
Triglycerides Cardiovascular disease risk
Glucose Diabetes risk
Hormones Many illnesses (diabetes, reproductive abnormalities)

National Heart Lung and Blood Institute. Types of Blood Tests.http://www.nhlbi.nih.gov/health/health-topics/topics/bdt/types.html. Published January 6, 2012. Accessed September 22,2017.

Central Nervous System

The human brain (which weighs only about 3 pounds, or 1,300 kilograms) is estimated to contain over one hundred billion neurons. Neurons form the core of the central nervous system, which consists of the brain, spinal cord, and other nerve bundles in the body. The main function of the central nervous system is to sense changes in the external environment and create a reaction to them. For instance, if your finger comes into contact with a thorn on a rose bush, a sensory neuron transmits a signal from your finger up through the spinal cord and into the brain. Another neuron in the brain sends a signal that travels back to the muscles in your hand and stimulates muscles to contract and you jerk your finger away. All of this happens within a tenth of a second. All nerve impulses travel by the movement of charged sodium, potassium, calcium, and chloride atoms. Nerves communicate with each other via chemicals built from amino acids called neurotransmitters. Eating adequate protein from a variety of sources will ensure the body gets all of the different amino acids that are important for central nervous system function.

Figure 2.14 The Central Nervous System

The brain’s main fuel is glucose and only in extreme starvation will it use anything else. For acute mental alertness and clear thinking, glucose must be systematically delivered to the brain. This does not mean that sucking down a can of sugary soda before your next exam is a good thing. Just as too much glucose is bad for other organs, such as the kidneys and pancreas, it also produces negative effects upon the brain. Excessive glucose levels in the blood can cause a loss of cognitive function, and chronically high blood-glucose levels can damage brain cells. The brain’s cognitive functions include language processing, learning, perceiving, and thinking. Recent scientific studies demonstrate that having continuously high blood-glucose levels substantially elevates the risk for developing Alzheimer’s disease, which is the greatest cause of age-related cognitive decline.

The good news is that much research is directed toward determining the best diets and foods that slow cognitive decline and maximize brain health. A study in the June 2010 issue of the Archives of Neurology reports that people over age 65 who adhered to diets that consisted of higher intakes of nuts, fish, poultry, tomatoes, cruciferous vegetables, fruits, salad dressing, and dark green, and leafy vegetables, as well as a lower intake of high-fat dairy products, red meat, organ meat, and butter, had a much reduced risk for Alzheimer’s disease.Gu Y, Nieves JW, et al. Food Combination and Alzheimer Disease Risk: A Protective Diet. Arch Neurol. 2010; 67(6), 699–706. https://www.ncbi.nlm.nih.gov/pubmed/20385883. Accessed September 22, 2017.

Other scientific studies provide supporting evidence that foods rich in omega-3 fatty acids and/or antioxidants provide the brain with protection against Alzheimer’s disease. One potential “brain food” is the blueberry. The protective effects of blueberries upon the brain are linked to their high content of anthocyanins, which are potent antioxidants and reduce inflammation. A small study published in the April 2010 issue of the Journal of Agricultural and Food Chemistry found that elderly people who consumed blueberry juice every day for twelve weeks had improved learning and memorization skills in comparison to other subjects given a placebo drink.Krikorian R, Shidler MD, et al. Blueberry Supplementation Improves Memory in Older Adults. J Agric Food Chem. 2010; 58(7). https://www.ncbi.nlm.nih.gov/pubmed/20047325. Accessed September 22, 2017.

However, it is important to keep in mind that this was a short-term study. Blueberries also are high in manganese, and high intake of manganese over time is known to have neurotoxic effects. Variety in the diet is perhaps the most important concept in applied nutrition. More clinical trials are evaluating the effects of blueberries and other foods that benefit the brain and preserve its function as we age.

The Respiratory System

A typical human cannot survive without breathing for more than 3 minutes, and even if you wanted to hold your breath longer, your autonomic nervous system would take control. This is because cells need to maintain oxidative metabolism for energy production that continuously regenerates adenosine triphosphate (ATP). For oxidative phosphorylation to occur, oxygen is used as a reactant and carbon dioxide is released as a waste product. You may be surprised to learn that although oxygen is a critical need for cells, it is actually the accumulation of carbon dioxide that primarily drives your need to breathe. Carbon dioxide is exhaled and oxygen is inhaled through the respiratory system, which includes muscles to move air into and out of the lungs, passageways through which air moves, and microscopic gas exchange surfaces covered by capillaries. The cardiovascular system transports gases from the lungs to tissues throughout the body and vice versa. A variety of diseases can affect the respiratory system, such as asthma, emphysema, chronic obstructive pulmonary disorder (COPD), and lung cancer. All of these conditions affect the gas exchange process and result in labored breathing and other difficulties.

The major organs of the respiratory system function primarily to provide oxygen to body tissues for cellular respiration, remove the waste product carbon dioxide, and help to maintain acid-base balance. Portions of the respiratory system are also used for non-vital functions, such as sensing odors, producing speech, and for straining, such as during childbirth or coughing.

Figure 2.15 Major Respiratory Structures

The major respiratory structures span the nasal cavity to the diaphragm. Functionally, the respiratory system can be divided into a conducting zone and a respiratory zone. The conducting zone of the respiratory system includes the organs and structures not directly involved in gas exchange (trachea and bronchi). The gas exchange occurs in the respiratory zone.

Conducting Zone

The major functions of the conducting zone are to provide a route for incoming and outgoing air, remove debris and pathogens from the incoming air, and warm and humidify the incoming air. Several structures within the conducting zone perform other functions as well. The epithelium of the nasal passages, for example, is essential to sensing odors, and the bronchial epithelium that lines the lungs can metabolize some airborne carcinogens. The conducting zone includes the nose and its adjacent structures, the pharynx, the larynx, the trachea, and the bronchi.

Respiratory Zone

In contrast to the conducting zone, the respiratory zone includes structures that are directly involved in gas exchange. The respiratory zone begins where the terminal bronchioles join a respiratory bronchiole, the smallest type of bronchiole (Figure 2.16 “Respiratory Zone”), which then leads to an alveolar duct, opening into a cluster of alveoli.

Figure 2.16 Respiratory Zone

Bronchioles lead to alveolar sacs in the respiratory zone, where gas exchange occurs.

Alveoli

An alveolar duct is a tube composed of smooth muscle and connective tissue, which opens into a cluster of alveoli. An alveolus is one of the many small, grape-like sacs that are attached to the alveolar ducts.

An alveolar sac is a cluster of many individual alveoli that are responsible for gas exchange. An alveolus is approximately 200 μm in diameter with elastic walls that allow the alveolus to stretch during air intake, which greatly increases the surface area available for gas exchange. Alveoli are connected to their neighbors by alveolar pores, which help maintain equal air pressure throughout the alveoli and lung.

Figure 2.17 Location of Respiratory System

Figure 2.17 shows the location of the respiratory structures in the body. Figure B is an enlarged view of the airways, alveoli (air sacs), and capillaries (tiny blood vessels). Figure C is a close-up view of gas exchange between the capillaries and alveoli. CO2 is carbon dioxide, and O2 is oxygen.

A major organ of the respiratory system, each lung houses structures of both the conducting and respiratory zones. The main function of the lungs is to perform the exchange of oxygen and carbon dioxide with air from the atmosphere. To this end, the lungs exchange respiratory gases across a very large epithelial surface area—about 70 square meters—that is highly permeable to gases.

Gross Anatomy of the Lungs

The lungs are pyramid-shaped, paired organs that are connected to the trachea by the right and left bronchi; below the lungs is the diaphragm, a flat, dome-shaped muscle located at the base of the lungs and thoracic cavity.

Figure 2.18 Basic Anatomy of the Lungs

Each lung is composed of smaller units called lobes. Fissures separate these lobes from each other. The right lung consists of three lobes: the superior, middle, and inferior lobes. The left lung consists of two lobes: the superior and inferior lobes.

Blood Supply

The major function of the lungs is to perform gas exchange, which requires blood flowing through the lung tissues (the pulmonary circulation). This blood supply contains deoxygenated blood and travels to the lungs where erythrocytes, also known as red blood cells, pick up oxygen to be transported to tissues throughout the body. The pulmonary artery carries deoxygenated blood to the lungs. The pulmonary artery branches multiple times as it follows the bronchi, and each branch becomes progressively smaller in diameter down to the tiny capillaries where the alveoli release carbon dioxide from blood into the lungs to be exhaled and take up oxygen from inhaled air to oxygenate the blood. Once the blood is oxygenated, it drains from the alveoli by way of multiple pulmonary veins that exit the lungs to carry oxygen to the rest of the body.

The Endocrine System

Figure 2.19 The Endocrine System

The functions of the endocrine system are intricately connected to the body’s nutrition. This organ system is responsible for regulating appetite, nutrient absorption, nutrient storage, and nutrient usage, in addition to other functions, such as reproduction. The glands in the endocrine system are the pituitary, thyroid, parathyroid, adrenals, thymus, pineal, pancreas, ovaries, and testes. The glands secrete hormones, which are biological molecules that regulate cellular processes in other target tissues, so they require transportation by the circulatory system. Adequate nutrition is critical for the functioning of all the glands in the endocrine system. A protein deficiency impairs gonadal-hormone release, preventing reproduction. Athletic teenage girls with very little body fat often do not menstruate. Children who are malnourished usually do not produce enough growth hormone and fail to reach normal height for their age group. Probably the most popularized connection between nutrition and the functions of the endocrine system is that unhealthy dietary patterns are linked to obesity and the development of Type 2 diabetes. The Centers for Disease Control and Prevention (CDC) estimates that twenty-six million Americans have Type 2 diabetes as of 2011. This is 8.3 percent of the US population. Counties with the highest incidence of obesity also have the highest incidence of Type 2 diabetes. To see how the rise in obesity in this country is paralleled by the rise in Type 2 diabetes, review this report by the CDC.
https://www.cdc.gov/diabetes/statistics/slides/maps_diabetesobesity_trends.pdf 

What is the causal relationship between overnutrition and Type 2 diabetes? The prevailing theory is that the overconsumption of high-fat and high-sugar foods causes changes in muscle, fat, and liver cells that leads to a diminished response from the pancreatic hormone insulin. These cells are called “insulin-resistant.” Insulin is released after a meal and instructs the liver and other tissues to take up glucose and fatty acids that are circulating in the blood. When cells are resistant to insulin they do not take up enough glucose and fatty acids, so glucose and fatty acids remain at high concentrations in the blood. The chronic elevation of glucose and fatty acids in the blood also causes damage to other tissues over time, so that people who have Type 2 diabetes are at increased risk for cardiovascular disease, kidney disease, nerve damage, and eye disease.

Career Connection

Do your part to slow the rising tide of obesity and Type 2 diabetes in this country. On the individual level, improve your own family’s diet; at the local community level, support the development of more nutritious school lunch programs; and at the national level, support your nation’s nutrition goals. Visit the CDC Diabetes Public Health Resource website at https://www.cdc.gov/diabetes/. It provides information on education resources, projects, and programs, and spotlights news on diabetes. For helpful information on obesity, visit https://www.cdc.gov/obesity/. The CDC also has workplace web-based resources with the mission of designing work sites that prevent obesity. See https://www.cdc.gov/workplacehealthpromotion/index.html or more details.

The Urinary System

The urinary system has roles you may be well aware of: cleansing the blood and ridding the body of wastes probably come to mind. However, there are additional, equally important functions played by the system. Take for example, regulation of pH, a function shared with the lungs and the buffers in the blood. Additionally, the regulation of blood pressure is a role shared with the heart and blood vessels. What about regulating the concentration of solutes in the blood? Did you know that the kidney is important in determining the concentration of red blood cells? Eighty-five percent of the erythropoietin (EPO) produced to stimulate red blood cell production is produced in the kidneys. The kidneys also perform the final synthesis step of vitamin D production, converting calcidiol to calcitriol, the active form of vitamin D.

If the kidneys fail, these functions are compromised or lost altogether, with devastating effects on homeostasis. The affected individual might experience weakness, lethargy, shortness of breath, anemia, widespread edema (swelling), metabolic acidosis, rising potassium levels, heart arrhythmias, and more. Each of these functions is vital to your well-being and survival. The urinary system, controlled by the nervous system, also stores urine until a convenient time for disposal and then provides the anatomical structures to transport this waste liquid to the outside of the body. Failure of nervous control or the anatomical structures leading to a loss of control of urination results in a condition called incontinence.

Characteristics of the urine change, depending on influences such as water intake, exercise, environmental temperature, nutrient intake, and other factors . Some of the characteristics such as color and odor are rough descriptors of your state of hydration. For example, if you exercise or work outside, and sweat a great deal, your urine will turn darker and produce a slight odor, even if you drink plenty of water. Athletes are often advised to consume water until their urine is clear. This is good advice; however, it takes time for the kidneys to process body fluids and store it in the bladder. Another way of looking at this is that the quality of the urine produced is an average over the time it takes to make that urine. Producing clear urine may take only a few minutes if you are drinking a lot of water or several hours if you are working outside and not drinking much.

Figure 2.20 Urine Color

Urine volume varies considerably. The normal range is one to two liters per day. The kidneys must produce a minimum urine volume of about 500 mL/day to rid the body of wastes. Output below this level may be caused by severe dehydration or renal disease and is termed oliguria. The virtual absence of urine production is termed anuria. Excessive urine production is polyuria, which may occur in diabetes mellitus when blood glucose levels exceed the filtration capacity of the kidneys and glucose appears in the urine. The osmotic nature of glucose attracts water, leading to increased water loss in the urine.

Urine is a fluid of variable composition that requires specialized structures to remove it from the body safely and efficiently. Blood is filtered, and the filtrate is transformed into urine at a relatively constant rate throughout the day. This processed liquid is stored until a convenient time for excretion. All structures involved in the transport and storage of the urine are large enough to be visible to the naked eye. This transport and storage system not only stores the waste, but it protects the tissues from damage due to the wide range of pH and osmolarity of the urine, prevents infection by foreign organisms, and for the male, provides reproductive functions. The urinary bladder collects urine from both ureters (Figure 2.21 “Urinary System Location”).

Figure 2.21 Urinary System Location

Image by CK-12 Foundation / CC BY-NC-SA

Figure 2.22 The Bladder

The kidneys lie on either side of the spine in the retroperitoneal space behind the main body cavity that contains the intestines. The kidneys are well protected by muscle, fat, and the lower ribs. They are roughly the size of your fist, and the male kidney is typically a bit larger than the female kidney. The kidneys are well vascularized, receiving about 25 percent of the cardiac output at rest.

Figure 2.23 The Kidneys

The kidneys (as viewed from the back of the body) are slightly protected by the ribs and are surrounded by fat for protection (not shown).

The effects of failure of parts of the urinary system may range from inconvenient (incontinence) to fatal (loss of filtration and many other functions). The kidneys catalyze the final reaction in the synthesis of active vitamin D that in turn helps regulate Ca++. The kidney hormone EPO stimulates erythrocyte development and promotes adequate O2 transport. The kidneys help regulate blood pressure through Na+ and water retention and loss. The kidneys work with the adrenal cortex, lungs, and liver in the renin–angiotensin–aldosterone system to regulate blood pressure. They regulate osmolarity of the blood by regulating both solutes and water. Three electrolytes are more closely regulated than others: Na+, Ca++, and K+. The kidneys share pH regulation with the lungs and plasma buffers, so that proteins can preserve their three-dimensional conformation and thus their function.

The Muscular System

The muscular system allows the body to move voluntarily, but it also controls involuntary movements of other organ systems such as heartbeat in the circulatory system and peristaltic waves in the digestive system. It consists of over six hundred skeletal muscles, as well as the heart muscle, the smooth muscles that surround your entire alimentary canal, and all your arterial blood vessels (see Figure 2.24 “The Muscular System in the Human Body”). Muscle contraction relies on energy delivery to the muscle. Each movement uses up cellular energy, and without an adequate energy supply, muscle function suffers. Muscle, like the liver, can store the energy from glucose in the large polymeric molecule glycogen. But unlike the liver, muscles use up all of their own stored energy and do not export it to other organs in the body. Muscle is not as susceptible to low levels of blood glucose as the brain because it will readily use alternate fuels such as fatty acids and protein to produce cellular energy.

Figure 2.24 The Muscular System in the Human Body

The Skeletal System

Bone Structure and Function

Your bones are stronger than reinforced concrete. Bone tissue is a composite of fibrous strands of collagen (a type of protein) that resemble the steel rebar in concrete and a hardened mineralized matrix that contains large amounts of calcium, just like concrete. But this is where the similarities end. Bone outperforms reinforced concrete by several orders of magnitude in compression and tension strength tests. Why? The microarchitecture of bone is complex and built to withstand extreme forces. Moreover, bone is a living tissue that is continuously breaking down and forming new bone to adapt to mechanical stresses.

Why Is the Skeletal System Important?

The human skeleton consists of 206 bones and other connective tissues called ligaments, tendons, and cartilage. Ligaments connect bones to other bones, tendons connect bones to muscles, and cartilage provides bones with more flexibility and acts as a cushion in the joints between bones. The skeleton’s many bones and connective tissues allow for multiple types of movement such as typing and running. The skeleton provides structural support and protection for all the other organ systems in the body. The skull, or cranium, is like a helmet and protects the eyes, ears, and brain. The ribs form a cage that surrounds and protects the lungs and heart. In addition to aiding in movement, protecting organs, and providing structural support, red and white blood cells and platelets are synthesized in bone marrow. Another vital function of bones is that they act as a storage depot for minerals such as calcium, phosphorous, and magnesium. Although bone tissue may look inactive at first glance, at the microscopic level you will find that bones are continuously breaking down and reforming. Bones also contain a complex network of canals, blood vessels, and nerves that allow for nutrient transport and communication with other organ systems.

Figure 2.25 Human Skeletal Structure

The human skeleton contains 206 bones. It is divided into two main parts, the axial and appendicular. Image by Openstax / CC BY Download for free at http://cnx.org/contents/3d4e4991-1e5b-4700-9c46-1a9ab4143bc2@3.

Bone Anatomy and Structure

To optimize bone health through nutrition, it is important to understand bone anatomy. The skeleton is composed of two main parts, the axial and the appendicular parts. The axial skeleton consists of the skull, vertebral column, and rib cage, and is composed of eighty bones. The appendicular skeleton consists of the shoulder girdle, pelvic girdle, and upper and lower extremities, and is composed of 126 bones. Bones are also categorized by size and shape. There are four types of bone: long bones, short bones, flat bones, and irregular bones. The longest bone in your body is the femur (thigh bone), which extends from your hip to your knee. It is a long bone and functions to support your weight as you stand, walk, or run. Your wrist is composed of eight irregular-shaped bones, which allow for the intricate movements of your hands. Your twelve ribs on each side of your body are curved flat bones that protect your heart and lungs. Thus, the bones’ different sizes and shapes allow for their different functions.

Bones are composed of approximately 65 percent inorganic material known as mineralized matrix. This mineralized matrix consists of mostly crystallized hydroxyapatite. The bone’s hard crystal matrix of bone tissue gives it its rigid structure. The other 35 percent of bone is organic material, most of which is the fibrous protein collagen. The collagen fibers are networked throughout bone tissue and provide it with flexibility and strength. The bones’ inorganic and organic materials are structured into two different tissue types. There is spongy bone, also called trabecular or cancellous bone, and compact bone, also called cortical bone (Figure 2.26 “The Arrangement of Bone Tissues”). The two tissue types differ in their microarchitecture and porosity. Trabecular bone is 50 to 90 percent porous and appears as a lattice-like structure under the microscope. It is found at the ends of long bones, in the cores of vertebrae, and in the pelvis. Trabecular bone tissue makes up about 20 percent of the adult skeleton. The more dense cortical bone is about 10 percent porous and it looks like many concentric circles, similar to the rings in a tree trunk, sandwiched together (Figure 2.27 “Cortical (Compact) Bone”). Cortical bone tissue makes up approximately 80 percent of the adult skeleton. It surrounds all trabecular tissue and is the only bone tissue in the shafts of long bones.

Figure 2.26 The Arrangement of Bone Tissues

The two basic tissue types of bones are trabecular and cortical. This photo shows normal (left) and degraded (right) trabecular (spongy) bone. Image by Gtirouflet / CC BY-SA 3.0

Figure 2.27 Cortical (Compact) Bone.

“Compact Bone with osteons”. Image by Lord of Konrad / CC0

Bone tissue is arranged in an organized manner. A thin membrane, called the periosteum, surrounds the bone. It contains connective tissue with many blood vessels and nerves. Lying below the periosteum is the cortical bone. In some bones, the cortical bone surrounds the less-dense trabecular bone and the bone marrow lies within the trabecular bone, but not all bones contain trabecular tissue or marrow.

Bone Tissues and Cells, Modeling and Remodeling

Bone tissue contains many different cell types that constantly resize and reshape bones throughout growth and adulthood. Bone tissue cells include osteoprogenitor cells, osteoblasts, osteoclasts, and osteocytes. The osteoprogenitor cells are cells that have not matured yet. Once they are stimulated, some will become osteoblasts, the bone builders, and others will become osteoclasts, the cells that break bone down. Osteocytes are the most abundant cells in bone tissue. Osteocytes are star-shaped cells that are networked throughout the bone via their long cytoplasmic arms that allow for the exchange of nutrients and other factors from bones to the blood and lymph.

Bone Modeling and Remodeling

During infancy, childhood, and adolescence, bones are continuously growing and changing shape through two processes called growth (ossification) and modeling. In fact, in the first year of life, almost 100 percent of the bone tissue in the skeleton is replaced. In the process of modeling, bone tissue is dismantled at one site and built up at a different site. In adulthood, our bones stop growing and modeling, but continue to go through a process of bone remodeling. In the process of remodeling, bone tissue is degraded and built up at the same location. About 10 percent of bone tissue is remodeled each year in adults. Bones adapt their structure to the forces acting upon them, even in adulthood. This phenomenon is called Wolff’s law, which states that bones will develop a structure that is best able to resist the forces acting upon them. This is why exercising, especially when it involves weight-bearing activities, increases bone strength.

The first step in bone remodeling is osteocyte activation. Osteocytes detect changes in mechanical forces, calcium homeostasis, or hormone levels. In the second step, osteoclasts are recruited to the site of the degradation. Osteoclasts are large cells with a highly irregular ruffled membrane. These cells fuse tightly to the bone and secrete hydrogen ions, which acidify the local environment and dissolve the minerals in the bone tissue matrix. This process is called bone resorption and resembles pit excavation. Our bodies excavate pits in our bone tissue because bones act as storehouses for calcium and other minerals. Bones supply these minerals to other body tissues as the demand arises. Bone tissue also remodels when it breaks so that it can repair itself. Moreover, if you decide to train to run a marathon your bones will restructure themselves by remodeling to be better able to sustain the forces of their new function.

After a certain amount of bone is excavated, the osteoclasts begin to die and bone resorption stops. In the third step of bone remodeling, the site is prepared for building. In this stage, sugars and proteins accumulate along the bone’s surface, forming a cement line which acts to form a strong bond between the old bone and the new bone that will be made. These first three steps take approximately two to three weeks to complete. In the last step of bone remodeling, osteoblasts lay down new osteoid tissue that fills up the cavities that were excavated during the resorption process. Osteoid is bone matrix tissue that is composed of proteins such as collagen and is not mineralized yet. To make collagen, vitamin C is required. A symptom of vitamin C deficiency (known as scurvy) is bone pain, which is caused by diminished bone remodeling. After the osteoid tissue is built up, the bone tissue begins to mineralize. The last step of bone remodeling continues for months, and for a much longer time afterward the mineralized bone is continuously packed in a more dense fashion.

Thus, we can say that bone is a living tissue that continually adapts itself to mechanical stress through the process of remodeling. For bone tissue to remodel certain nutrients such as calcium, phosphorus, magnesium, fluoride, vitamin D, and vitamin K are required.

Bone Mineral Density Is an Indicator of Bone Health

Bone mineral density (BMD) is a measurement of the amount of calcified tissue in grams per centimeter squared of bone tissue. BMD can be thought of as the total amount of bone mass in a defined area. When BMD is high, bone strength will be great. Similar to measuring blood pressure to predict the risk of stroke, a BMD measurement can help predict the risk of bone fracture. The most common tool used to measure BMD is called dual energy X-ray absorptiometry (DEXA). During this procedure, a person lies on their back and a DEXA scanner passes two X-ray beams through their body. The amount of X-ray energy that passes through the bone is measured for both beams. The total amount of the X-ray energy that passes through a person varies depending on their bone thickness. Using this information and a defined area of bone, the amount of calcified tissue in grams per unit area (cm2) is calculated. Most often the DEXA scan focuses on measuring BMD in the hip and the spine. These measurements are then used as indicators of overall bone strength and health. DEXA is the cheapest and most accurate way to measure BMD. It also uses the lowest dose of radiation. Other methods of measuring BMD include quantitative computed tomography (QCT) and radiographic absorptiometry. People at risk for developing bone disease are advised to have a DEXA scan. We will discuss the many risk factors linked to an increased incidence of osteoporosis and the steps a person can take to prevent the disease from developing.

The Immune System

The immune system comprises several types of white blood cells that circulate in the blood and lymph. Their jobs are to seek, recruit, attack, and destroy foreign invaders, such as bacteria and viruses. Other less realized components of the immune system are the skin (which acts as a barricade), mucus (which traps and entangles microorganisms), and even the bacteria in the large intestine (which prevent the colonization of bad bacteria in the gut). Immune system functions are completely dependent on dietary nutrients. In fact, malnutrition is the leading cause of immune-system deficiency worldwide. When immune system functions are inadequate there is a marked increase in the chance of getting an infection. Children in many poor, developing countries have protein- and/or energy-deficient diets that are causative of two different syndromes, kwashiorkor and marasmus. These children often die from infections that their bodies would normally have fought off, but because their protein and/or energy intake is so low, the immune system cannot perform its functions.

Other nutrients, such as iron, zinc, selenium, copper, folate, and vitamins A, B6, C, D, and E, all provide benefits to immune system function. Deficiencies in these nutrients can cause an increased risk for infection and death. Zinc deficiency results in suppression of the immune system’s barrier functions by damaging skin cells; it is also associated with a decrease in the number of circulating white blood cells. A review of several studies in the journal Pediatrics concluded that zinc supplements administered to children under age five for longer than three months significantly reduces the incidence and severity of diarrhea and respiratory illnesses.Aggarwal R, Sentz J, Miller MA. Role of Zinc Administration in Prevention of Childhood Diarrhea and Respiratory Illnesses: A Meta-Analysis. Pediatrics. 2007; 119(6), 1120–30. https://www.ncbi.nlm.nih.gov/pubmed/17545379. Accessed September 22, 2017.

Zinc supplementation also has been found to be therapeutically beneficial for the treatment of leprosy, tuberculosis, pneumonia, and the common cold. Equally important to remember is that multiple studies show that it is best to obtain your minerals and vitamins from eating a variety of healthy foods.

Just as undernutrition compromises immune system health, so does overnutrition. People who are obese are at increased risk for developing immune system disorders such as asthma, rheumatoid arthritis, and some cancers. Both the quality and quantity of fat affect immune system function. High intakes of saturated and trans fats negatively affect the immune system, whereas increasing your intake of omega-3 fatty acids, found in salmon and other oily fish, decreases inflammatory responses. High intakes of omega-3 fatty acids are linked to a reduction in the risk of developing certain autoimmune disorders, such as rheumatoid arthritis, and are used as part of a comprehensive treatment for rheumatoid arthritis.

Indicators of Health: Body Mass Index, Body Fat Content, and Fat Distribution

Although the terms overweight and obese are often used interchangeably and considered as gradations of the same thing, they denote different things. The major physical factors contributing to body weight are water weight, muscle tissue mass, bone tissue mass, and fat tissue mass. Overweight refers to having more weight than normal for a particular height and may be the result of water weight, muscle weight, or fat mass. Obese refers specifically to having excess body fat. In most cases people who are overweight also have excessive body fat and therefore body weight is an indicator of obesity in much of the population.

The “ideal” healthy body weight for a particular person is dependent on many things, such as frame size, sex, muscle mass, bone density, age, and height. The perception of the “ideal” body weight is additionally dependent on cultural factors and the mainstream societal advertisement of beauty.

To standardize the “ideal” body weight and relate it to health, scientists have devised mathematical formulas to better define a healthy weight. These mathematically derived measurements are used by health professionals to correlate disease risk with populations of people and at the individual level. A clinician will take two measurements, one of weight and one of fat mass, in order to diagnose obesity. Some measurements of weight and body fat that do not require using technical equipment can easily be calculated and help provide an individual with information on weight, fat mass, and distribution, and their relative risk of some chronic diseases.

Figure 2.28 Body Composition

Body Mass Index: How to Measure It and Its Limitations

Body mass index (BMI) is calculated using height and weight measurements and is more predictive of body fatness than weight alone. BMI measurements are used to indicate whether an individual may be underweight (with a BMI less than 18.5), overweight (with a BMI over 25), or obese (with a BMI over 30). High BMI measurements can be warning signs of health hazards ahead, such as cardiovascular disease, Type 2 diabetes, and other chronic diseases. BMI-associated health risks vary by race. Asians face greater health risks for the same BMI than Caucasians, and Caucasians face greater health risks for the same BMI than African Americans.

Calculating BMI

To calculate your BMI, multiply your weight in pounds by 703 (conversion factor for converting to metric units) and then divide the product by your height in inches, squared.

BMI = [weight (lb) x 703] ÷ height (in)2
or
BMI = [weight (kg)] ÷ height (m)2

More Ways to Calculate

The National Heart, Lung, and Blood Institute and the CDC have automatic BMI calculators on their websites:

To see how your BMI indicates the weight category you are in, see Table 2.3 “BMI Categories” or use a chart of weight and height to figure out your BMI.

Table 2.3 BMI Categories

Categories BMI
Underweight < 18.5
Normal weight 18.5–24.9
Overweight 25–29.9
Obese > 30.0

Source: National Heart, Lung, and Blood Institute. Accessed November 4, 2012. https://www.nhlbi.nih.gov.

BMI Limitations

A BMI is a fairly simple measurement and does not take into account fat mass or fat distribution in the body, both of which are additional predictors of disease risk. Body fat weighs less than muscle mass. Therefore, BMI can sometimes underestimate the amount of body fat in overweight or obese people and overestimate it in more muscular people. For instance, a muscular athlete will have more muscle mass (which is heavier than fat mass) than a sedentary individual of the same height. Based on their BMIs the muscular athlete would be less “ideal” and may be categorized as more overweight or obese than the sedentary individual; however this is an infrequent problem with BMI calculation. Additionally, an older person with osteoporosis (decreased bone mass) will have a lower BMI than an older person of the same height without osteoporosis, even though the person with osteoporosis may have more fat mass. BMI is a useful inexpensive tool to categorize people and is highly correlative with disease risk, but other measurements are needed to diagnose obesity and more accurately assess disease risk.

Body Fat and Its Distribution

Next we’ll discuss how to measure body fat, and why distribution of body fat is also important to consider when determining health.

Measuring Body Fat Content

Water, organs, bone tissue, fat, and muscle tissue make up a person’s weight. Having more fat mass may be indicative of disease risk, but fat mass also varies with sex, age, and physical activity level. Females have more fat mass, which is needed for reproduction and, in part, is a consequence of different levels of hormones. The optimal fat content of a female is between 20 and 30 percent of her total weight and for a male is between 12 and 20 percent. Fat mass can be measured in a variety of ways. The simplest and lowest-cost way is the skin-fold test. A health professional uses a caliper to measure the thickness of skin on the back, arm, and other parts of the body and compares it to standards to assess body fatness. It is a noninvasive and fairly accurate method of measuring fat mass, but similar to BMI, is compared to standards of mostly young to middle-aged adults.

Figure 2.29 Measuring Skinfold Thickness Using Calipers

Image by Shutterstock. All Rights Reserved.

Other methods of measuring fat mass are more expensive and more technically challenging. They include:

Figure 2.30 BIA Hand Device

Image by United States Marine Corps / U.S. Public Domain

Figure 2.31 Dual-Energy X-ray Absorptiometry (DEXA)

“A Dual-energy X-ray absorptiometry (DEXA) scan” by Nick Smith / CC BY-SA 3.0

Measuring Fat Distribution

Total body-fat mass is one predictor of health; another is how the fat is distributed in the body. You may have heard that fat on the hips is better than fat in the belly—this is true. Fat can be found in different areas in the body and it does not all act the same, meaning it differs physiologically based on location. Fat deposited in the abdominal cavity is called visceral fat and it is a better predictor of disease risk than total fat mass. Visceral fat releases hormones and inflammatory factors that contribute to disease risk. The only tool required for measuring visceral fat is a measuring tape. The measurement (of waist circumference) is taken just above the belly button. Men with a waist circumference greater than 40 inches and women with a waist circumference greater than 35 inches are predicted to face greater health risks.

Figure 2.32 Fat Distribution

The waist-to-hip ratio is often considered a better measurement than waist circumference alone in predicting disease risk. To calculate your waist-to-hip ratio, use a measuring tape to measure your waist circumference and then measure your hip circumference at its widest part. Next, divide the waist circumference by the hip circumference to arrive at the waist-to-hip ratio. Observational studies have demonstrated that people with “apple-shaped” bodies, (who carry more weight around the waist) have greater risks for chronic disease than those with “pear-shaped” bodies, (who carry more weight around the hips). A study published in the November 2005 issue of Lancet with more than twenty-seven thousand participants from fifty-two countries concluded that the waist-to-hip ratio is highly correlated with heart attack risk worldwide and is a better predictor of heart attacks than BMI.Yusuf S, Hawken S, et al. Obesity and the Risk of Myocardial Infarction in 27,000 Participants from 52 Countries: A Case-Control Study. Lancet. 2005; 366(9497), 1640–9. http://www.ncbi.nlm.nih.gov/pubmed/16271645 ?dopt=AbstractPlus. Accessed September 22, 2017.. Abdominal obesity is defined by the World Health Organization (WHO) as having a waist-to-hip ratio above 0.90 for males and above 0.85 for females.

III

Chapter 3. Water and Electrolytes

Introduction

Mōhala i ka wai ka maka o ka pua

Unfolded by the water are the faces of the flowers


A leaf holding a droplet of water

Image by 贝莉儿 NG on unsplash.com / CC0

Learning Objectives

By the end of this chapter you will be able to:

  • Describe the importance of water intake for the body
  • Describe the major aspects of water regulation in the body
  • Describe the function, balance, sources, and consequences of the imbalance of electrolytes
  • Describe the effects and use of popular beverage choices

Maintaining the right level of water in your body is crucial to survival, as either too little or too much water in your body will result in less-than-optimal functioning. One mechanism to help ensure the body maintains water balance is thirst. Thirst is the result of your body’s physiology telling your brain to initiate the thought to take a drink. Sensory proteins detect when your mouth is dry, your blood volume too low, or blood electrolyte concentrations too high and send signals to the brain stimulating the conscious feeling to drink.

In the summer of 1965, the assistant football coach of the University of Florida Gators requested scientists affiliated with the university study why the withering heat of Florida caused so many heat-related illnesses in football players and provide a solution to increase athletic performance and recovery post-training or game. The discovery was that inadequate replenishment of fluids, carbohydrates, and electrolytes was the reason for the “wilting” of their football players. Based on their research, the scientists concocted a drink for the football players containing water, carbohydrates, and electrolytes and called it “Gatorade.” In the next football season the Gators were nine and two and won the Orange Bowl. The Gators’ success launched the sports-drink industry, which is now a multibillion-dollar industry that is still dominated by Gatorade.

The latest National Health and Nutrition Examination Survey, covering the period from 2005 to 2008, reports that about 50 percent of Americans consume sugary drinks daily.Ogden C, Kit B, et al. Consumption of Sugar Drinks in the United States, 2005–2008. Centers for Disease Control and Prevention. NCHS Data Brief no. 71. http://www.cdc.gov/nchs/data/databriefs/db71.htm. Published August 2011. Accessed September 22, 2017.

Excess consumption of sugary soft drinks have been scientifically proven to increase the risk for dental caries, obesity, Type 2 diabetes, and cardiovascular disease. In addition to sugary soft drinks, beverages containing added sugars include fruit drinks, sports drinks, energy drinks and sweetened bottled waters.

Sports drinks are designed to rehydrate the body after excessive fluid depletion. Electrolytes in particular promote normal rehydration to prevent fatigue during physical exertion. Are they a good choice for achieving the recommended fluid intake? Are they performance and endurance enhancers like they claim? Who should drink them?

Typically, eight ounces of a sports drink provides between fifty and eighty calories and 14 to 17 grams of carbohydrate, mostly in the form of simple sugars. Sodium and potassium are the most commonly included electrolytes in sports drinks, with the levels of these in sports drinks being highly variable. The American College of Sports Medicine says a sports drink should contain 125 milligrams of sodium per 8 ounces as it is helpful in replenishing some of the sodium lost in sweat and promotes fluid uptake in the small intestine, improving hydration.

In this chapter we will discuss the importance and functions of fluid and electrolyte balance in the human body, the consequences of getting too much or too little of water and electrolytes, the best dietary sources of these nutrients, and healthier beverage choices. After reading this chapter you will know what to look for in sports drinks and will be able to select the best products to keep hydrated.

Overview of Fluid and Electrolyte Balance

Water is made up of 2 hydrogen atoms and 1 oxygen atom (Figure 3.1 “The Water Molecule”). A human body is made up of mostly water. An adult consists of about 37 to 42 liters of water, or about eighty pounds. Fortunately, humans have compartmentalized tissues; otherwise we might just look like a water balloon! Newborns are approximately 70 percent water. Adult males typically are composed of about 60 percent water and females are about 55 percent water. (This gender difference reflects the differences in body-fat content, since body fat is practically water-free. This also means that if a person gains weight in the form of fat the percentage of total body water content declines.) As we age, total body water content also diminishes so that by the time we are in our eighties the percent of water in our bodies has decreased to around 45 percent. Does the loss in body water play a role in the aging process? Alas, no one knows. But, we do know that dehydration accelerates the aging process whereas keeping hydrated decreases headaches, muscle aches, and kidney stones. Additionally a study conducted at the Fred Hutchinson Cancer Research Center in Seattle found that women who drank more than five glasses of water each day had a significantly decreased risk for developing colon cancer.Shannon JE, et al. Relationship of Food Groups and Water Intake to Colon Cancer Risk. Cancer Epidemiol Biomarkers Prev. 1996; 5(7), 495–502. http://cebp.aacrjournals.org/content/5/7/495.long. Accessed September 22, 2017.

Figure 3.1 The Water Molecule

Fluid and Electrolyte Balance

Although water makes up the largest percentage of body volume, it is not actually pure water but rather a mixture of cells, proteins, glucose, lipoproteins, electrolytes, and other substances. Electrolytes are substances that, when dissolved in water, dissociate into charged ions. Positively charged electrolytes are called cations and negatively charged electrolytes are called anions. For example, in water sodium chloride (the chemical name for table salt) dissociates into sodium cations (Na+) and chloride anions (Cl−). Solutes refers to all dissolved substances in a fluid, which may be charged, such as sodium (Na+), or uncharged, such as glucose. In the human body, water and solutes are distributed into two compartments: inside cells, called intracellular, and outside cells, called extracellular. The extracellular water compartment is subdivided into the spaces between cells also known as interstitial, blood plasma, and other bodily fluids such as the cerebrospinal fluid which surrounds and protects the brain and spinal cord (Figure 3.2 “Distribution of Body Water”). The composition of solutes differs between the fluid compartments. For instance, more protein is inside cells than outside and more chloride anions exist outside of cells than inside.

Figure 3.2 Distribution of Body Water

Osmoregulation

One of the essential homeostatic functions of the body is to maintain fluid balance and the differences in solute composition between cells and their surrounding environment. Osmoregulation is the control of fluid balance and composition in the body. The processes involved keep fluids from becoming too dilute or too concentrated. Fluid compartments are separated by selectively permeable membranes, which allow some things, such as water, to move through while other substances require special transport proteins, channels, and often energy. The movement of water between fluid compartments happens by osmosis, which is simply the movement of water through a selectively permeable membrane from an area where it is highly concentrated to an area where it is not so concentrated. Water is never transported actively; that is, it never takes energy for water to move between compartments. Although cells do not directly control water movement, they do control movement of electrolytes and other solutes and thus indirectly regulate water movement by controlling where there will be regions of high and low concentrations.

Cells maintain their water volume at a constant level, but the composition of solutes in a cell is in a continuous state of flux. This is because cells are bringing nutrients in, metabolizing them, and disposing of waste products. To maintain water balance a cell controls the movement of electrolytes to keep the total number of dissolved particles, called osmolality the same inside and outside (Figure 3.3 “Osmoregulation”). The total number of dissolved substances is the same inside and outside a cell, but the composition of the fluids differs between compartments. For example, sodium exists in extracellular fluid at fourteen times the concentration as compared to that inside a cell.

Figure 3.3 Osmoregulation

Cells maintain water volume by actively controlling electrolyte concentrations. Human erythrocytes (red blood cells) are shown here. Three conditions are shown: hypertonic conditions (where the erythrocytes contract and appear “spiky”), isotonic conditions (where the erythrocytes appear normal) and hypotonic conditions (where the etrythrocytes expand and become more round).

If a cell is placed in a solution that contains fewer dissolved particles (hypotonic solution) than the cell itself, water moves into the more concentrated cell, causing it to swell. Alternatively, if a cell is placed in a solution that is more concentrated (known as a hypertonic solution) water moves from inside the cell to the outside, causing it to shrink. Cells keep their water volume constant by pumping electrolytes in and out in an effort to balance the concentrations of dissolved particles on either side of their membranes. When a solution contains an equal concentration of dissolved particles on either side of the membrane, it is known as an isotonic solution.

Water’s Importance to Vitality

You get up in the morning, flush wastes down the toilet, take a shower, brush your teeth, drink, eat, drive, wash the grime from your windshield, get to work, and drink coffee. Next to a fountain you eat lunch and down it with a glass of water, you use the toilet again and again, drive home, prepare dinner, etc. Add all the ways you use water every day and you still will not come close to the countless uses water has in the human body. Of all the nutrients, water is the most critical as its absence proves lethal within a few days. Organisms have adapted numerous mechanisms for water conservation. Water uses in the human body can be loosely categorized into four basic functions: transportation vehicle, medium for chemical reactions, lubricant/shock absorber, and temperature regulator.

Satellite image of a coastal area

Image by NASA on unsplash.com / CC0

Water is the foundation of all life—the surface of the earth is 70 percent water; the volume of water in humans is about 60 percent.

Water As a Transportation Vehicle

Water is called the “universal solvent” because more substances dissolve in it than any other fluid. Molecules dissolve in water because of the hydrogen and oxygen molecules ability to loosely bond with other molecules. Molecules of water (H2O) surround substances, suspending them in a sea of water molecules. The solvent action of water allows for substances to be more readily transported. A pile of undissolved salt would be difficult to move throughout tissues, as would a bubble of gas or a glob of fat. Blood, the primary transport fluid in the body is about 78 percent water. Dissolved substances in blood include proteins, lipoproteins, glucose, electrolytes, and metabolic waste products, such as carbon dioxide and urea. These substances are either dissolved in the watery surrounding of blood to be transported to cells to support basic functions or are removed from cells to prevent waste build-up and toxicity. Blood is not just the primary vehicle of transport in the body, but also as a fluid tissue blood structurally supports blood vessels that would collapse in its absence. For example, the brain which consists of 75 percent water is used to provide structure.

Water As a Medium for Chemical Reactions

Water is required for even the most basic chemical reactions. Proteins fold into their functional shape based on how their amino-acid sequences react with water. These newly formed enzymes must conduct their specific chemical reactions in a medium, which in all organisms is water. Water is an ideal medium for chemical reactions as it can store a large amount of heat, is electrically neutral, and has a pH of 7.0, meaning it is not acidic or basic. Additionally, water is involved in many enzymatic reactions as an agent to break bonds or, by its removal from a molecule, to form bonds.

Water As a Lubricant/Shock Absorber

Many may view the slimy products of a sneeze as gross, but sneezing is essential for removing irritants and could not take place without water. Mucus, which is not only essential to discharge nasal irritants, is also required for breathing, transportation of nutrients along the gastrointestinal tract, and elimination of waste materials through the rectum. Mucus is composed of more than 90 percent water and a front-line defense against injury and foreign invaders. It protects tissues from irritants, entraps pathogens, and contains immune-system cells that destroy pathogens. Water is also the main component of the lubricating fluid between joints and eases the movement of articulated bones.

The aqueous and vitreous humors, which are fluids that fill the extra space in the eyes and the cerebrospinal fluid surrounding the brain and spinal cord, are primarily water and buffer these organs against sudden changes in the environment. Watery fluids surrounding organs provide both chemical and mechanical protection. Just two weeks after fertilization water fills the amniotic sac in a pregnant woman providing a cushion of protection for the developing embryo.

Water As a Temperature Regulator

Another homeostatic function of the body, termed thermoregulation is to balance heat gain with heat loss and body water plays an important role in accomplishing this. Human life is supported within a narrow range of temperature, with the temperature set point of the body being 98.6°F (37°C). Too low or too high of a temperature causes enzymes to stop functioning and metabolism is halted. At 82.4°F (28°C) muscle failure occurs and hypothermia sets in. At the opposite extreme of 111.2°F (44°C) the central nervous system fails and death results. Water is good at storing heat, an attribute referred to as heat capacity and thus helps maintain the temperature set point of the body despite changes in the surrounding environment.

There are several mechanisms in place that move body water from place to place as a method to distribute heat in the body and equalize body temperature (Figure 3.4 “Thermoregulatory Center”). The hypothalamus in the brain is the thermoregulatory center. The hypothalamus contains special protein sensors that detect blood temperature. The skin also contains temperature sensors that respond quickly to changes in immediate surroundings. In response to cold sensors in the skin, a neural signal is sent to the hypothalamus, which then sends a signal to smooth muscle tissue surrounding blood vessels causing them to constrict and reduce blood flow. This reduces heat lost to the environment. The hypothalamus also sends signals to muscles to erect hairs and shiver and to endocrine glands like the thyroid to secrete hormones capable of ramping up metabolism. These actions increase heat conservation and stimulate its production in the body in response to cooling temperatures.

Figure 3.4 Thermoregulatory Center

Thermoregulation is the ability of an organism to maintain body temperature despite changing environmental temperatures.

Regulation of Water Balance

As you eat a bite of food, the salivary glands secrete saliva. As the food enters your stomach, gastric juice is secreted. As it enters the small intestine, pancreatic juice is secreted. Each of these fluids contains a great deal of water. How is that water replaced in these organs? What happens to the water now in the intestines? In a day, there is an exchange of about 10 liters of water among the body’s organs. The osmoregulation of this exchange involves complex communication between the brain, kidneys, and endocrine system. A homeostatic goal for a cell, a tissue, an organ, and an entire organism is to balance water output with water input.

Regulation of Daily Water Input

Total water output per day averages 2.5 liters. This must be balanced with water input. Our tissues produce around 300 milliliters of water per day through metabolic processes. The remainder of water output must be balanced by drinking fluids and eating solid foods. The average fluid consumption per day is 1.5 liters, and water gained from solid foods approximates 700 milliliters.

Figure 3.5 Daily Fluid Loss and Gain

Daily Fluid Loss and Gain


Dietary Gain of Water

The Food and Nutrition Board of the Institute of Medicine (IOM) has set the Adequate Intake (AI) for water for adult males at 3.7 liters (15.6 cups) and at 2.7 liters (11 cups) for adult females.Institute of Medicine Panel on Dietary Reference Intakes for Electrolytes and Water. Dietary Reference Intakes for Water, Potassium, Sodium, Chloride, and Sulfate. The National Academies of Science, Engineering, and Medicine. Washington D.C; 2005: 73-185. http://www.nap.edu/openbook.php?record_id=10925&page=73. Accessed September 22, 2017. These intakes are higher than the average intake of 2.2 liters. It is important to note that the AI for water includes water from all dietary sources; that is, water coming from food as well as beverages. People are not expected to consume 15.6 or 11 cups of pure water per day. In America, approximately 20 percent of dietary water comes from solid foods. See Table 3.1 “Water Content in Foods” for the range of water contents for selected food items. Beverages includes water, tea, coffee, sodas, and juices.

Table 3.1 Water Content in Foods

Percentage Food Item
90–99 Nonfat milk, cantaloupe, strawberries, watermelon, lettuce, cabbage, celery, spinach, squash
80–89 Fruit juice, yogurt, apples, grapes, oranges, carrots, broccoli, pears, pineapple
70–79 Bananas, avocados, cottage cheese, ricotta cheese, baked potato, shrimp
60–69 Pasta, legumes, salmon, chicken breast
50–59 Ground beef, hot dogs, steak, feta cheese
40–49 Pizza
30–39 Cheddar cheese, bagels, bread
20–29 Pepperoni, cake, biscuits
10–19 Butter, margarine, raisins
1–9 Walnuts, dry-roasted peanuts, crackers, cereals, pretzels, peanut butter
0 Oils, sugars

Source: National Nutrient Database for Standard Reference, Release 23. US Department of Agriculture, Agricultural Research Service. http://www.ars.usda.gov/ba/bhnrc/ndl. Updated 2010. Accessed September 2017.

There is some debate over the amount of water required to maintain health because there is no consistent scientific evidence proving that drinking a particular amount of water improves health or reduces the risk of disease. In fact, kidney-stone prevention seems to be the only premise for water-consumption recommendations. You may be surprised to find out that the commonly held belief that people need to drink eight 8-ounce glasses of water per day isn’t an official recommendation and isn’t based on any scientific evidence! The amount of water/fluids a person should consume every day is actually variable and should be based on the climate a person lives in, as well as their age, physical activity level, and kidney function. No maximum for water intake has been set.

Thirst Mechanism: Why Do We Drink?

Thirst is an osmoregulatory mechanism to increase water input. The thirst mechanism is activated in response to changes in water volume in the blood, but is even more sensitive to changes in blood osmolality. Blood osmolality is primarily driven by the concentration of sodium cations. The urge to drink results from a complex interplay of hormones and neuronal responses that coordinate to increase water input and contribute toward fluid balance and composition in the body. The “thirst center” is contained within the hypothalamus, a portion of the brain that lies just above the brainstem. In older people the thirst mechanism is not as responsive and as we age there is a higher risk for dehydration. Thirst happens in the following sequence of physiological events:

  1. Receptor proteins in the kidney, heart, and hypothalamus detect decreased fluid volume or increased sodium concentration in the blood.
  2. Hormonal and neural messages are relayed to the brain’s thirst center in the hypothalamus.
    The hypothalamus sends neural signals to higher sensory areas in the cortex of the brain, stimulating the conscious thought to drink.
  3. Fluids are consumed.
  4. Receptors in the mouth and stomach detect mechanical movements involved with fluid ingestion.
  5. Neural signals are sent to the brain and the thirst mechanism is shut off.

The physiological control of thirst is the backup mechanism to increase water input. Fluid intake is controlled primarily by conscious eating and drinking habits dependent on social and cultural influences. For example, you might have a habit of drinking a glass of orange juice and eating a bowl of cereal every morning before school or work.

Figure 3.6 Regulating Water Intake

Regulation of Daily Water Output

As stated, daily water output averages 2.5 liters. There are two types of outputs. The first type is insensible water loss, meaning we are unaware of it. The body loses about 400 milliliters of its daily water output through exhalation. Another 500 milliliters is lost through our skin. The second type of output is sensible water loss, meaning we are aware of it. Urine accounts for about 1,500 milliliters of water output, and feces account for roughly 100 milliliters of water output. Regulating urine output is a primary function of the kidneys, and involves communication with the brain and endocrine system.

Figure 3.7 Regulating Water Output

The Kidneys Detect Blood Volume

The kidneys are two bean-shaped organs, each about the size of a fist and located on either side of the spine just below the rib cage. The kidneys filter about 190 liters of blood and produce (on average) 1.5 liters of urine per day. Urine is mostly water, but it also contains electrolytes and waste products, such as urea. The amount of water filtered from the blood and excreted as urine is dependent on the amount of water in, and the electrolyte composition in the blood.

Kidneys have protein sensors that detect blood volume from the pressure, or stretch, in the blood vessels of the kidneys. When blood volume is low, kidney cells detect decreased pressure and secrete the enzyme, renin. Renin travels in the blood and cleaves another protein into the active hormone, angiotensin. Angiotensin targets three different organs (the adrenal glands, the hypothalamus, and the muscle tissue surrounding the arteries) to rapidly restore blood volume and, consequently, pressure.

The Hypothalamus Detects Blood Osmolality

Sodium and fluid balance are intertwined. Osmoreceptors (specialized protein receptors) in the hypothalamus detect sodium concentration in the blood. In response to a high sodium level, the hypothalamus activates the thirst mechanism and concurrently stimulates the release of antidiuretic hormone. Thus, it is not only kidneys that stimulate antidiuretic- hormone release, but also the hypothalamus. This dual control of antidiuretic hormone release allows for the body to respond to both decreased blood volume and increased blood osmolality.

The Adrenal Glands Detect Blood Osmolality

Cells in the adrenal glands sense when sodium levels are low and potassium levels are high in the blood. In response to either stimulus, they release aldosterone. Aldosterone is released in response to angiotensin stimulation and is controlled by blood electrolyte concentrations. In either case, aldosterone communicates the same message, to increase sodium reabsorption and consequently water reabsorption. In exchange, for the reabsorption of sodium and water, potassium is excreted.

Electrolytes Important for Fluid Balance

Cells are about 75 percent water and blood plasma is about 95 percent water. Why then, does the water not flow from blood plasma to cells? The force of water also known as hydrostatic pressure maintains the volumes of water between fluid compartments against the force of all dissolved substances. The concentration is the amount of particles in a set volume of water. (Recall that individual solutes can differ in concentration between the intracellular and extracellular fluids, but the total concentration of all dissolved substances is equal.)

The force driving the water movement through the selectively permeable membrane is the higher solute concentration on the one side. Solutes at different concentrations on either side of a selectively permeable membrane exert a force, called osmotic pressure. The higher concentration of solutes on one side compared to the other of the U-tube exerts osmotic pressure, pulling the water to a higher volume on the side of the U-tube containing more dissolved particles. When the osmotic pressure is equal to the pressure of the water on the selectively permeable membrane, net water movement stops (though it still diffuses back and forth at an equal rate).

One equation exemplifying equal concentrations but different volumes is the following
5 grams of glucose in 1 liter = 10 grams of glucose in 2 liters (5g/L = 5g/L)

The differences in concentrations of particular substances provide concentration gradients that cells can use to perform work. A concentration gradient is a form of potential energy, like water above a dam. When water falls through a dam the potential energy is changed to moving energy (kinetic), that in turn is captured by turbines. Similarly, when an electrolyte at higher concentration in the extracellular fluid is transported into a cell, the potential energy is harnessed and used to perform work.

Cells are constantly transporting nutrients in and wastes out. How is the concentration of solutes maintained if they are in a state of flux? This is where electrolytes come into play. The cell (or more specifically the numerous sodium-potassium pumps in its membrane) continuously pumps sodium ions out to establish a chemical gradient. The transport protein, called the glucose symporter, uses the sodium gradient to power glucose movement into the cell. Sodium and glucose both move into the cell. Water passively follows the sodium. To restore balance, the sodium-potassium pump transfers sodium back to the extracellular fluid and water follows. Every cycle of the sodium-potassium pump involves the movement of three sodium ions out of a cell, in exchange for two potassium ions into a cell. To maintain charge neutrality on the outside of cells every sodium cation is followed by a chloride anion. Every cycle of the pump costs one molecule of ATP (adenosine triphosphate). The constant work of the sodium-potassium pump maintains the solute equilibrium and consequently, water distribution between intracellular and extracellular fluids.

The unequal movement of the positively charged sodium and potassium ions makes intracellular fluid more negatively charged than the extracellular fluid. This charge gradient is another source of energy that a cell uses to perform work. You will soon learn that this charge gradient and the sodium-potassium pump are also essential for nerve conduction and muscle contraction. The many functions of the sodium-potassium pump in the body account for approximately a quarter of total resting energy expenditure.

Figure 3.8 The Sodium-Potassium Pump

The sodium-potassium pump is the primary mechanism for cells to maintain water balance between themselves and their surrounding environment.

Sodium

Sodium is vital not only for maintaining fluid balance but also for many other essential functions. In contrast to many minerals, sodium absorption in the small intestine is extremely efficient and in a healthy individual all excess sodium is excreted by the kidneys. In fact, very little sodium is required in the diet (about 200 milligrams) because the kidneys actively reabsorb sodium. Kidney reabsorption of sodium is hormonally controlled, allowing for a relatively constant sodium concentration in the blood.

Other Functions of Sodium in the Body

The second notable function of sodium is in nerve impulse transmission. Nerve impulse transmission results from the transport of sodium cations into a nerve cell, which creates a charge difference (or voltage) between the nerve cell and its extracellular environment. Similar to how a current moves along a wire, a sodium current moves along a nerve cell. Stimulating a muscle contraction also involves the movement of sodium ions as well as other ion movements.

Sodium is essential for nutrient absorption in the small intestine and also for nutrient reabsorption in the kidney. Amino acids, glucose and water must make their way from the small intestine to the blood. To do so, they pass through intestinal cells on their way to the blood. The transport of nutrients through intestinal cells is facilitated by the sodium-potassium pump, which by moving sodium out of the cell, creates a higher sodium concentration outside of the cell (requiring ATP).

Sodium Imbalances

Sweating is a homeostatic mechanism for maintaining body temperature, which influences fluid and electrolyte balance. Sweat is mostly water but also contains some electrolytes, mostly sodium and chloride. Under normal environmental conditions (i.e., not hot, humid days) water and sodium loss through sweat is negligible, but is highly variable among individuals. It is estimated that sixty minutes of high-intensity physical activity, like playing a game of tennis, can produce approximately one liter of sweat; however the amount of sweat produced is highly dependent on environmental conditions. A liter of sweat typically contains between 1 and 2 grams of sodium and therefore exercising for multiple hours can result in a high amount of sodium loss in some people. Additionally, hard labor can produce substantial sodium loss through sweat. In either case, the lost sodium is easily replaced in the next snack or meal.

In athletes hyponatremia, or a low blood-sodium level, is not so much the result of excessive sodium loss in sweat, but rather drinking too much water. The excess water dilutes the sodium concentration in blood. Illnesses causing vomiting, sweating, and diarrhea may also cause hyponatremia. The symptoms of hyponatremia, also called water intoxication (since it is often the root cause) include nausea, muscle cramps, confusion, dizziness, and in severe cases, coma and death. The physiological events that occur in water intoxication are the following:

  1. Excessive sodium loss and/or water intake.
  2. Sodium levels fall in blood and in the fluid between cells.
  3. Water moves to where solutes are more concentrated (i.e. into cells).
  4. Cells swell.
  5. Symptoms, including nausea, muscle cramps, confusion, dizziness, and in severe cases, coma and death result.

Hyponatremia in endurance athletes (such as marathon runners) can be avoided by drinking the correct amount of water, which is about 1 cup every twenty minutes during the event. Sports drinks are better at restoring fluid and blood-glucose levels than replacing electrolytes. During an endurance event you would be better off drinking water and eating an energy bar that contains sugars, proteins, and electrolytes. The American College of Sports Medicine suggests if you are exercising for longer than one hour you eat one high carbohydrate (25–40 grams) per hour of exercise along with ample water.Convertino VA, et al. American College of Sports Medicine Position Stand. Exercise and Fluid Replacement. Medicine and Science in Sports and Exercise. 1996; 28(1) i–vii. http://www.ncbi.nlm.nih.gov/pubmed/9303999. Accessed September 22, 2017.

Watch out for the fat content, as sometimes energy bars contain a hefty dose. If you’re not exercising over an hour at high intensity, you can skip the sports drinks, but not the water. For those who do not exercise or do so at low to moderate intensity, sports drinks are another source of extra calories, sugar, and salt.

Needs and Dietary Sources of Sodium

The IOM has set an AI level for sodium for healthy adults between the ages of nineteen and fifty at 1,500 milligrams (Table 3.2 “Dietary Reference Intakes for Sodium”). Table salt is approximately 40 percent sodium and 60 percent chloride. As a reference point, only ⅔ teaspoon of salt is needed in the diet to meet the AI for sodium. The AI takes into account the amount of sodium lost in sweat during recommended physical activity levels and additionally provides for the sufficient intake of other nutrients, such as chloride.The Tolerable Upper Intake Level (UL) for sodium is 2,300 milligrams per day for adults. (Just over 1 teaspoon of salt contains the 2,300 milligrams of sodium recommended). The UL is considered appropriate for healthy individuals but not those with hypertension (high blood pressure). The IOM estimates that greater than 95 percent of men and 75 percent of women in America consume salt in excess of the UL. Many scientific studies demonstrate that reducing salt intake prevents hypertension, is helpful in reducing blood pressure after hypertension is diagnosed, and reduces the risk for cardiovascular disease. The IOM recommends that people over fifty, African Americans, diabetics, and those with chronic kidney disease should consume no more than 1,500 milligrams of sodium per day. The American Heart Association (AHA) states that all Americans, not just those listed, should consume less than 1,500 milligrams of sodium per day to prevent cardiovascular disease. The AHA recommends this because millions of people have risk factors for hypertension and there is scientific evidence supporting that lower-sodium diets are preventive against hypertension.

Table 3.2 Dietary Reference Intakes for Sodium

Age Group Adequate Intake (mg/day) Tolerable Upper Intake Level (mg/day)
Infants (0–6 months) 120 ND
Infants (6–12 months) 370 ND
Children (1–3 years) 1,000 1,500
Children (4–8 years) 1,200 1,900
Children (9–13 years) 1,500 2,200
Adolescents (14–18 years) 1,500 2,300
Adults (19–50 years) 1,500 2,300
Adults (50–70 years) 1,300 2,300
Adults (> 70 years) 1,200 2,300
ND = not determined

Source: Dietary Reference Intakes: Water, Potassium, Sodium, Chloride, and Sulfate. Institute of Medicine. http://www.iom.edu/Reports/2004/Dietary-Reference-Intakes-Water-Potassium-Sodium-Chloride-and-Sulfate.aspx. Updated February 11, 2004. Accessed September 22, 2017.

Food Sources for Sodium

Most sodium in the typical American diet comes from processed and prepared foods. Manufacturers add salt to foods to improve texture and flavor, and also as a preservative. The amount of salt in similar food products varies widely. Some foods, such as meat, poultry, and dairy foods, contain naturally-occurring sodium. For example, one cup of low-fat milk contains 107 milligrams of sodium. Naturally-occurring sodium accounts for less than 12 percent of dietary intake in a typical diet. For the sodium contents of various foods see Table 3.3 “Sodium Contents of Selected Foods”.

Figure 3.9 Dietary Sources of Sodium

Percentages of sodium intake from various sources

Table 3.3 Sodium Contents of Selected Foods

Food Group Serving Size Sodium (mg)
Breads, all types 1 oz. 95–210
Rice Chex cereal 1 ¼ c. 292
Raisin Bran cereal 1 c. 362
Frozen pizza, plain, cheese 4 oz. 450–1200
Frozen vegetables, all types ½ c. 2–160
Salad dressing, regular fat, all types 2 Tbsp. 110–505
Salsa 2 Tbsp. 150–240
Soup (tomato), reconstituted 8 oz. 700–1260
Potato chips 1 oz. (28.4 g) 120–180
Tortilla chips 1 oz. (28.4 g) 105–160
Pork 3 oz. 59
Chicken (½ breast) 69
Chicken fast food dinner 2243
Chicken noodle soup 1 c. 1107
Dill pickle 1 928
Soy sauce 1 Tbsp. 1029
Canned corn 1 c. 384
Baked beans, canned 1 c. 856
Hot dog 1 639
Burger, fast-food 1 990
Steak 3 oz. 55
Canned tuna 3 oz. 384
Fresh tuna 3 oz. 50
Dry-roasted peanuts 1 c. 986
American cheese 1 oz. 406
Tap water 8 oz. 12

Sodium on the Nutrition Facts Panel

Figure 3.10 Nutrition Label

Nutrition Facts label

Sodium levels in milligrams is a required listing on a Nutrition Facts label.

The Nutrition Facts panel displays the amount of sodium (in milligrams) per serving of the food in question (Figure 3.10 “Nutrition Label” ). Food additives are often high in sodium, for example, monosodium glutamate (MSG) contains 12 percent sodium. Additionally, baking soda, baking powder, disodium phosphate, sodium alginate, and sodium nitrate or nitrite contain a significant proportion of sodium as well. When you see a food’s Nutrition Facts label, you can check the ingredients list to identify the source of the added sodium. Various claims about the sodium content in foods must be in accordance with Food and Drug Administration (FDA) regulations (Table 3.4 “Food Packaging Claims Regarding Sodium”).

Table 3.4 Food Packaging Claims Regarding Sodium

Claim Meaning
“Light in Sodium” or “Low in Sodium” Sodium is reduced by at least 50 percent
“No Salt Added” or “Unsalted” No salt added during preparation and processing*
“Lightly Salted” 50 percent less sodium than that added to similar food
“Sodium Free” or “Salt Free” Contains less than 5 mg sodium per serving
“Very Low Salt” Contains less than 35 mg sodium per serving
“Low Salt” Contains less than 140 mg sodium per serving
*Must also declare on package “This is not a sodium-free food” if food is not sodium-free

Source: Food Labeling Guide. US Food and Drug Administration. http://www.fda.gov/Food/GuidanceComplianceRegulatoryInformation/GuidanceDocuments/FoodLabelingNutrition/FoodLabelingGuide/ucm064911.htm. Updated October 2009. Accessed October 2, 2011.

Tools for Change

To decrease your sodium intake, become a salt-savvy shopper by reading the labels and ingredients lists of processed foods and choosing those lower in salt. Even better, stay away from processed foods and control the seasoning of your foods. Eating a diet with less salty foods diminishes salt cravings so you may need to try a lower sodium diet for a week or two before you will be satisfied with the less salty food.

Salt Substitutes

For those with hypertension or those looking for a way to decrease salt use, using a salt substitute for food preparation is one option. However, many salt substitutes still contain sodium, just in lesser amounts than table salt. Also, remember that most salt in the diet is not from table-salt use, but from processed foods. Salt substitutes often replace the sodium with potassium. People with kidney disorders often have problems getting rid of excess potassium in the diet and are advised to avoid salt substitutes containing potassium. People with liver disorders should also avoid salt substitutes containing potassium because their treatment is often accompanied by potassium dysregulation. Table 3.5 “Salt Substitutes” displays the sodium and potassium amounts in some salt substitutes.

Table 3.5 Salt Substitutes

Product Serving Size Sodium (mg) Potassium (mg)
Salt 1 tsp. 2,300 0
Mrs. Dash 1 tsp. 0 40
Spike (Salt-Free) 1 tsp. 0 96
Veg-It 1 tsp. <65 <65
Accent Low-Sodium Seasoning 1 tsp. 600 0
Salt Sense 1 tsp. 1,560 0
Pleasoning Mini-Mini Salt 1 tsp. 440 0
Morton Lite Salt 1 tsp. 1,100 1,500
Estee Salt-It 1 tsp. 0 3,520
Morton Nature’s Seasons 1 tsp. 1,300 2,800
Morton Salt Substitute 1 tsp. 0 2,730
No Salt 1 tsp. 5 2,500
Nu-Salt 1 tsp. 0 529

Source: Health Facts for You: Guidelines for a Low Sodium Diet. University of Wisconsin Hospitals and Clinics Authority. http://www.uhs.wisc.edu/health-topics/nutrition-fitness-and-heart-health/documents/Sodium.pdf. Updated March 2011. Accessed September 22, 2017.

Alternative Seasonings

Table salt may seem an essential ingredient of good food, but there are others that provide alternative taste and zest to your foods. See Table 3.6 “Salt Alternatives” for an AHA list of alternative food seasonings.

Table 3.6 Salt Alternatives

Seasoning Foods
Allspice Lean ground meats, stews, tomatoes, peaches, applesauce, cranberry sauce, gravies, lean meat
Almond extract Puddings, fruits
Caraway seeds Lean meats, stews, soups, salads, breads, cabbage, asparagus, noodles
Chives Salads, sauces, soups, lean-meat dishes, vegetables
Cider vinegar Salads, vegetables, sauces
Cinnamon Fruits, breads, pie crusts
Curry powder Lean meats (especially lamb), veal, chicken, fish, tomatoes, tomato soup, mayonnaise,
Dill fish sauces, soups, tomatoes, cabbages, carrots, cauliflower, green beans, cucumbers, potatoes, salads, macaroni, lamb
Garlic (not garlic salt) Lean meats, fish, soups, salads, vegetables, tomatoes, potatoes
Ginger Chicken, fruits
Lemon juice Lean meats, fish, poultry, salads, vegetables
Mace Hot breads, apples, fruit salads, carrots, cauliflower, squash, potatoes, veal, lamb
Mustard (dry) lean ground meats, lean meats, chicken, fish, salads, asparagus, broccoli, Brussels sprouts, cabbage, mayonnaise, sauces
Nutmeg Fruits, pie crust, lemonade, potatoes, chicken, fish, lean meatloaf, toast, veal, pudding
Onion powder Lean meats, stews, vegetables, salads, soups
Paprika Lean meats, fish, soups, salads, sauces, vegetables
Parsley Lean meats, fish, soups, salads, sauces, vegetables
Peppermint extract Puddings, fruits
Pimiento Salads, vegetables, casserole dishes
Rosemary Chicken, veal, lean meatloaf, lean beef, lean pork, sauces, stuffings, potatoes, peas, lima beans
Sage Lean meats, stews, biscuits, tomatoes, green beans, fish, lima beans, onions, lean pork
Savory Salads, lean pork, lean ground meats, soups, green beans, squash, tomatoes, lima beans, peas
Thyme Lean meats (especially veal and lean pork), sauces, soups, onions, peas, tomatoes, salads
Turmeric Lean meats, fish, sauces, rice

Source: Shaking the Salt Habit. American Heart Association. http://www.heart.org/HEARTORG/Conditions/HighBloodPressure/PreventionTreatmentofHighBloodPressure/Shaking-the-Salt-Habit_UCM_303241_Article.jsp. Updated June 6, 2012. Accessed September 22, 2017.

Chloride

Chloride is the primary anion in extracellular fluid. In addition to passively following sodium, chloride has its own protein channels that reside in cell membranes. These protein channels are especially abundant in the gastrointestinal tract, pancreas, and lungs.

Chloride’s Role in Fluid Balance

Chloride aids in fluid balance mainly because it follows sodium in order to maintain charge neutrality. Chloride channels also play a role in regulating fluid secretion, such as pancreatic juice into the small intestine and the flow of water into mucus. Fluid secretion and mucus are important for many of life’s processes. Their importance is exemplified in the signs and symptoms of the genetic disease, cystic fibrosis.

Cystic Fibrosis

Cystic fibrosis (CF) is one of the most prevalent inherited diseases in people of European descent. It is caused by a mutation in a protein that transports chloride ions out of the cell. CF’s signs and symptoms include salty skin, poor digestion and absorption (leading to poor growth), sticky mucus accumulation in the lungs (causing increased susceptibility to respiratory infections), liver damage, and infertility.

Other Functions of Chloride

Chloride has several other functions in the body, most importantly in acid-base balance. Blood pH is maintained in a narrow range and the number of positively charged substances is equal to the number of negatively charged substances. Proteins, such as albumin, as well as bicarbonate ions and chloride ions, are negatively charged and aid in maintaining blood pH. Hydrochloric acid (a gastric acid composed of chlorine and hydrogen) aids in digestion and also prevents the growth of unwanted microbes in the stomach. Immune-system cells require chloride, and red blood cells use chloride anions to remove carbon dioxide from the body.

Chloride Imbalances

Low dietary intake of chloride and more often diarrhea can cause low blood levels of chloride. Symptoms typically are similar to those of hyponatremia and include weakness, nausea, and headache. Excess chloride in the blood is rare with no characteristic signs or symptoms.

Needs and Dietary Sources of Chloride

Most chloride in the diet comes from salt. (Salt is 60 percent chloride.) A teaspoon of salt equals 5,600 milligrams, with each teaspoon of salt containing 3,400 milligrams of chloride and 2,200 milligrams of sodium. The chloride AI for adults, set by the IOM, is 2,300 milligrams. Therefore just ⅔ teaspoon of table salt per day is sufficient for chloride as well as sodium. The AIs for other age groups are listed in Table 3.7 “Adequate Intakes for Chloride”.

Table 3.7 Adequate Intakes for Chloride

Age Group mg/day
Infants (0–6 months) 180
Infants (6–12 months) 570
Children (1–3 years) 1,500
Children (4–8 years) 1,900
Children (9–13 years) 2,300
Adolescents (14–18 years) 2,300
Adults (19–50 years) 2,300
Adults (51–70 years) 2,000
Adults (> 70 years) 1,800

Source: Dietary Reference Intakes: Water, Potassium, Sodium, Chloride, and Sulfate. Institute of Medicine. http://www.iom.edu/Reports/2004/Dietary-Reference-Intakes-Water-Potassium-Sodium-Chloride-and-Sulfate.aspx. Updated February 11, 2004. Accessed September 22, 2017.

Other Dietary Sources of Chloride

Chloride has dietary sources other than table salt, namely as another form of salt—potassium chloride. Dietary sources of chloride are: all foods containing sodium chloride, as well as tomatoes, lettuce, olives, celery, rye, whole-grain foods, and seafood. Although many salt substitutes are sodium-free, they may still contain chloride.

Bioavailability

Bioavailability refers to the amount of a particular nutrient in foods that is actually absorbed in the intestine and not eliminated in the urine or feces. Simply put, the bioavailability of chloride is the amount that is on hand to perform its biological functions. In the small intestine, the elements of sodium chloride split into sodium cations and chloride anions. Chloride follows the sodium ion into intestinal cells passively, making chloride absorption quite efficient. When chloride exists as a potassium salt, it is also well absorbed. Other mineral salts, such as magnesium chloride, are not absorbed as well, but bioavailability still remains high.

Potassium

Potassium is the most abundant positively charged ion inside of cells. Ninety percent of potassium exists in intracellular fluid, with about 10 percent in extracellular fluid, and only 1 percent in blood plasma. As with sodium, potassium levels in the blood are strictly regulated. The hormone aldosterone is what primarily controls potassium levels, but other hormones (such as insulin) also play a role. When potassium levels in the blood increase, the adrenal glands release aldosterone. The aldosterone acts on the collecting ducts of kidneys, where it stimulates an increase in the number of sodium-potassium pumps. Sodium is then reabsorbed and more potassium is excreted. Because potassium is required for maintaining sodium levels, and hence fluid balance, about 200 milligrams of potassium are lost from the body every day.

Other Functions of Potassium in the Body

Nerve impulse involves not only sodium, but also potassium. A nerve impulse moves along a nerve via the movement of sodium ions into the cell. To end the impulse, potassium ions rush out of the nerve cell, thereby decreasing the positive charge inside the nerve cell. This diminishes the stimulus. To restore the original concentrations of ions between the intracellular and extracellular fluid, the sodium-potassium pump transfers sodium ions out in exchange for potassium ions in. On completion of the restored ion concentrations, a nerve cell is now ready to receive the next impulse. Similarly, in muscle cells potassium is involved in restoring the normal membrane potential and ending the muscle contraction. Potassium also is involved in protein synthesis, energy metabolism, and platelet function, and acts as a buffer in blood, playing a role in acid-base balance.

Imbalances of Potassium

Insufficient potassium levels in the body (hypokalemia) can be caused by a low dietary intake of potassium or by high sodium intakes, but more commonly it results from medications that increase water excretion, mainly diuretics. The signs and symptoms of hypokalemia are related to the functions of potassium in nerve cells and consequently skeletal and smooth-muscle contraction. The signs and symptoms include muscle weakness and cramps, respiratory distress, and constipation. Severe potassium depletion can cause the heart to have abnormal contractions and can even be fatal. High levels of potassium in the blood, or hyperkalemia, also affects the heart. It is a silent condition as it often displays no signs or symptoms. Extremely high levels of potassium in the blood disrupt the electrical impulses that stimulate the heart and can cause the heart to stop. Hyperkalemia is usually the result of kidney dysfunction.

Needs and Dietary Sources of Potassium

The IOM based their AIs for potassium on the levels associated with a decrease in blood pressure, a reduction in salt sensitivity, and a minimal risk of kidney stones. For adult male and females above the age of nineteen, the adequate intake for potassium is 4,700 grams per day. The AIs for other age groups are listed in Table 3.8 “Adequate Intakes for Potassium”.

Table 3.8 Adequate Intakes for Potassium

Age Group mg/day
Infants (0–6 months) 400
Infants (6–12 months) 700
Children (1–3 years) 3,000
Children (4–8 years) 3,800
Children (9–13 years) 4,500
Adolescents (14–18 years) 4,700
Adults (> 19 years) 4,700

Dietary Reference Intakes: Water, Potassium, Sodium, Chloride, and Sulfate. Institute of Medicine. http://www.iom.edu/Reports/2004/Dietary-Reference-Intakes-Water-Potassium-Sodium-Chloride-and-Sulfate.aspx. Updated February 11, 2004. Accessed September 22, 2017.

Food Sources for Potassium

Fruits and vegetables that contain high amounts of potassium are spinach, lettuce, broccoli, peas, tomatoes, potatoes, bananas, apples and apricots. Whole grains and seeds, certain fish (such as salmon, cod, and flounder), and meats are also high in potassium. The Dietary Approaches to Stop Hypertension (DASH diet) emphasizes potassium-rich foods and will be discussed in greater detail in the next section.

Bioavailability

Greater than 90 percent of dietary potassium is absorbed in the small intestine. Although highly bioavailable, potassium is a very soluble mineral and easily lost during cooking and processing of foods. Fresh and frozen foods are better sources of potassium than canned.

Consequences of Deficiency or Excess

As with all nutrients, having too much or too little water has health consequences. Excessive water intake can dilute the levels of critical electrolytes in the blood. Water intoxication is rare, however when it does happen, it can be deadly. On the other hand, having too little water in the body is common. In fact, diarrhea-induced dehydration is the number-one cause of early-childhood death worldwide. In this section we will discuss subtle changes in electrolytes that compromise health on a chronic basis.

High-Hydration Status: Water Intoxication/Hyponatremia

Water intoxication mainly affects athletes who overhydrate. Water intoxication is extremely rare, primarily because healthy kidneys are capable of excreting up to one liter of excess water per hour. Overhydration was unfortunately demonstrated in 2007 by Jennifer Strange, who drank six liters of water in three hours while competing in a “Hold Your Wee for a Wii” radio contest. Afterward she complained of a headache, vomited, and died.

Low-Hydration Status: Dehydration

Dehydration refers to water loss from the body without adequate replacement. It can result from either water loss or electrolyte imbalance, or, most commonly, both. Dehydration can be caused by prolonged physical activity without adequate water intake, heat exposure, excessive weight loss, vomiting, diarrhea, blood loss, infectious diseases, malnutrition, electrolyte imbalances, and very high glucose levels. Physiologically, dehydration decreases blood volume. The water in cells moves into the blood to compensate for the low blood-volume, and cells shrink. Signs and symptoms of dehydration include thirst, dizziness, fainting, headaches, low blood-pressure, fatigue, low to no urine output, and, in extreme cases, loss of consciousness and death. Signs and symptoms are usually noticeable after about 2 percent of total body water is lost.

Chronic dehydration is linked to higher incidences of some diseases. There is strong evidence that low-hydration status increases the risk for kidney stones and exercise-induced asthma. There is also some scientific evidence that chronic dehydration increases the risk for kidney disease, heart disease, and the development of hyperglycemia in people with diabetes. Older people often suffer from chronic dehydration as their thirst mechanism is no longer as sensitive as it used to be.

Heat Stroke

Heat stroke is a life-threatening condition that occurs when the body temperature is greater than 105.1°F (40.6°C). It is the result of the body being unable to sufficiently cool itself by thermoregulatory mechanisms. Dehydration is a primary cause of heat stroke as there are not enough fluids in the body to maintain adequate sweat production, and cooling of the body is impaired. Signs and symptoms are dry skin (absence of sweating), dizziness, trouble breathing, rapid pulse, confusion, agitation, seizures, coma, and possibly death. Dehydration may be preceded by heat exhaustion, which is characterized by heavy sweating, rapid breathing, and fast pulse. The elderly, infants, and athletes are the most at risk for heat stroke.

Hypertension

Blood pressure is the force of moving blood against arterial walls. It is reported as the systolic pressure over the diastolic pressure, which is the greatest and least pressure on an artery that occurs with each heartbeat. The force of blood against an artery is measured with a device called a sphygmomanometer. The results are recorded in millimeters of mercury, or mmHg. A desirable blood pressure ranges between 90/60 and 120/80 mmHg. Hypertension is the scientific term for high blood pressure and defined as a sustained blood pressure of 140/90 mmHg or greater. Hypertension is a risk factor for cardiovascular disease, and reducing blood pressure has been found to decrease the risk of dying from a heart attack or stroke. The Centers for Disease Control and Prevention (CDC) reported that in 2007–2008 approximately 33 percent of Americans were hypertensive.Centers for Disease Control and Prevention. “FastStats—Hypertension.” Accessed October 2, 2011. http://www.cdc.gov/nchs/fastats/hyprtens.htm.The percentage of people with hypertension increases to over 60 percent in people over the age of sixty.

Figure 3.11 Measuring Blood Pressure

Testing a GIs blood pressure at Guantanamo by Charlie Helmholt / U.S. Public Domain

There has been much debate about the role sodium plays in hypertension. In the latter 1980s and early 1990s the largest epidemiological study evaluating the relationship of dietary sodium intake with blood pressure, called INTERSALT, was completed and then went through further analyses.Intersalt Cooperative Research Group. Intersalt: An International Study of Electrolyte Excretion and Blood Pressure. Results for 24 Hour Urinary Sodium and Potassium Excretion. BMJ. 1988; 297(6644), 319–28. http://www.ncbi.nlm.nih.gov/pmc/articles/PMC1834069/. Accessed September 20, 2017.Elliott P, Stamler J, et al. Intersalt Revisited: Further Analyses of 24 Hour Sodium Excretion and Blood Pressure within and across Populations. BMJ. 1996; 312(7041), 1249–53. http://www.ncbi.nlm.nih.gov/pubmed/8634612. Accessed September 22, 2017.

More than ten thousand men and women from thirty-two countries participated in the study. The study concluded that a higher sodium intake is linked to an increase in blood pressure. A more recent study, involving over twelve thousand US citizens, concluded that a higher sodium-to-potassium intake is linked to higher cardiovascular mortality and all-causes mortality.Yang Q, Liu T, et al. Sodium and Potassium Intake and Mortality among US Adults: Prospective Data from the Third National Health and Nutrition Examination Survey. Arch Intern Med. 2011; 171(13), 1183–91. https://www.ncbi.nlm.nih.gov/pubmed/21747015. Accessed September 22, 2017.

The DASH-Sodium trial was a clinical trial which evaluated the effects of a specified eating plan with or without reduced sodium intake. The DASH diet is an eating plan that is low in saturated fat, cholesterol, and total fat. Fruits, vegetables, low-fat dairy foods, whole-grain foods, fish, poultry, and nuts are emphasized while red meats, sweets, and sugar-containing beverages are mostly avoided. In this study, people on the low-sodium (1500 milligrams per day) DASH diet had mean systolic blood pressures that were 7.1 mmHg lower than people without hypertension not on the DASH diet. The effect on blood pressure was greatest in participants with hypertension at the beginning of the study who followed the DASH diet. Their systolic blood pressures were, on average, 11.5 mmHg lower than participants with hypertension on the control diet.Sacks, FM, Svetkey LP, et al. Effects on Blood Pressure of Reduced Dietary Sodium and the Dietary Approaches to Stop Hypertension (DASH) Diet. N Engl J Med. 2001; 344(1), 3–10. http://www.ncbi.nlm.nih.gov/pubmed/11136953. Accessed September 22, 2017.

Following the DASH diet not only reduces sodium intake, but also increases potassium, calcium, and magnesium intake. All of these electrolytes have a positive effect on blood pressure, although the mechanisms by which they reduce blood pressure are largely unknown.

While some other large studies have demonstrated little or no significant relationship between sodium intake and blood pressure, the weight of scientific evidence demonstrating low-sodium diets as effective preventative and treatment measures against hypertension led the US government to pass a focus on salt within the Consolidated Appropriations Act of 2008. A part of this act tasked the CDC, under guidance from the IOM, to make recommendations for Americans to reduce dietary sodium intake. This task is ongoing and involves “studying government approaches (regulatory and legislative actions), food supply approaches (new product development, food reformulation), and information/education strategies for the public and professionals.”Henney JE, Taylor CL, Boon CS. Strategies to Reduce Sodium Intake in the United States, by Committee on Strategies to Reduce Sodium Intake, Institute of Medicine. Washington, D.C.: National Academies Press; 2010. http://www.nap.edu/openbook.php?record_id=12818&page= 19#p2001bcf59960019001. Accessed September 22, 2017.

Try for Yourself

The National Heart, Lung, and Blood Institute has prepared an informative fact sheet on the DASH diet: http://www.nhlbi.nih.gov/health/public/heart/hbp/dash/new_dash.pdf.
Use the food-group charts to help design a daily menu that follows the DASH eating plan.

Cover of guide to lowering blood pressure

Salt Sensitivity

High dietary intake of sodium is one risk factor for hypertension and contributes to high blood pressure in many people. However, studies have shown that not everyone’s blood pressure is affected by lowering sodium intake. About 10 to 20 percent of the population is considered to be salt-sensitive, meaning their blood pressure is affected by salt intake. Genetics, race, gender, weight, and physical activity level are determinants of salt sensitivity. African Americans, women, and overweight individuals are more salt-sensitive than others. Also, if hypertension runs in a person’s family, that person is more likely to be salt-sensitive. Because reducing dietary salt intake will not work for everyone with hypertension or a risk for developing the condition, there are many opponents of reducing dietary salt intake at the national level. Among such opponents is the Salt Institute, a nonprofit trade organization that states, “No evidence demonstrates that current salt intake levels lead to worse health outcomes such as more heart attacks or higher cardiovascular mortality.”Salt and Health. The Salt Institute. http://www.saltinstitute.org/Issues-in-focus/Food-salt-health. Updated 2011. Accessed October 2, 2011.

Water Concerns

At this point you have learned how critical water is to support human life, how it is distributed and moved in the body, how fluid balance and composition is maintained, and the recommended amount of fluids a person should consume daily. In America you have a choice of thousands of different beverages. Which should you choose to receive the most health benefit and achieve your recommended fluid intake?

Reading the Label

Most beverages marketed in the United States have a Nutrition Facts panel and ingredients list, but some, such as coffee (for home consumption), beer, and wine, do not. As with foods, beverages that are nutrient-dense are the better choices, with the exception of plain water, which contains few to no other nutrients. Beverages do not make you full; they satiate your thirst. Therefore, the fewer calories in a beverage the better it is for avoiding weight gain. For an estimate of kilocalories in various beverages see Table 3.9 “Calories in Various Beverages”.

Table 3.9 Calories in Various Beverages

Beverage Serving Size (oz) Kilocalories
Soda 12.0 124–189
Bottled sweet tea 12.0 129–143
Orange juice 12.0 157–168
Tomato/vegetable juice 12.0 80
Whole milk 12.0 220
Nonfat milk 12.0 125
Soy milk 12.0 147–191
Coffee, black 12.0 0–4
Coffee, with cream 12.0 39–43
Caffe latte, whole milk 12.0 200
Sports drink 12.0 94
Beer 12.0 153
White wine 5.0 122

Beverage Consumption in the United States

According to the Beverage Marketing Corporation, in the United States in 2010 Americans consumed 29,325 millions of gallons of refreshment beverages including soft drinks, coffee, tea, sports drinks, energy drinks, fruit drinks, and bottled water.US Liquid Refreshment Beverage Market Increased by 1.2% in 2010, Beverage Marketing Corporation Reports. Beverage Marketing Corporation. http://www.beveragemarketing.com/?section=pressreleases. Published 2010. Accessed March 17, 2011.

As in the past, carbonated soft drinks remained the largest category of consumed beverages. In recent decades total caloric consumption has increased in the United States and is largely attributed to increased consumption of snacks and caloric beverages. People between the ages of nineteen and thirty-nine obtain 10 percent of their total energy intake from soft drinks.Beverage Intake in the United States.The Beverage Panel, University of North Carolina, Chapel Hill. http://www.cpc.unc.edu/projects/beverage. Accessed October 2, 2011. (See Figure 6.8 "Percentage of Daily Caloric Intake from Beverage Groups".)

In all age groups the consumption of total beverages provides, on average, 21 percent of daily caloric intake. This is 7 percent higher than the IOM acceptable caloric intake from beverages. Moreover, the high intakes of soft drinks and sugary beverages displace the intake of more nutrient-dense beverages, such as low-fat milk.

Scientific studies have demonstrated that while all beverages are capable of satisfying thirst they do not make you feel full, or satiated. This means that drinking a calorie-containing beverage with a meal only provides more calories, as it won’t be offset by eating less food. The Beverage Panel of the University of North Carolina, Chapel Hill has taken on the challenge of scientifically evaluating the health benefits and risks of beverage groups and providing recommendations for beverage groups (Table 3.10 “Recommendations of the Beverage Panel”). In regards to soft drinks and fruit drinks, The Beverage Panel states that they increase energy intake, are not satiating, and that there is little if any reduction in other foods to compensate for the excess calories. All of these factors contribute to increased energy intake and obesity.US Liquid Refreshment Beverage Market Increased by 1.2% in 2010, Beverage Marketing Corporation Reports.Beverage Marketing Corporation. http://www.beveragemarketing.com/?section=pressreleases. Accessed March 17, 2011.

The Beverage Panel recommends an even lower intake of calories from beverages than IOM—10 percent or less of total caloric intake.

Table 3.10 Recommendations of the Beverage Panel

Beverage Servings per day*
Water ≥ 4 (women), ≥ 6 (men)
Unsweetened coffee and tea ≤ 8 for tea, ≤ 4 for coffee
Nonfat and low-fat milk; fortified soy drinks ≤ 2
Diet beverages with sugar substitutes ≤ 4
100 percent fruit juices, whole milk, sports drinks ≤ 1
Calorie-rich beverages without nutrients ≤ 1, less if trying to lose weight
*One serving is eight ounces.

Source: Beverage Panel Recommendations and Analysis. University of North Carolina, Chapel Hill. US Beverage Guidance Council. http://www.cpc.unc.edu/projects/nutrans/policy/beverage/us-beverage-panel. Accessed November 6, 2012.

Sources of Drinking Water

The Beverage Panel recommends that women drink at least 32 ounces and men drink at least 48 ounces of water daily. In 1974, the US federal government enacted The Safe Drinking Water Act with the intention of providing the American public with safe drinking water. This act requires the Environmental Protection Agency (EPA) to set water-quality standards and assure that the 150,000-plus public water systems in the country adhere to the standards. About 15 percent of Americans obtain drinking water from private wells, which are not subject to EPA standards.
Producing water safe for drinking involves some or all of the following processes: screening out large objects, removing excess calcium carbonate from hard water sources, flocculation, which adds a precipitating agent to remove solid particles, clarification, sedimentation, filtration, and disinfection. These processes aim to remove unhealthy substances and produce high-quality, colorless, odorless, good-tasting water.
Most drinking water is disinfected by the process of chlorination, which involves adding chlorine compounds to the water. Chlorination is cheap and effective at killing bacteria. However, it is less effective at removing protozoa, such as Giardia lamblia. Chlorine-resistant protozoa and viruses are instead removed by extensive filtration methods. In the decades immediately following the implementation of water chlorination and disinfection methods in this country, waterborne illnesses, such as cholera and typhoid fever, essentially disappeared in the United States (Figure 3.12 “Deadly Water-borne Illnesses In United States”). In fact, the treatment of drinking water is touted as one of the top public-health achievements of the last century.

Figure 3.12 Deadly Water-borne Illnesses In United States

Graph showing decline in water-borne illnesses in the U.S.

Deadly water-borne illnesses decreased to almost nonexistent levels in the United States after the implementation of water disinfection methods.

Source: Image credit Robert Tauxe.
Drinking Water Week. Centers for Disease Control and Prevention. http://www.cdc.gov/features/drinkingwater/graph.html. Updated May 17, 2012. Aceessed September 22, 2017.

Chlorine reaction with inadequately filtered water can result in the formation of potentially harmful substances. Some of these chlorinated compounds, when present at extremely high levels, have been shown to cause cancer in studies conducted in rodents. In addition to many other contaminants, the EPA has set maximum contaminant levels (legal threshold limits) for these chlorinated compounds in water, in order to guard against disease risk. The oversight of public water systems in this country is not perfect and water-borne illnesses are significantly underreported; however, there are far fewer cases of water-borne illnesses than those attributed to food-borne illnesses that have occurred in the recent past.

IV

Chapter 4. Carbohydrates

Introduction

E ʻai i ka mea i loaʻa

What you have, eat


Two Breadfruit by Michael Coghlan / CC BY-SA 2.0

Learning Objectives

By the end of this chapter, you will be able to:

  • Describe the different types of simple and complex carbohydrates
  • Describe the process of carbohydrate digestion and absorption
  • Describe the functions of carbohydrates in the body
  • Describe the body’s carbohydrate needs and how personal choices can lead to health benefits or consequences

Throughout history, carbohydrates have and continue to be a major source of people’s diets worldwide. In ancient Hawai‘i the Hawaiians obtained the majority of their calories from carbohydrate rich plants like the ‘uala (sweet potato), ulu (breadfruit) and kalo (taro). For example, mashed kalo or poi was a staple to meals for Hawaiians. Research suggests that almost 78 percent of the diet was made up of these fiber rich carbohydrate foods.Fujita R, Braun KL, Hughes CK. The traditional Hawaiian diet: a review of the literature. Pacific Health Dialog. 2004; 11(2). http://pacifichealthdialog.org.fj/Volume2011/no2/PHD1120220p2162022120Yamada20orig.pdf. Accessed October 19, 2017.

Carbohydrates are the perfect nutrient to meet your body’s nutritional needs. They nourish your brain and nervous system, provide energy to all of your cells when within proper caloric limits, and help keep your body fit and lean. Specifically, digestible carbohydrates provide bulk in foods, vitamins, and minerals, while indigestible carbohydrates provide a good amount of fiber with a host of other health benefits.

Plants synthesize the fast-releasing carbohydrate, glucose, from carbon dioxide in the air and water, and by harnessing the sun’s energy. Recall that plants convert the energy in sunlight to chemical energy in the molecule, glucose. Plants use glucose to make other larger, more slow-releasing carbohydrates. When we eat plants we harvest the energy of glucose to support life’s processes.

Figure 4.1 Carbohydrate Classification Scheme

Carbohydrates are broken down into the subgroups simple and complex carbohydrates. These subgroups are further categorized into mono-, di-, and polysaccharides.

Carbohydrates are a group of organic compounds containing a ratio of one carbon atom to two hydrogen atoms to one oxygen atom. Basically, they are hydrated carbons. The word “carbo” means carbon and “hydrate” means water. Glucose, the most abundant carbohydrate in the human body, has six carbon atoms, twelve hydrogen atoms, and six oxygen atoms. The chemical formula for glucose is written as C6H12O6. Synonymous with the term carbohydrate is the Greek word “saccharide,” which means sugar. The simplest unit of a carbohydrate is a monosaccharide. Carbohydrates are broadly classified into two subgroups, simple (“fast-releasing”) and complex (“slow-releasing”). Simple carbohydrates are further grouped into the monosaccharides and disaccharides. Complex carbohydrates are long chains of monosaccharides.

Simple/Fast-Releasing Carbohydrates

Simple carbohydrates are also known more simply as “sugars” and are grouped as either monosaccharides or disaccharides. Monosaccharides include glucose, fructose, and galactose, and the disaccharides include lactose, maltose, and sucrose.

Simple carbohydrates stimulate the sweetness taste sensation, which is the most sensitive of all taste sensations. Even extremely low concentrations of sugars in foods will stimulate the sweetness taste sensation. Sweetness varies between the different carbohydrate types—some are much sweeter than others. Fructose is the top naturally-occurring sugar in sweetness value.

Monosaccharides

For all organisms from bacteria to plants to animals, glucose is the preferred fuel source. The brain is completely dependent on glucose as its energy source (except during extreme starvation conditions). The monosaccharide galactose differs from glucose only in that a hydroxyl (−OH) group faces in a different direction on the number four carbon (Figure 4.2 “Structures of the Three Most Common Monosaccharides: Glucose, Galactose, and Fructose”). This small structural alteration causes galactose to be less stable than glucose. As a result, the liver rapidly converts it to glucose. Most absorbed galactose is utilized for energy production in cells after its conversion to glucose. (Galactose is one of two simple sugars that are bound together to make up the sugar found in milk. It is later freed during the digestion process.)

Fructose also has the same chemical formula as glucose but differs in its chemical structure, as the ring structure contains only five carbons and not six. Fructose, in contrast to glucose, is not an energy source for other cells in the body. Mostly found in fruits, honey, and sugarcane, fructose is one of the most common monosaccharides in nature. It is also found in soft drinks, cereals, and other products sweetened with high fructose corn syrup.

Figure 4.2 Structures of the Three Most Common Monosaccharides: Glucose, Galactose, and Fructose

Circles indicate the structural differences between the three.

Pentoses are less common monosaccharides which have only five carbons and not six. The pentoses are abundant in the nucleic acids RNA and DNA, and also as components of fiber.

Lastly, there are the sugar alcohols, which are industrially synthesized derivatives of monosaccharides. Some examples of sugar alcohols are sorbitol, xylitol, and glycerol. (Xylitol is similar in sweetness as table sugar). Sugar alcohols are often used in place of table sugar to sweeten foods as they are incompletely digested and absorbed, and therefore less caloric. The bacteria in your mouth opposes them, hence sugar alcohols do not cause tooth decay. Interestingly, the sensation of “coolness” that occurs when chewing gum that contains sugar alcohols comes from them dissolving in the mouth, a chemical reaction that requires heat from the inside of the mouth.

Disaccharides

Disaccharides are composed of pairs of two monosaccharides linked together. Disaccharides include sucrose, lactose, and maltose. All of the disaccharides contain at least one glucose molecule.

Sucrose, which contains both glucose and fructose molecules, is otherwise known as table sugar. Sucrose is also found in many fruits and vegetables, and at high concentrations in sugar beets and sugarcane, which are used to make table sugar. Lactose, which is commonly known as milk sugar, is composed of one glucose unit and one galactose unit. Lactose is prevalent in dairy products such as milk, yogurt, and cheese. Maltose consists of two glucose molecules bonded together. It is a common breakdown product of plant starches and is rarely found in foods as a disaccharide.

Figure 4.3 The Most Common Disaccharides

Complex/Slow-Releasing Carbohydrates

Complex carbohydrates are polysaccharides, long chains of monosaccharides that may be branched or not branched. There are two main groups of polysaccharides: starches and fibers.

Starches

Starch molecules are found in abundance in grains, legumes, and root vegetables, such as potatoes. Amylose, a plant starch, is a linear chain containing hundreds of glucose units. Amylopectin, another plant starch, is a branched chain containing thousands of glucose units. These large starch molecules form crystals and are the energy-storing molecules of plants. These two starch molecules (amylose and amylopectin) are contained together in foods, but the smaller one, amylose, is less abundant. Eating raw foods containing starches provides very little energy as the digestive system has a hard time breaking them down. Cooking breaks down the crystal structure of starches, making them much easier to break down in the human body. The starches that remain intact throughout digestion are called resistant starches. Bacteria in the gut can break some of these down and may benefit gastrointestinal health. Isolated and modified starches are used widely in the food industry and during cooking as food thickeners.

Figure 4.4 Structures of the Plant Starches and Glycogen

Humans and animals store glucose energy from starches in the form of the very large molecule, glycogen. It has many branches that allow it to break down quickly when energy is needed by cells in the body. It is predominantly found in liver and muscle tissue in animals.

Dietary Fibers

Dietary fibers are polysaccharides that are highly branched and cross-linked. Some dietary fibers are pectin, gums, cellulose, hemicellulose, and lignin. Lignin, however, is not composed of carbohydrate units. Humans do not produce the enzymes that can break down dietary fiber; however, bacteria in the large intestine (colon) do. Dietary fibers are very beneficial to our health. The Dietary Guidelines Advisory Committee states that there is enough scientific evidence to support that diets high in fiber reduce the risk for obesity and diabetes, which are primary risk factors for cardiovascular disease.US Department of Agriculture. Part D. Section 5: Carbohydrates. In Report of the DGAC on the Dietary Guidelines for Americans, 2010. http://www.cnpp.usda.gov/Publications/DietaryGuidelines/2010/DGAC/Report/D-5-Carbohydrates.pdf. Accessed September 30, 2011.

Dietary fiber is categorized as either water-soluble or insoluble. Some examples of soluble fibers are inulin, pectin, and guar gum and they are found in peas, beans, oats, barley, and rye. Cellulose and lignin are insoluble fibers and a few dietary sources of them are whole-grain foods, flax, cauliflower, and avocados. Cellulose is the most abundant fiber in plants, making up the cell walls and providing structure. Soluble fibers are more easily accessible to bacterial enzymes in the large intestine so they can be broken down to a greater extent than insoluble fibers, but even some breakdown of cellulose and other insoluble fibers occurs.

The last class of fiber is functional fiber. Functional fibers have been added to foods and have been shown to provide health benefits to humans. Functional fibers may be extracted from plants and purified or synthetically made. An example of a functional fiber is psyllium-seed husk. Scientific studies show that consuming psyllium-seed husk reduces blood-cholesterol levels and this health claim has been approved by the FDA. Total dietary fiber intake is the sum of dietary fiber and functional fiber consumed.

Figure 4.5 Dietary Fiber

Digestion and Absorption of Carbohydrates

From the Mouth to the Stomach

The mechanical and chemical digestion of carbohydrates begins in the mouth. Chewing, also known as mastication, crumbles the carbohydrate foods into smaller and smaller pieces. The salivary glands in the oral cavity secrete saliva that coats the food particles. Saliva contains the enzyme, salivary amylase. This enzyme breaks the bonds between the monomeric sugar units of disaccharides, oligosaccharides, and starches. The salivary amylase breaks down amylose and amylopectin into smaller chains of glucose, called dextrins and maltose. The increased concentration of maltose in the mouth that results from the mechanical and chemical breakdown of starches in whole grains is what enhances their sweetness. Only about five percent of starches are broken down in the mouth. (This is a good thing as more glucose in the mouth would lead to more tooth decay.) When carbohydrates reach the stomach no further chemical breakdown occurs because the amylase enzyme does not function in the acidic conditions of the stomach. But mechanical breakdown is ongoing—the strong peristaltic contractions of the stomach mix the carbohydrates into the more uniform mixture of chyme.

Figure 4.6 Salivary Glands in the Mouth

Salivary glands secrete salivary amylase, which begins the chemical breakdown of carbohydrates by breaking the bonds between monomeric sugar units.

From the Stomach to the Small Intestine

The chyme is gradually expelled into the upper part of the small intestine. Upon entry of the chyme into the small intestine, the pancreas releases pancreatic juice through a duct. This pancreatic juice contains the enzyme, pancreatic amylase, which starts again the breakdown of dextrins into shorter and shorter carbohydrate chains. Additionally, enzymes are secreted by the intestinal cells that line the villi. These enzymes, known collectively as disaccharidase, are sucrase, maltase, and lactase. Sucrase breaks sucrose into glucose and fructose molecules. Maltase breaks the bond between the two glucose units of maltose, and lactase breaks the bond between galactose and glucose. Once carbohydrates are chemically broken down into single sugar units they are then transported into the inside of intestinal cells.

When people do not have enough of the enzyme lactase, lactose is not sufficiently broken down resulting in a condition called lactose intolerance. The undigested lactose moves to the large intestine where bacteria are able to digest it. The bacterial digestion of lactose produces gases leading to symptoms of diarrhea, bloating, and abdominal cramps. Lactose intolerance usually occurs in adults and is associated with race. The National Digestive Diseases Information Clearing House states that African Americans, Hispanic Americans, American Indians, and Asian Americans have much higher incidences of lactose intolerance while those of northern European descent have the least.Lactose Intolerance. National Digestive Diseases Information Clearing House. http://digestive.niddk.nih.gov/ddiseases/pubs/lactoseintolerance/. Updated April 23, 2012. Accessed September 22, 2017. Most people with lactose intolerance can tolerate some amount of dairy products in their diet. The severity of the symptoms depends on how much lactose is consumed and the degree of lactase deficiency.

Absorption: Going to the Blood Stream

The cells in the small intestine have membranes that contain many transport proteins in order to get the monosaccharides and other nutrients into the blood where they can be distributed to the rest of the body. The first organ to receive glucose, fructose, and galactose is the liver. The liver takes them up and converts galactose to glucose, breaks fructose into even smaller carbon-containing units, and either stores glucose as glycogen or exports it back to the blood. How much glucose the liver exports to the blood is under hormonal control and you will soon discover that even the glucose itself regulates its concentrations in the blood.

Figure 4.7 Carbohydrate Digestion

Carbohydrate digestion begins in the mouth and is most extensive in the small intestine. The resultant monosaccharides are absorbed into the bloodstream and transported to the liver.

Maintaining Blood Glucose Levels: The Pancreas and Liver

Glucose levels in the blood are tightly controlled, as having either too much or too little glucose in the blood can have health consequences. Glucose regulates its levels in the blood via a process called negative feedback. An everyday example of negative feedback is in your oven because it contains a thermostat. When you set the temperature to cook a delicious homemade noodle casserole at 375°F the thermostat senses the temperature and sends an electrical signal to turn the elements on and heat up the oven. When the temperature reaches 375°F the thermostat senses the temperature and sends a signal to turn the element off. Similarly, your body senses blood glucose levels and maintains the glucose “temperature” in the target range. The glucose thermostat is located within the cells of the pancreas. After eating a meal containing carbohydrates glucose levels rise in the blood.

Insulin-secreting cells in the pancreas sense the increase in blood glucose and release the hormone, insulin, into the blood. Insulin sends a signal to the body’s cells to remove glucose from the blood by transporting it into different organ cells around the body and using it to make energy. In the case of muscle tissue and the liver, insulin sends the biological message to store glucose away as glycogen. The presence of insulin in the blood signifies to the body that glucose is available for fuel. As glucose is transported into the cells around the body, the blood glucose levels decrease. Insulin has an opposing hormone called glucagon. Glucagon-secreting cells in the pancreas sense the drop in glucose and, in response, release glucagon into the blood. Glucagon communicates to the cells in the body to stop using all the glucose. More specifically, it signals the liver to break down glycogen and release the stored glucose into the blood, so that glucose levels stay within the target range and all cells get the needed fuel to function properly.

Figure 4.8 The Regulation of Glucose

Leftover Carbohydrates: The Large Intestine

Almost all of the carbohydrates, except for dietary fiber and resistant starches, are efficiently digested and absorbed into the body. Some of the remaining indigestible carbohydrates are broken down by enzymes released by bacteria in the large intestine. The products of bacterial digestion of these slow-releasing carbohydrates are short-chain fatty acids and some gases. The short-chain fatty acids are either used by the bacteria to make energy and grow, are eliminated in the feces, or are absorbed into cells of the colon, with a small amount being transported to the liver. Colonic cells use the short-chain fatty acids to support some of their functions. The liver can also metabolize the short-chain fatty acids into cellular energy. The yield of energy from dietary fiber is about 2 kilocalories per gram for humans, but is highly dependent upon the fiber type, with soluble fibers and resistant starches yielding more energy than insoluble fibers. Since dietary fiber is digested much less in the gastrointestinal tract than other carbohydrate types (simple sugars, many starches) the rise in blood glucose after eating them is less, and slower. These physiological attributes of high-fiber foods (i.e. whole grains) are linked to a decrease in weight gain and reduced risk of chronic diseases, such as Type 2 diabetes and cardiovascular disease.

Figure 4.9 Overview of Carbohydrate Digestion

A Carbohydrate Feast

You are at a your grandma’s house for family dinner and you just consumed kalua pig, white rice, sweet potatoes, mac salad, chicken long rice and a hot sweet bread roll dripping with butter. Less than an hour later you top it off with a slice of haupia pie and then lie down on the couch to watch TV. The “hormone of plenty,” insulin, answers the nutrient call. Insulin sends out the physiological message that glucose is abundant in the blood, so that cells can absorb it and either use it or store it. The result of this hormone message is maximization of glycogen stores and all the excess glucose, protein, and lipids are stored as fat.

Dishes of rice, vegetables, and other foods

A typical American Thanksgiving meal contains many foods that are dense in carbohydrates, with the majority of those being simple sugars and starches. These types of carbohydrate foods are rapidly digested and absorbed. Blood glucose levels rise quickly causing a spike in insulin levels. Contrastingly, foods containing high amounts of fiber are like time-release capsules of sugar. A measurement of the effects of a carbohydrate-containing food on blood-glucose levels is called the glycemic response.

Glycemic Index

The glycemic responses of various foods have been measured and then ranked in comparison to a reference food, usually a slice of white bread or just straight glucose, to create a numeric value called the glycemic index (GI). Foods that have a low GI do not raise blood-glucose levels neither as much nor as fast as foods that have a higher GI. A diet of low-GI foods has been shown in epidemiological and clinical trial studies to increase weight loss and reduce the risk of obesity, Type 2 diabetes, and cardiovascular disease.Brand-Miller J, et al. Dietary Glycemic Index: Health Implications. J Am Coll Nutr. 2009; 28(4), 446S–49S.https://www.ncbi.nlm.nih.gov/pubmed/20234031. Accessed September 27, 2017.

Table 4.1 The Glycemic Index: Foods In Comparison To Glucose

Foods GI Value
Low GI Foods (< 55)
Apple, raw 36
Orange, raw 43
Banana, raw 51
Mango, raw 51
Carrots, boiled 39
Taro, boiled 53
Corn tortilla 46
Spaghetti (whole wheat) 37
Baked beans 48
Soy milk 34
Skim milk 37
Whole milk 39
Yogurt, fruit 41
Yogurt, plain 14
Icecream 51
Medium GI Foods (56–69)
Pineapple, raw 59
Cantaloupe 65
Mashed potatoes 70
Whole-wheat bread 69
Brown rice 55
Cheese pizza 60
Sweet potato, boiled 63
Macaroni and cheese 64
Popcorn 65
High GI Foods (70 and higher)
Banana (over-ripe) 82
Corn chips 72
Pretzels 83
White bread 70
White rice 72
Bagel 72
Rice milk 86
Cheerios 74
Raisin Bran 73
Fruit roll-up 99
Gatorade 78

For the Glycemic Index on different foods, visit http://www.mendosa.com/gilists.htm.

The type of carbohydrate within a food affects the GI along with its fat and fiber content. Increased fat and fiber in foods increases the time required for digestion and delays the rate of gastric emptying into the small intestine which, ultimately reduces the GI. Processing and cooking also affects a food’s GI by increasing their digestibility. Advancements in the technologies of food processing and the high consumer demand for convenient, precooked foods in the United States has created foods that are digested and absorbed more rapidly, independent of the fiber content. Modern breakfast cereals, breads, pastas, and many prepared foods have a high GI. In contrast, most raw foods have a lower GI. (However, the more ripened a fruit or vegetable is, the higher its GI.)

The GI can be used as a guide for choosing healthier carbohydrate choices but has some limitations. The first is GI does not take into account the amount of carbohydrates in a portion of food, only the type of carbohydrate. Another is that combining low- and high-GI foods changes the GI for the meal. Also, some nutrient-dense foods have higher GIs than less nutritious food. (For instance, oatmeal has a higher GI than chocolate because the fat content of chocolate is higher.) Lastly, meats and fats do not have a GI since they do not contain carbohydrates.

More Resources

Visit this online database to discover the glycemic indices of foods. Foods are listed by category and also by low, medium, or high glycemic index.
http://www.gilisting.com/

The Functions of Carbohydrates in the Body

There are five primary functions of carbohydrates in the human body. They are energy production, energy storage, building macromolecules, sparing protein, and assisting in lipid metabolism.

Energy Production

The primary role of carbohydrates is to supply energy to all cells in the body. Many cells prefer glucose as a source of energy versus other compounds like fatty acids. Some cells, such as red blood cells, are only able to produce cellular energy from glucose. The brain is also highly sensitive to low blood-glucose levels because it uses only glucose to produce energy and function (unless under extreme starvation conditions). About 70 percent of the glucose entering the body from digestion is redistributed (by the liver) back into the blood for use by other tissues. Cells that require energy remove the glucose from the blood with a transport protein in their membranes. The energy from glucose comes from the chemical bonds between the carbon atoms. Sunlight energy was required to produce these high-energy bonds in the process of photosynthesis. Cells in our bodies break these bonds and capture the energy to perform cellular respiration. Cellular respiration is basically a controlled burning of glucose versus an uncontrolled burning. A cell uses many chemical reactions in multiple enzymatic steps to slow the release of energy (no explosion) and more efficiently capture the energy held within the chemical bonds in glucose.

The first stage in the breakdown of glucose is called glycolysis. Glycolysis, or the splitting of glucose, occurs in an intricate series of ten enzymatic-reaction steps. The second stage of glucose breakdown occurs in the energy factory organelles, called mitochondria. One carbon atom and two oxygen atoms are removed, yielding more energy. The energy from these carbon bonds is carried to another area of the mitochondria, making the cellular energy available in a form cells can use.

Figure 4.10 Cellular Respiration

Cellular respiration is the process by which energy is captured from glucose.

Energy Storage

If the body already has enough energy to support its functions, the excess glucose is stored as glycogen (the majority of which is stored in the muscles and liver). A molecule of glycogen may contain in excess of fifty thousand single glucose units and is highly branched, allowing for the rapid dissemination of glucose when it is needed to make cellular energy.

The amount of glycogen in the body at any one time is equivalent to about 4,000 kilocalories—3,000 in muscle tissue and 1,000 in the liver. Prolonged muscle use (such as exercise for longer than a few hours) can deplete the glycogen energy reserve. Remember that this is referred to as “hitting the wall” or “bonking” and is characterized by fatigue and a decrease in exercise performance. The weakening of muscles sets in because it takes longer to transform the chemical energy in fatty acids and proteins to usable energy than glucose. After prolonged exercise, glycogen is gone and muscles must rely more on lipids and proteins as an energy source. Athletes can increase their glycogen reserve modestly by reducing training intensity and increasing their carbohydrate intake to between 60 and 70 percent of total calories three to five days prior to an event. People who are not hardcore training and choose to run a 5-kilometer race for fun do not need to consume a big plate of pasta prior to a race since without long-term intense training the adaptation of increased muscle glycogen will not happen.

The liver, like muscle, can store glucose energy as a glycogen, but in contrast to muscle tissue it will sacrifice its stored glucose energy to other tissues in the body when blood glucose is low. Approximately one-quarter of total body glycogen content is in the liver (which is equivalent to about a four-hour supply of glucose) but this is highly dependent on activity level. The liver uses this glycogen reserve as a way to keep blood-glucose levels within a narrow range between meal times. When the liver’s glycogen supply is exhausted, glucose is made from amino acids obtained from the destruction of proteins in order to maintain metabolic homeostasis.

Building Macromolecules

Although most absorbed glucose is used to make energy, some glucose is converted to ribose and deoxyribose, which are essential building blocks of important macromolecules, such as RNA, DNA, and ATP. Glucose is additionally utilized to make the molecule NADPH, which is important for protection against oxidative stress and is used in many other chemical reactions in the body. If all of the energy, glycogen-storing capacity, and building needs of the body are met, excess glucose can be used to make fat. This is why a diet too high in carbohydrates and calories can add on the fat pounds—a topic that will be discussed shortly.

Figure 4.11 Chemical Structure of Deoxyribose

The sugar molecule deoxyribose is used to build the backbone of DNA. Image by rozeta / CC BY-SA 3.0

Figure 4.12 Double-stranded DNA

Image by Forluvoft / Public Domain

Sparing Protein

In a situation where there is not enough glucose to meet the body’s needs, glucose is synthesized from amino acids. Because there is no storage molecule of amino acids, this process requires the destruction of proteins, primarily from muscle tissue. The presence of adequate glucose basically spares the breakdown of proteins from being used to make glucose needed by the body.

Lipid Metabolism

As blood-glucose levels rise, the use of lipids as an energy source is inhibited. Thus, glucose additionally has a “fat-sparing” effect. This is because an increase in blood glucose stimulates release of the hormone insulin, which tells cells to use glucose (instead of lipids) to make energy. Adequate glucose levels in the blood also prevent the development of ketosis. Ketosis is a metabolic condition resulting from an elevation of ketone bodies in the blood. Ketone bodies are an alternative energy source that cells can use when glucose supply is insufficient, such as during fasting. Ketone bodies are acidic and high elevations in the blood can cause it to become too acidic. This is rare in healthy adults, but can occur in alcoholics, people who are malnourished, and in individuals who have Type 1 diabetes. The minimum amount of carbohydrate in the diet required to inhibit ketosis in adults is 50 grams per day.

Carbohydrates are critical to support life’s most basic function—the production of energy. Without energy none of the other life processes are performed. Although our bodies can synthesize glucose it comes at the cost of protein destruction. As with all nutrients though, carbohydrates are to be consumed in moderation as having too much or too little in the diet may lead to health problems.

Health Consequences and Benefits of High-Carbohydrate Diets

Can America blame its obesity epidemic on the higher consumption of added sugars and refined grains? This is a hotly debated topic by both the scientific community and the general public. In this section, we will give a brief overview of the scientific evidence.

Added Sugars

Figure 4.13 Sugar Consumption (In Teaspoons) From Various Sources

The Food and Nutrition Board of the Institute of Medicine (IOM) defines added sugars as “sugars and syrups that are added to foods during processing or preparation.” The IOM goes on to state, “Major sources of added sugars include soft drinks, sports drinks, cakes, cookies, pies, fruitades, fruit punch, dairy desserts, and candy.” Processed foods, even microwaveable dinners, also contain added sugars. Added sugars do not include sugars that occur naturally in whole foods (such as an apple), but do include natural sugars such as brown sugar, corn syrup, dextrose, fructose, fruit juice concentrates, maple syrup, sucrose, and raw sugar that are then added to create other foods (such as cookies). Results from a survey of forty-two thousand Americans reports that in 2008 the average intake of added sugars is 15 percent of total calories, a drop from 18 percent of total calories in 2000.Welsh JA, Sharma AJ, et al. Consumption of Added Sugars Is Decreasing in the United States. Am J Clin Nutr. 2011; 94(3), 726–34. http://www.ncbi.nlm.nih.gov/pubmed/21753067. Accessed September 22, 2017.

This is still above the recommended intake of less than 10 percent of total calories. The US Department of Agriculture (USDA) reports that sugar consumption in the American diet in 2008 was, on average, 28 teaspoons per day (Figure 4.13 “Sugar Consumption (in Teaspoons) from Various Sources”).

Obesity, Diabetes, and Heart Disease and Their Hypothesized Link to Excessive Sugar and Refined Carbohydrate Consumption

To understand the magnitude of the health problem in the United States consider this—in the United States approximately 130 million adults are overweight, and 30 percent of them are considered obese. The obesity epidemic has reached young adults and children and will markedly affect the prevalence of serious health consequences in adulthood. Health consequences linked to being overweight or obese include Type 2 diabetes, cardiovascular disease, arthritis, depression, and some cancers. An infatuation with sugary foods and refined grains likely contributes to the epidemic proportion of people who are overweight or obese in this country, but so do the consumption of high-calorie foods that contain too much saturated fat and the sedentary lifestyle of most Americans. There is much disagreement over whether high-carbohydrate diets increase weight-gain and disease risk, especially when calories are not significantly higher between compared diets. Many scientific studies demonstrate positive correlations between diets high in added sugars with weight gain and disease risk, but some others do not show a significant relationship. In regard to refined grains, there are no studies that show consumption of refined grains increases weight gain or disease risk. What is clear, however, is that getting more of your carbohydrates from dietary sources containing whole grains instead of refined grains stimulates weight loss and reduces disease risk.

A major source of added sugars in the American diet is soft drinks. There is consistent scientific evidence that consuming sugary soft drinks increases weight gain and disease risk. An analysis of over thirty studies in the American Journal of Clinical Nutrition concluded that there is much evidence to indicate higher consumption of sugar-sweetened beverages is linked with weight gain and obesity.Malik VS, Schulze MB, Hu FB. Intake of Sugar-Sweetened Beverages and Weight Gain: A Systematic Review. Am J Clin Nutr. 2006; 84(2), 274–88. http://www.ajcn.org/content/84/2/274.long. Accessed September 22, 2017. A study at the Harvard School of Public Health linked the consumption of sugary soft drinks to an increased risk for heart disease.Public Health Takes Aim at Sugar and Salt. Harvard School of Public Health. https://www.hsph.harvard.edu/news/magazine/sugar-and-salt/. Published 2009. Accessed September 30, 2017.

While the sugar and refined grains and weight debate rages on, the results of all of these studies has led some public health organizations like the American Heart Association (AHA) to recommend even a lower intake of sugar per day (fewer than 9 teaspoons per day for men and fewer than 6 teaspoons for women) than what used to be deemed acceptable. After its 2010 scientific conference on added sugars, the AHA made the following related dietary recommendationsVan Horn L, Johnson RK, et al.Translation and Implementation of Added Sugars Consumption Recommendations. Circulation. 2010; 122, 2470–90.http://circ.ahajournals.org/content/122/23/2470/tab-supplemental. Accessed September 27, 2017.:

The Most Notorious Sugar

Before high-fructose corn syrup (HFCS) was marketed as the best food and beverage sweetener, sucrose (table sugar) was the number-one sweetener in America. (Recall that sucrose, or table sugar, is a disaccharide consisting of one glucose unit and one fructose unit.) HFCS also contains the simple sugars fructose and glucose, but with fructose at a slightly higher concentration. In the production of HFCS, corn starch is broken down to glucose, and some of the glucose is then converted to fructose. Fructose is sweeter than glucose; hence many food manufacturers choose to sweeten foods with HFCS. HFCS is used as a sweetener for carbonated beverages, condiments, cereals, and a great variety of other processed foods.

Some scientists, public health personnel, and healthcare providers believe that fructose is the cause of the obesity epidemic and its associated health consequences. The majority of their evidence stems from the observation that since the early 1970s the number of overweight or obese Americans has dramatically increased and so has the consumption of foods containing HFCS. However, as discussed, so has the consumption of added sugars in general. Animal studies that fuel the fructose opponents show fructose is not used to produce energy in the body; instead it is mostly converted to fat in the liver—potentially contributing to insulin resistance and the development of Type 2 diabetes. Additionally, fructose does not stimulate the release of certain appetite-suppressing hormones, like insulin, as glucose does. Thus, a diet high in fructose could potentially stimulate fat deposition and weight gain.

In human studies, excessive fructose intake has sometimes been associated with weight gain, but results are inconsistent. Moderate fructose intake is not associated with weight gain at all. Moreover, other studies show that some fructose in the diet actually improves glucose metabolism especially in people with Type 2 diabetes.Elliott SS, Keim NL, et al. Fructose, Weight Gain, and the Insulin Resistance Syndrome. Am J Clin Nutr. 2002; 76(5),911–22. http://www.ajcn.org/content/76/5/911.full. Accessed September 27, 2017.

In fact, people with diabetes were once advised to use fructose as an alternative sweetener to table sugar. Overall, there is no good evidence that moderate fructose consumption contributes to weight gain and chronic disease. At this time conclusive evidence is not available on whether fructose is any worse than any other added sugar in increasing the risk for obesity, Type 2 diabetes, and cardiovascular disease.

Do Low-Carbohydrate Diets Affect Health?

Since the early 1990s, marketers of low-carbohydrate diets have bombarded us with the idea that eating fewer carbohydrates promotes weight loss and that these diets are superior to others in their effects on weight loss and overall health. The most famous of these low-carbohydrate diets is the Atkins diet. Others include the “South Beach” diet, the “Zone” diet, and the “Earth” diet. Despite the claims these diets make, there is little scientific evidence to support that low-carbohydrate diets are significantly better than other diets in promoting long-term weight loss. A study in The Nutritional Journal concluded that all diets, (independent of carbohydrate, fat, and protein content) that incorporated an exercise regimen significantly decreased weight and waist circumference in obese women.Kerksick CM, Wismann-Bunn J, et al. Changes in Weight Loss, Body Composition, and Cardiovascular Disease Risk after Altering Macronutrient Distributions During a Regular Exercise Program in Obese Women. J Nutr. 2010; 9(59). https://www.ncbi.nlm.nih.gov/pmc/articles/PMC3000832/ . Accessed September 27, 2017.

Some studies do provide evidence that in comparison to other diets, low-carbohydrate diets improve insulin levels and other risk factors for Type 2 diabetes and cardiovascular disease. The overall scientific consensus is that consuming fewer calories in a balanced diet will promote health and stimulate weight loss, with significantly better results achieved when combined with regular exercise.

Health Benefits of Whole Grains in the Diet

While excessive consumption of simple carbohydrates is potentially bad for your health, consuming more complex carbohydrates is extremely beneficial to health. There is a wealth of scientific evidence supporting that replacing refined grains with whole grains decreases the risk for obesity, Type 2 diabetes, and cardiovascular disease. Whole grains are great dietary sources of fiber, vitamins, minerals, healthy fats, and a vast amount of beneficial plant chemicals, all of which contribute to the effects of whole grains on health. Eating a high-fiber meal as compared to a low-fiber meal (see Figure 4.14 “Fibers Role in Carbohydrate Digestion and Absorption”) can significantly slow down the absorption process therefore affecting blood glucose levels.  Americans typically do not consume the recommended amount of whole grains, which is 50 percent or more of grains from whole grains.

Figure 4.14 Fibers Role in Carbohydrate Digestion and Absorption

Diets high in whole grains have repeatedly been shown to decrease weight. A large group of studies all support that consuming more than two servings of whole grains per day reduces one’s chances of getting Type 2 diabetes by 21 percent.de Munter JS, Hu FB, et al. Whole Grain, Bran, and Germ Intake and Risk of Type 2 Diabetes: A Prospective Cohort Study and Systematic Review. PLoS Medicine. 2007; 4(8), e261. https://www.ncbi.nlm.nih.gov/pubmed/17760498. Accessed September 27, 2017. The Nurses’ Health Study found that women who consumed two to three servings of whole grain products daily were 30 percent less likely to have a heart attack.Liu S, Stampfer MJ, et al. Whole-Grain Consumption and Risk of Coronary Heart Disease: Results from the Nurses’ Health Study. Am J Clin Nutr. 1999; 70(3), 412–19. http://www.ajcn.org/content/70/3/412.long. Accessed September 27, 2017.

The AHA makes the following statements on whole grainsWhole Grains and Fiber. American Heart Association. http://www.heart.org/HEARTORG/GettingHealthy/NutritionCenter/HealthyDietGoals/Whole-Grains-and-Fiber_UCM_303249_Article.jsp. Updated 2017. Accessed September 30, 2017.:

Figure 4.15 Grain Consumption Statistics in America

Source: Economic Research Service. http://www.ers.usda.gov/data-products/commodity-consumption-by-population-characteristics/documentation.aspx.

Carbohydrates and Personal Diet Choices

In this chapter, you learned what carbohydrates are, the different types of carbohydrates in your diet, and that excess consumption of some types of carbohydrates cause disease while others decrease disease risk. Now that we know the benefits of eating the right carbohydrate, we will examine exactly how much should be eaten to promote health and prevent disease.

How Many Carbohydrates Does a Person Need?

The Food and Nutrition Board of IOM has set the Recommended Dietary Allowance (RDA) of carbohydrates for children and adults at 130 grams per day. This is the average minimum amount the brain requires to function properly. The Acceptable Macronutrient Distribution Range (AMDR) for carbohydrates is between 45 and 65 percent of your total caloric daily intake. This means that on a 2,000 kilocalorie diet, a person should consume between 225 and 325 grams of carbohydrate each day. According to the IOM not more than 25 percent of total calories consumed should come from added sugars. The World Health Organization and the AHA recommend much lower intakes of added sugars—10 percent or less of total calories consumed. The IOM has also set Adequate Intakes for dietary fiber, which are 38 and 25 grams for men and women, respectively. The recommendations for dietary fiber are based upon the intake levels known to prevent against heart disease.

Table 4.2 Dietary Reference Intakes For Carbohydrates And Fiber

Carbohydrate Type RDA (g/day) AMDR (% calories)
Total Carbohydrates 130 45–65
Added Sugars < 25
Fiber 38 (men),* 25 (women)*
* denotes Adequate Intake

Dietary Sources of Carbohydrates

Carbohydrates are contained in all five food groups: grains, fruits, vegetables, meats, beans (only in some processed meats and beans), and dairy products. Fast-releasing carbohydrates are more prevalent in fruits, fruit juices, and dairy products, while slow-releasing carbohydrates are more plentiful in starchy vegetables, beans, and whole grains. Fast-releasing carbohydrates are also found in large amounts in processed foods, soft drinks, and sweets. On average, a serving of fruits, whole grains, or starches contains 15 grams of carbohydrates. A serving of dairy contains about 12 grams of carbohydrates, and a serving of vegetables contains about 5 grams of carbohydrates. Table 4.3 “Carbohydrates in Foods (grams/serving)” gives the specific amounts of carbohydrates, fiber, and added sugar of various foods.

Table 4.3 Carbohydrates in Foods (grams/serving)

Foods Total Carbohydrates Sugars Fiber Added Sugars
Banana 27 (1 medium) 14.40 3.1 0
Lentils 40 (1 c.) 3.50 16.0 0
Snap beans 8.7 (1 c.) 1.60 4.0 0
Green pepper 5.5 (1 medium) 2.90 2.0 0
Corn tortilla 10.7 (1) 0.20 1.5 0
Bread, wheat bran 17.2 (1 slice) 3.50 1.4 3.4
Bread, rye 15.5 (1 slice) 1.20 1.9 1.0
Bagel (plain) 53 (1 medium) 5.30 2.3 4.8
Brownie 36 (1 square) 20.50 1.2 20.0
Oatmeal cookie 22.3 (1 oz.) 12.00 2.0 7.7
Cornflakes 23 (1 c.) 1.50 0.3 1.5
Pretzels 47 (10 twists) 1.30 1.7 0
Popcorn (homemade) 58 (100 g) 0.50 10.0 0
Skim milk 12 (1 c.) 12.00 0 0
Cream (half and half) 0.65 (1 Tbs.) 0.02 0 0
Cream substitute 1.0 (1 tsp.) 1.00 0 1.0
Cheddar cheese 1.3 (1 slice) 0.50 0 0
Yogurt (with fruit) 32.3 (6 oz.) 32.30 0 19.4
Caesar dressing 2.8 (1 Tbs.) 2.80 0 2.4

Sources:

It’s the Whole Nutrient Package

In choosing dietary sources of carbohydrates the best ones are those that are nutrient dense, meaning they contain more essential nutrients per calorie of energy. In general, nutrient-dense carbohydrates are minimally processed and include whole-grain breads and cereals, low-fat dairy products, fruits, vegetables, and beans. In contrast, empty-calorie carbohydrate foods are highly processed and often contain added sugars and fats. Soft drinks, cakes, cookies, and candy are examples of empty-calorie carbohydrates. They are sometimes referred to as ‘bad carbohydrates,’ as they are known to cause health problems when consumed in excess.

Understanding Carbohydrates from Product Information

While nutrition facts labels aid in determining the amount of carbohydrates you eat, they do not help in determining whether a food is refined or not. The ingredients list provides some help in this regard. It identifies all of the food’s ingredients in order of concentration, with the most concentrated ingredient first. When choosing between two breads, pick the one that lists whole wheat (not wheat flour) as the first ingredient, and avoid those with other flour ingredients, such as white flour or corn flour. (Enriched wheat flour refers to white flour with added vitamins.) Eat less of products that list HFCS and other sugars such as sucrose, honey, dextrose, and cane sugar in the first five ingredients. If you want to eat less processed foods then, in general, stay away from products with long ingredient lists. On the front of food and beverages the manufacturers may include claims such as “sugar-free,” “reduced sugar,” “high fiber,” etc.. The Nutrition and Labeling Act of 1990 has defined for the food industry and consumers what these labels mean (Table 4.4 “Food Labels Pertaining to Carbohydrates”).

Table 4.4 Food Labels Pertaining to Carbohydrates

Label Meaning
Sugar-free Contains less than 0.5 grams of sugar per serving
Reduced sugar Contains 25 percent less sugar than similar product
Less sugar Contains 25 percent less sugar than similar product, and was not altered by processing to become so
No sugars added No sugars added during processing
High fiber Contains at least 20 percent of daily value of fiber in each serving
A good source of fiber Contains between 10 and 19 percent of the daily value of fiber per serving
More fiber Contains 10 percent or more of the daily value of fiber per serving

Source: Appendix A: Definitions of Nutrient Claims. Guidance for Industry: A Food Labeling Guide. US Food and Drug Administration. http://www.fda.gov/Food/GuidanceComplianceRegulatoryInformation/GuidanceDocuments/FoodLabelingNutrition/FoodLabelingGuide/ucm064911.htm. Updated October 2009. Accessed September 22, 2017.

In addition, the FDA permits foods that contain whole oats (which contain soluble fiber) to make the health claim on the package that the food reduces the risk of coronary heart disease. The FDA no longer permits Cheerios to make the claim that by eating their cereal “you can lower your cholesterol four percent in six weeks.”

Personal Choices

Carbohydrates are in most foods so you have a great variety of choices with which to meet the carbohydrates recommendations for a healthy diet. The 2010 Dietary Guidelines recommends eating more unrefined carbohydrates and more fiber, and reducing consumption of foods that are high in added sugars. To accomplish these recommendations use some or all of the following suggestions:

The Food Industry: Functional Attributes of Carbohydrates and the Use of Sugar Substitutes

In the food industry, both fast-releasing and slow-releasing carbohydrates are utilized to give foods a wide spectrum of functional attributes, including increased sweetness, viscosity, bulk, coating ability, solubility, consistency, texture, body, and browning capacity. The differences in chemical structure between the different carbohydrates confer their varied functional uses in foods. Starches, gums, and pectins are used as thickening agents in making jam, cakes, cookies, noodles, canned products, imitation cheeses, and a variety of other foods. Molecular gastronomists use slow-releasing carbohydrates, such as alginate, to give shape and texture to their fascinating food creations. Adding fiber to foods increases bulk. Simple sugars are used not only for adding sweetness, but also to add texture, consistency, and browning. In ice cream, the combination of sucrose and corn syrup imparts sweetness as well as a glossy appearance and smooth texture.

Due to the potential health consequences of consuming too many added sugars, sugar substitutes have replaced them in many foods and beverages. Sugar substitutes may be from natural sources or artificially made. Those that are artificially made are called artificial sweeteners and must be approved by the FDA for use in foods and beverages. The artificial sweeteners approved by the FDA are saccharin, aspartame, acesulfame potassium, neotame, advantame, and sucralose. Stevia is an example of a naturally derived sugar substitute. It comes from a plant commonly known as sugarleaf and does not require FDA approval. Sugar alcohols, such as xylitol, sorbitol, erythritol, and mannitol, are sugar alcohols that occur naturally in some fruits and vegetables. However, they are industrially synthesized with yeast and other microbes for use as food additives. The FDA requires that foods disclose the fact that they contain sugar alcohols, but does not require scientific testing of it. (Though many of them have undergone studies anyway.) In comparison to sucrose, artificial sweeteners are significantly sweeter (in fact, by several hundred times), but sugar alcohols are more often less sweet than sucrose (see Table 4.5 “Relative Sweetness of Sugar Substitutes”). Artificial sweeteners and Stevia are not digested or absorbed in significant amounts and therefore are not a significant source of calories in the diet. Sugar alcohols are somewhat digested and absorbed and, on average, contribute about half of the calories as sucrose (4 kilocalories/gram). These attributes make sugar substitutes attractive for many people—especially those who want to lose weight and/or better manage their blood-glucose levels.

Table 4.5 Relative Sweetness Of Sugar Substitutes

Sweetener Trade Names Sweeter than Sucrose (times)
Saccharine “Sweet-N-Lo” 300.0
Aspartame “NutraSweet,” “Equal” 80-200.0
Acesulfame-K “Sunette” 200.0
Neotame 7,000.0–13,000.0
Advantame 20,000
Sucralose “Splenda” 600.0
Stevia 250.0–300.0
Xylitol 0.8
Mannitol 0.5
Sorbitol 0.6
Erythritol 1.0

Benefits of Sugar Substitutes

Consuming foods and beverages containing sugar substitutes may benefit health by reducing the consumption of simple sugars, which are higher in calories, cause tooth decay, and are potentially linked to chronic disease. Artificial sweeteners are basically non-nutrients though not all are completely calorie-free. However, because they are so intense in sweetness they are added in very small amounts to foods and beverages. Artificial sweeteners and sugar alcohols are not “fermentable sugars” and therefore they do not cause tooth decay. Chewing gum with artificial sweeteners is the only proven way that artificial sweeteners promote oral health. The American Dental Association (ADA) allows manufacturers of chewing gum to label packages with an ADA seal if they have convincing scientific evidence demonstrating their product either reduces plaque acids, cavities, or gum disease, or promotes tooth remineralization.

There is limited scientific evidence that consuming products with artificial sweeteners decreases weight. In fact, some studies suggest the intense sweetness of these products increases appetite for sweet foods and may lead to increased weight gain. Also, there is very limited evidence that suggests artificial sweeteners lower blood-glucose levels. Additionally, many foods and beverages containing artificial sweeteners and sugar alcohols are still empty-calorie foods (i.e. chewing sugarless gum or drinking diet soda pop) are not going to better your blood-glucose levels or your health.

Health Concerns

The most common side effect of consuming products containing sugar substitutes is gastrointestinal upset, a result of their incomplete digestion. Since the introduction of sugar substitutes to the food and beverage markets, the public has expressed concern about their safety. The health concerns of sugar substitutes originally stemmed from scientific studies, which were misinterpreted by both scientists and the public.

In the early 1970s scientific studies were published that demonstrated that high doses of saccharin caused bladder tumors in rats. This information fueled the still-ongoing debate of the health consequences of all artificial sweeteners. In actuality, the results from the early studies were completely irrelevant to humans. The large doses (2.5 percent of diet) of saccharine caused a pellet to form in the rat’s bladder. That pellet chronically irritated the bladder wall, eventually resulting in tumor development. Since this study, scientific investigation in rats, monkeys, and humans have not found any relationship between saccharine consumption and bladder cancer. In 2000, saccharin was removed from the US National Toxicology Program’s list of potential carcinogens.Artificial Sweeteners and Cancer. National Cancer Institute. http://www.cancer.gov/cancertopics/factsheet/Risk/artificial-sweeteners. Updated August 5, 2009. Accessed September 22, 2017.

There have been health concerns over other artificial sweeteners, most notably aspartame (sold under the trade names of NutraSweet and Equal). The first misconception regarding aspartame was that it was linked with an increase in the incidence of brain tumors in the United States. It was subsequently discovered that the increase in brain tumors started eight years prior to the introduction of aspartame to the market. Today, aspartame is accused of causing brain damage, autism, emotional disorders, and a myriad of other disorders and diseases. Some even believe aspartame is part of a governmental conspiracy to make people dumber. The reality is there is no good scientific evidence backing any of these accusations, and that aspartame has been the most scientifically tested food additive. It is approved for use as an artificial sweetener in over ninety countries.

Aspartame is made by joining aspartic acid and phenylalanine to a dipeptide (with a methyl ester). When digested, it is broken down to aspartic acid, phenylalanine, and methanol. People who have the rare genetic disorder phenylketonuria (PKU) have to avoid products containing aspartame. Individuals who have PKU do not have a functional enzyme that converts phenylalanine to the amino acid tyrosine. This causes a buildup of phenylalanine and its metabolic products in the body. If PKU is not treated, the buildup of phenylalanine causes progressive brain damage and seizures. The FDA requires products that contain aspartame to state on the product label, “Phenylketonurics: Contains Phenylalanine.” For more details on sugar substitutes please refer to Table 4.6 “Sweeteners”.

Table 4.6 Sweeteners

Sweeteners with Trade Name Calories Source/Origin Consumer Recommendations Controversial Issues Product Uses
Aspartame
  • NutraSweet
  • Equal
4 kcal/g Composed of two amino acids (phenylalanine + aspartic acid) + methanol.Two hundred times sweeter than sucrose. FDA set maximum Acceptable Daily Intakes (ADI):50 mg/kg body weight = 16 12 oz. diet soft drinks for adults.

*Cannot be used in products requiring cooking.

People with PKU should not consume aspartame.

Children have potential to reach ADI if consuming many beverages, desserts, frozen desserts, and gums containing aspartame routinely. Beverages, gelatin desserts, gums, fruit spreads.
Saccharin
  • Sweet ‘n’ Low
0 kcal/g Discovered in 1878. The basic substance is benzoic sulfinide.Three hundred times sweeter than sucrose. ADI: 5 mg/kg body weight.*Can be used in cooking. 1970s, high doses of saccharin associated with bladder cancer in laboratory animals. In 1977, FDA proposed banning saccharin from use in food
  • protest launched by consumer & interest groups
  • warning label listed on products about saccharin and cancer risk in animals until 2001 when studies concluded that it did not cause cancer in humans
General purpose sweetener in all foods and beverages.Sold as Sweet ‘n’ Low in United States; also found in cosmetics and pharmaceutical products.
Acesulfame K
  • Sunnette
  • Sweet One
0 kcal/g Discovered in 1967. Composed of an organic salt, potassium (K). Structure is very similar to saccharin’s.It passes through the body unchanged which means it does not provide energy.

Two hundred times sweeter than sucrose.

ADI: 15 mg/kg body weight.Body cannot digest it.

*Can be used in cooking.

Chewing gum, powdered beverage mixes, nondairy creamers, gelatins, puddings, instant teas and coffees.
Cyclamates
  • Sugar Twin
0 kcal/g Thirty times sweeter than sucrose.Discovered in 1937. No ADI available. 1949, cyclamate approved by FDA for use. Cyclamate was classified as GRAS (Generally Recognized As Safe) until 1970 when it was removed from GRAS status and banned from use in all food and beverage products within the United States on the basis of one study that indicated it caused bladder cancer in rats. Approval still pending for use in the United States since the ban.Canada and other countries use this type of sweetener. Recommended as a substitute for table sugar for diabetics in 1950s, baked goods.
Sucralose
  • Splenda
1 Splenda packet contains 3.31 calories = 1g First discovered in 1976. Approved for use in 1998 in the United States and in 1991 in Canada.Derived from sucrose in which three of its hydroxyl (OH) groups are replaced by chlorine (Cl−).

Six hundred times sweeter than sugar.

ADI: 5 mg/kg body weight.*Can be used in cooking. General purpose sweetener, baked goods, beverages, gelatin desserts, frozen dairy desserts, canned fruits, salad dressings, dietary supplements; currently recommended as a replacement for table sugar and additive for diabetics.
Stevioside
  • Stevia
  • Sweet Leaf
N/A Derived from stevia plant found in South America. Stevia rebaudiana leaves. Classified as GRAS.Considered to be a dietary supplement and approved not as an additive, but as a dietary supplement. Used sparingly, stevia may do little harm, but FDA could not approve extensive use of this sweetener due to concerns regarding its effect on reproduction, cancer development, and energy metabolism. Sold in health food stores as a dietary supplement.
Sucrose
  • Sugar
~4 kcal/g Extracted from either sugar beets or sugar cane, which is then purified and crystallized. It is illegal to sell true raw sugar in the United States because when raw it contains dirt and insect parts, as well as other byproducts. Raw sugar products sold in the United States have actually gone through more than half of the same steps in the refining process as table sugar. Over-consumption has been linked to several health effects such as tooth decay or dental caries and contributes to increased risk for chronic diseases. Biscuits, cookies, cakes, pies, candy canes, ice cream, sorbets, and as a food preservative.
Honey 3 kcal/g Made from sucrose. Contains nectar of flowering plants. Made by bees.Sucrose is fructose + glucose; however, honey contains more calories than sucrose because honey is denser. *Considered safe for baking and cooking.Infants under twelve months old should not be given honey because their digestive tracts cannot handle the bacteria found in honey. Older children and adults are immune to these effects. Honey contains some harmful bacteria that can cause fatal food poisoning in infants. Sweeteners in various foods and beverages such as sodas, teas, alcoholic beverages, and baked goods.
HFCS
  • high fructose corn syrup
Dry form: 4 kcal/g; Liquid form: 3 kcal/g Corn is milled to produce corn starch, then the cornstarch is further processed to yield corn syrup. Controversial because it is found ubiquitously in processed food products, which could lead to overconsumption. Study results are varied regarding its role in chronic disease. Soft drinks, desserts, candies, jellies.
Sugar Alcohols
  • Sorbitol
  • Xylitol
  • Mannitol
2–4 kcal/g.Not calorie free Sugar alcohols.Sorbitol is derived from glucose. Less likely to cause tooth decay than sucrose.Sugar alcohols have a laxative effect. May cause diarrhea and gastrointestinal distress if consumed in large amounts. Provide bulk and sweetness in the following sugar-free items: cookies, jams, jellies, chewing gum, candies, mints, pharmaceutical and oral health products.

Regulation

Prior to introducing any new artificial sweetener into foods it is rigorously tested and must be legally approved by the FDA. The FDA regulates artificial sweeteners along with other food additives, which number in the thousands. The FDA is responsible for determining whether a food additive presents “a reasonable certainty of no harm” to consumers when used as proposed. The FDA uses the best scientific evidence available to make the statement of no harm, but it does declare that science has its limits and that the “FDA can never be absolutely certain of the absence of any risk from the use of any substance.”Overview of Food Ingredients, Additives and Colors. US Food and Drug Administration. https://wayback.archive-it.org/7993/20170722025446/https://www.fda.gov/Food/IngredientsPackagingLabeling/FoodAdditivesIngredients/ucm094211.htm. Updated April 2010. Accessed September 22, 2017.

The FDA additionally has established ADIs for artificial sweeteners. The ADIs are the maximum amount in milligrams per kilogram of body weight considered safe to consume daily (mg/kg bw/day) and incorporates a large safety factor. The following list contains the artificial sweeteners approved for use in foods and beverages in the United States, and their ADIs:

V

Chapter 5. Lipids

Introduction

E hinu auaneʻi na nuku, he pōmaikaʻi ko laila

Where the mouths are shiny with fat food, prosperity is there


Learning Objectives

By the end of this chapter, you will be able to:

  • Describe the function and role of lipids in the body
  • Describe the process of lipid digestion and absorption
  • Describe tools and methods for balancing your diet with lipids

The coconut is considered to be the ‘Tree of Life’ in the Pacific. The coconut provided wood for shelter and craftsmanship along with being a source of hydration, animal feed and income through copra. It also serves many ecological functions such as a source for shade, protection from the wind, and coastal erosion control.Snowdon W, Osborn T. Coconut: It’s role in health. Secretariat of the Pacific; 2003. A thriving coconut tree provided Pacific Island families with great prosperity.

For many Pacific communities the coconut provided a valuable source of fat to a diet that was generally low in fat as the major nutrient found in the mature coconut is fat. As you read further, you will learn the different types of fats, their essential roles in the body, and the potential health consequences and benefits of diets rich in particular lipids. You will be better equipped to decide the best way to get your nutritional punch from various fats in your diet.

Lipids are important molecules that serve different roles in the human body. A common misconception is that fat is simply fattening. However, fat is probably the reason we are all here. Throughout history, there have been many instances when food was scarce. Our ability to store excess caloric energy as fat for future usage allowed us to continue as a species during these times of famine. So, normal fat reserves are a signal that metabolic processes are efficient and a person is healthy.

Lipids are a family of organic compounds that are mostly insoluble in water. Composed of fats and oils, lipids are molecules that yield high energy and have a chemical composition mainly of carbon, hydrogen, and oxygen. Lipids perform three primary biological functions within the body: they serve as structural components of cell membranes, function as energy storehouses, and function as important signaling molecules.

The three main types of lipids are triglycerides, phospholipids, and sterols. Triglycerides make up more than 95 percent of lipids in the diet and are commonly found in fried foods, vegetable oil, butter, whole milk, cheese, cream cheese, and some meats. Naturally occurring triglycerides are found in many foods, including avocados, olives, corn, and nuts. We commonly call the triglycerides in our food “fats” and “oils.” Fats are lipids that are solid at room temperature, whereas oils are liquid. As with most fats, triglycerides do not dissolve in water. The terms fats, oils, and triglycerides are discretionary and can be used interchangeably. In this chapter when we use the word fat, we are referring to triglycerides.

Phospholipids make up only about 2 percent of dietary lipids. They are water-soluble and are found in both plants and animals. Phospholipids are crucial for building the protective barrier, or membrane, around your body’s cells. In fact, phospholipids are synthesized in the body to form cell and organelle membranes. In blood and body fluids, phospholipids form structures in which fat is enclosed and transported throughout the bloodstream.

Sterols are the least common type of lipid. Cholesterol is perhaps the best well-known sterol. Though cholesterol has a notorious reputation, the body gets only a small amount of its cholesterol through food—the body produces most of it. Cholesterol is an important component of the cell membrane and is required for the synthesis of sex hormones, vitamin D, and bile salts.

Later in this chapter, we will examine each of these lipids in more detail and discover how their different structures function to keep your body working.

Figure 5.1 Types of Lipids

Examples of foods containing lipids

The Functions of Lipids in the Body

Storing Energy

The excess energy from the food we eat is digested and incorporated into adipose tissue, or fatty tissue. Most of the energy required by the human body is provided by carbohydrates and lipids. As discussed in the Carbohydrates chapter, glucose is stored in the body as glycogen. While glycogen provides a ready source of energy, lipids primarily function as an energy reserve. As you may recall, glycogen is quite bulky with heavy water content, thus the body cannot store too much for long. Alternatively, fats are packed together tightly without water and store far greater amounts of energy in a reduced space. A fat gram is densely concentrated with energy—it contains more than double the amount of energy than a gram of carbohydrate. Energy is needed to power the muscles for all the physical work and play an average person or child engages in. For instance, the stored energy in muscles propels an athlete down the track, spurs a dancer’s legs to showcase the latest fancy steps, and keeps all the moving parts of the body functioning smoothly.

Unlike other body cells that can store fat in limited supplies, fat cells are specialized for fat storage and are able to expand almost indefinitely in size. An overabundance of adipose tissue can result in undue stress on the body and can be detrimental to your health. A serious impact of excess fat is the accumulation of too much cholesterol in the arterial wall, which can thicken the walls of arteries and lead to cardiovascular disease. Thus, while some body fat is critical to our survival and good health, in large quantities it can be a deterrent to maintaining good health.

Regulating and Signaling

Triglycerides control the body’s internal climate, maintaining constant temperature. Those who don’t have enough fat in their bodies tend to feel cold sooner, are often fatigued, and have pressure sores on their skin from fatty acid deficiency. Triglycerides also help the body produce and regulate hormones. For example, adipose tissue secretes the hormone leptin, which regulates appetite. In the reproductive system, fatty acids are required for proper reproductive health. Women who lack proper amounts may stop menstruating and become infertile. Omega-3 and omega-6 essential fatty acids help regulate cholesterol and blood clotting and control inflammation in the joints, tissues, and bloodstream. Fats also play important functional roles in sustaining nerve impulse transmission, memory storage, and tissue structure. More specifically in the brain, lipids are focal to brain activity in structure and in function. They help form nerve cell membranes, insulate neurons, and facilitate the signaling of electrical impulses throughout the brain.

Insulating and Protecting

Did you know that up to 30 percent of body weight is comprised of fat tissue? Some of this is made up of visceral fat or adipose tissue surrounding delicate organs. Vital organs such as the heart, kidneys, and liver are protected by visceral fat. The composition of the brain is outstandingly 60 percent fat, demonstrating the major structural role that fat serves within the body. You may be most familiar with subcutaneous fat, or fat underneath the skin. This blanket layer of tissue insulates the body from extreme temperatures and helps keep the internal climate under control. It pads our hands and buttocks and prevents friction, as these areas frequently come in contact with hard surfaces. It also gives the body the extra padding required when engaging in physically demanding activities such as ice- or roller skating, horseback riding, or snowboarding.

Aiding Digestion and Increasing Bioavailability

The dietary fats in the foods we eat break down in our digestive systems and begin the transport of precious micronutrients. By carrying fat-soluble nutrients through the digestive process, intestinal absorption is improved. This improved absorption is also known as increased bioavailability. Fat-soluble nutrients are especially important for good health and exhibit a variety of functions. Vitamins A, D, E, and K—the fat-soluble vitamins—are mainly found in foods containing fat. Some fat-soluble vitamins (such as vitamin A) are also found in naturally fat-free foods such as green leafy vegetables, carrots, and broccoli. These vitamins are best absorbed when combined with foods containing fat. Fats also increase the bioavailability of compounds known as phytochemicals, which are plant constituents such as lycopene (found in tomatoes) and beta-carotene (found in carrots). Phytochemicals are believed to promote health and well-being. As a result, eating tomatoes with olive oil or salad dressing will facilitate lycopene absorption. Other essential nutrients, such as essential fatty acids, are constituents of the fats themselves and serve as building blocks of a cell.

Figure 5.2 Food Sources of Omega 3’s

Sources of Omega 3 fatty acids

Note that removing the lipid elements from food also takes away the food’s fat-soluble vitamin content. When products such as grain and dairy are processed, these essential nutrients are lost. Manufacturers replace these nutrients through a process called enrichment.

The Role of Lipids in Food

High Energy Source

Fat-rich foods naturally have a high caloric density. Foods that are high in fat contain more calories than foods high in protein or carbohydrates. As a result, high-fat foods are a convenient source of energy. For example, 1 gram of fat or oil provides 9 kilocalories of energy, compared with 4 kilocalories found in 1 gram of carbohydrate or protein. Depending on the level of physical activity and on nutritional needs, fat requirements vary greatly from person to person. When energy needs are high, the body welcomes the high-caloric density of fats. For instance, infants and growing children require proper amounts of fat to support normal growth and development. If an infant or child is given a low-fat diet for an extended period, growth and development will not progress normally. Other individuals with high-energy needs are athletes, people who have physically demanding jobs, and those recuperating from illness.

When the body has used all of its calories from carbohydrates (this can occur after just twenty minutes of exercise), it initiates fat usage. A professional swimmer must consume large amounts of food energy to meet the demands of swimming long distances, so eating fat-rich foods makes sense. In contrast, if a person who leads a sedentary lifestyle eats the same high-density fat foods, they will intake more fat calories than their body requires within just a few bites. Use caution—consumption of calories over and beyond energy requirements is a contributing factor to obesity.

Smell and Taste

Fat contains dissolved compounds that contribute to mouth-watering aromas and flavors. Fat also adds texture to food. Baked foods are supple and moist. Frying foods locks in flavor and lessens cooking time. How long does it take you to recall the smell of your favorite food cooking? What would a meal be without that savory aroma to delight your senses and heighten your preparedness for eating a meal?

Fat plays another valuable role in nutrition. Fat contributes to satiety, or the sensation of fullness. When fatty foods are swallowed the body responds by enabling the processes controlling digestion to retard the movement of food along the digestive tract, thus promoting an overall sense of fullness. Oftentimes before the feeling of fullness arrives, people overindulge in fat-rich foods, finding the delectable taste irresistible. Indeed, the very things that make fat-rich foods attractive also make them a hindrance to maintaining a healthful diet.

Tools for Change

Fish, oil, nuts, milkThere are many sources of omega-3 foods.

It is important to strike a proper balance between omega-3 and omega-6 fats in your diet. Research suggests that a diet that is too high in omega-6 fats distorts the balance of proinflammatory agents, promoting chronic inflammation and causing the potential for health problems such as asthma, arthritis, allergies, or diabetes. Omega-6 fats compete with omega-3 fats for enzymes and will actually replace omega-3 fats. The typical western diet is characterized by an excessive consumption of foods high in omega-6 fatty acids. To gain proper balance between the two, increase your omega-3 fat intake by eating more fatty fish or other sources of omega-3 fatty acids at least two times per week.

How Lipids Work

Lipids are unique organic compounds, each serving key roles and performing specific functions within the body. As we discuss the various types of lipids (triglycerides, phospholipids, and sterols) in further detail, we will compare their structures and functions and examine their impact on human health.

Triglycerides Structure and Functions

Triglycerides are the main form of lipid found in the body and in the diet. Fatty acids and glycerol are the building blocks of triglycerides. Glycerol is a thick, smooth, syrupy compound that is often used in the food industry. To form a triglyceride, a glycerol molecule is joined by three fatty acid chains. triglycerides contain varying mixtures of fatty acids.

Figure 5.3 The Structure of a Triglycerides

Image by Allison Calabrese/ CC BY 4.0

Fatty Acids

Fatty acids determine if the compound is solid or liquid at room temperature. Fatty acids consist of a carboxylic acid (−COOH) group on one end of a carbon chain and a methyl group (−CH3) on the other end. Fatty acids can differ from one another in two important ways—carbon chain length and degree of saturation.

It’s All in the Chain

Fatty acids have different chain lengths and different compositions. Foods have fatty acids with chain lengths between four and twenty-four carbons and most of them contain an even number of carbon atoms. When the carbon chain length is shorter, the melting point of the fatty acid becomes lower—and the fatty acid becomes more liquid.

Figure 5.4 Structures of a Saturated, Monounsaturated, and Polyunsaturated Fat

Methyl and Carboxyl group chemical structure

Image by Allison Calabrese / CC BY 4.0


Fatty Acid Types in the Body

The fatty-acid profile of the diet directly correlates to the tissue lipid profile of the body. It may not solely be the quantity of dietary fat that matters. More directly, the type of dietary fat ingested has been shown to affect body weight, composition, and metabolism. The fatty acids consumed are often incorporated into the triglycerides within the body. Evidence confirms that saturated fatty acids are linked to higher rates of weight retention when compared to other types of fatty acids. Alternatively, the fatty acids found in fish oil are proven to reduce the rate of weight gain as compared to other fatty acids.Mori T, Kondo H. Dietary fish oil upregulates intestinal lipid metabolism and reduces body weight gain in C57BL/6J mice. J Nutr. 2007;137(12):2629-34. http://www.ncbi.nlm.nih.gov/pubmed/18029475. Accessed September 22, 2017.

Degrees of Saturation

Fatty acid chains are held together by carbon atoms that attach to each other and to hydrogen atoms. The term saturation refers to whether or not a fatty acid chain is filled (or “saturated”) to capacity with hydrogen atoms. If each available carbon bond holds a hydrogen atom we call this a saturated fatty acid chain. All carbon atoms in such a fatty acid chain are bonded with single bonds. Sometimes the chain has a place where hydrogen atoms are missing. This is referred to as the point of unsaturation.

When one or more bonds between carbon atoms are a double bond (C=C), that fatty acid is called an unsaturated fatty acid, as it has one or more points of unsaturation. Any fatty acid that has only one double bond is a monounsaturated fatty acid, an example of which is olive oil (75 percent of its fat is monounsaturated). Monounsaturated fats help regulate blood cholesterol levels, thereby reducing the risk for heart disease and stroke. A polyunsaturated fatty acid is a fatty acid with two or more double bonds or two or more points of unsaturation. Soybean oil contains high amounts of polyunsaturated fatty acids. Both monounsaturated fats and polyunsaturated fats provide nutrition that is essential for normal cell development and healthy skin.

Foods that have a high percentage of saturated fatty acids tend to be solid at room temperature. Examples of these are fats found in chocolate (stearic acid, an eighteen-carbon saturated fatty acid is a primary component) and meat. Foods rich in unsaturated fatty acids, such as olive oil (oleic acid, an eighteen-carbon unsaturated fatty acid, is a major component) tend to be liquid at room temperature. Flaxseed oil is rich in alpha-linolenic acid, which is an unsaturated fatty acid and becomes a thin liquid at room temperature.

Knowing the connection between chain length, degree of saturation, and the state of the fatty acid (solid or liquid) is important for making food choices. If you decide to limit or redirect your intake of fat products, then choosing unsaturated fat is more beneficial than choosing a saturated fat. This choice is easy enough to make because unsaturated fats tend to be liquid at room temperature (for example, olive oil) whereas saturated fats tend to be solid at room temperature (for example, butter). Avocados are rich in unsaturated fats. Most vegetable and fish oils contain high quantities of polyunsaturated fats. Olive oil and canola oil are also rich in monounsaturated fats. Conversely, tropical oils are an exception to this rule in that they are liquid at room temperature yet high in saturated fat. Palm oil (often used in food processing) is highly saturated and has been proven to raise blood cholesterol. Shortening, margarine, and commercially prepared products (in general) report to use only vegetable-derived fats in their processing. But even so, much of the fat they use may be in the saturated and trans fat categories.

Cis or Trans Fatty Acids?

The introduction of a carbon double bond in a carbon chain, as in an unsaturated fatty acid, can result in different structures for the same fatty acid composition. When the hydrogen atoms are bonded to the same side of the carbon chain, it is called a cis fatty acid. Because the hydrogen atoms are on the same side, the carbon chain has a bent structure. Naturally occurring fatty acids usually have a cis configuration.

In a trans fatty acid, the hydrogen atoms are attached on opposite sides of the carbon chain. Unlike cis fatty acids, most trans fatty acids are not found naturally in foods, but are a result of a process called hydrogenation. Hydrogenation is the process of adding hydrogen to the carbon double bonds, thus making the fatty acid saturated (or less unsaturated, in the case of partial hydrogenation). This is how vegetable oils are converted into semisolid fats for use in the manufacturing process.

According to the ongoing Harvard Nurses’ Health Study, trans fatty acids have been associated with increased risk for coronary heart disease because of the way they negatively impact blood cholesterol levels.Introduction to “Fats and Cholesterol: Out with the Bad, In with the Good” The Nutrition Source. Harvard School of Public Health. http://www.hsph.harvard.edu/nutritionsource/what-should-you-eat/fats-full-story/#references. Updated 2017. Accessed September 28, 2017.

Figure 5.5 Structures of Saturated, Unsaturated, Cis and Trans fatty Acids

Interestingly, some naturally occurring trans fats do not pose the same health risks as their artificially engineered counterparts. These trans fats are found in ruminant animals such as cows, sheep, and goats, resulting in trans fatty acids being present in our meat, milk, and other dairy product supply. Reports from the US Department of Agriculture (USDA) indicate that these trans fats comprise 15 to 20 percent of the total trans-fat intake in our diet. While we know that trans fats are not exactly harmless, it seems that any negative effect naturally occurring trans fats have are counteracted by the presence of other fatty acid molecules in these animal products, which work to promote human health.

Nonessential and Essential Fatty Acids

Fatty acids are vital for the normal operation of all body systems. The circulatory system, respiratory system, integumentary system, immune system, brain, and other organs require fatty acids for proper function. The body is capable of synthesizing most of the fatty acids it needs from food. These fatty acids are known as nonessential fatty acids. However, there are some fatty acids that the body cannot synthesize and these are called essential fatty acids. It is important to note that nonessential fatty acids doesn’t mean unimportant; the classification is based solely on the ability of the body to synthesize the fatty acid.

Essential fatty acids must be obtained from food. They fall into two categories—omega-3 and omega-6. The 3 and 6 refer to the position of the first carbon double bond and the omega refers to the methyl end of the chain. Omega-3 and omega-6 fatty acids are precursors to important compounds called eicosanoids. Eicosanoids are powerful hormones that control many other hormones and important body functions, such as the central nervous system and the immune system. Eicosanoids derived from omega-6 fatty acids are known to increase blood pressure, immune response, and inflammation. In contrast, eicosanoids derived from omega-3 fatty acids are known to have heart-healthy effects. Given the contrasting effects of the omega-3 and omega-6 fatty acids, a proper dietary balance between the two must be achieved to ensure optimal health benefits.

Essential fatty acids play an important role in the life and death of cardiac cells, immune system function, and blood pressure regulation. Docosahexaenoic acid (DHA) is an omega-3 essential fatty acid shown to play important roles in synaptic transmission in the brain during fetal development.

Some excellent sources of omega-3 and omega-6 essential fatty acids are fish, flaxseed oil, hemp, walnuts, and leafy vegetables. Because these essential fatty acids are easily accessible, essential fatty acid deficiency is extremely rare.

Figure 5.6 Essential Fatty Acids

Image by Allison Calabrese / CC BY 4.0

Phospholipids

Like triglycerides, phospholipids have a glycerol backbone. But unlike triglycerides, phospholipids are diglycerides (two fatty-acid molecules attached to the glycerol backbone) while their third fatty-acid chain has a phosphate group coupled with a nitrogen-containing group. This unique structure makes phospholipids water soluble. Phospholipids are what we call amphiphilic—the fatty-acid sides are hydrophobic (dislike water) and the phosphate group is hydrophilic (likes water).

In the body phospholipids bind together to form cell membranes. The amphiphilic nature of phospholipids governs their function as components of cell membranes. The phospholipids form a double layer in cell membranes, thus effectively protecting the inside of the cell from the outside environment while at the same time allowing for transport of fat and water through the membrane.

Figure 5.7 The Structure of a Phospholipid

Image by Allison Calabrese / CC BY 4.0

Phospholipids are ideal emulsifiers that can keep oil and water mixed. Emulsions are mixtures of two liquids that do not mix. Without emulsifiers, the fat and water content would be somewhat separate within food. Lecithin (phosphatidylcholine), found in egg yolk, honey, and mustard, is a popular food emulsifier. Mayonnaise demonstrates lecithin’s ability to blend vinegar and oil to create the stable, spreadable condiment that so many enjoy. Food emulsifiers play an important role in making the appearance of food appetizing. Adding emulsifiers to sauces and creams not only enhances their appearance but also increases their freshness.

Lecithin’s crucial role within the body is clear, because it is present in every cell throughout the body; 28 percent of brain matter is composed of lecithin and 66 percent of the fat in the liver is lecithin. Many people attribute health-promoting properties to lecithin, such as its ability to lower blood cholesterol and aid with weight loss. There are several lecithin supplements on the market broadcasting these claims. However, as the body can make most phospholipids, it is not necessary to consume them in a pill. The body makes all of the lecithin that it needs.

Figure 5.8 The Difference Between Triglycerides and Phospholipids

Image by Allison Calabrese / CC BY 4.0

Sterols

Sterols have a very different structure from triglycerides and phospholipids. Most sterols do not contain any fatty acids but rather multiring structures. They are complex molecules that contain interlinking rings of carbon atoms, with side chains of carbon, hydrogen, and oxygen attached. Cholesterol is the best-known sterol because of its role in heart disease. It forms a large part of the plaque that narrows the arteries in atherosclerosis. In stark contrast, cholesterol does have specific beneficial functions to perform in the body. Like phospholipids, cholesterol is present in all body cells as it is an important substance in cell membrane structure. Approximately 25 percent of cholesterol in the body is localized in brain tissue. Cholesterol is used in the body to make a number of important things, including vitamin D, glucocorticoids, and the sex hormones, progesterone, testosterone, and estrogens. Notably, the sterols found in plants resemble cholesterol in structure. However, plant sterols inhibit cholesterol absorption in the human body, which can contribute to lower cholesterol levels.

Although cholesterol is preceded by its infamous reputation, it is clearly a vital substance in the body that poses a concern only when there is excess accumulation of it in the blood. Like lecithin, the body can synthesize cholesterol.

Figure 5.9 The Structure of Cholesterol

Digestion and Absorption of Lipids

Lipids are large molecules and generally are not water-soluble. Like carbohydrates and protein, lipids are broken into small components for absorption. Since most of our digestive enzymes are water-based, how does the body break down fat and make it available for the various functions it must perform in the human body?

From the Mouth to the Stomach

The first step in the digestion of triglycerides and phospholipids begins in the mouth as lipids encounter saliva. Next, the physical action of chewing coupled with the action of emulsifiers enables the digestive enzymes to do their tasks. The enzyme lingual lipase, along with a small amount of phospholipid as an emulsifier, initiates the process of digestion. These actions cause the fats to become more accessible to the digestive enzymes. As a result, the fats become tiny droplets and separate from the watery components.

Figure 5.10 Lipid Digestion and Absorption

In the stomach, gastric lipase starts to break down triglycerides into diglycerides and fatty acids. Within two to four hours after eating a meal, roughly 30 percent of the triglycerides are converted to diglycerides and fatty acids. The stomach’s churning and contractions help to disperse the fat molecules, while the diglycerides derived in this process act as further emulsifiers. However, even amid all of this activity, very little fat digestion occurs in the stomach.

Going to the Bloodstream

As stomach contents enter the small intestine, the digestive system sets out to manage a small hurdle, namely, to combine the separated fats with its own watery fluids. The solution to this hurdle is bile. Bile contains bile salts, lecithin, and substances derived from cholesterol so it acts as an emulsifier. It attracts and holds onto fat while it is simultaneously attracted to and held on to by water. Emulsification increases the surface area of lipids over a thousand-fold, making them more accessible to the digestive enzymes.

Once the stomach contents have been emulsified, fat-breaking enzymes work on the triglycerides and diglycerides to sever fatty acids from their glycerol foundations. As pancreatic lipase enters the small intestine, it breaks down the fats into free fatty acids and monoglycerides. Yet again, another hurdle presents itself. How will the fats pass through the watery layer of mucus that coats the absorptive lining of the digestive tract? As before, the answer is bile. Bile salts envelop the fatty acids and monoglycerides to form micelles. Micelles have a fatty acid core with a water-soluble exterior. This allows efficient transportation to the intestinal microvillus. Here, the fat components are released and disseminated into the cells of the digestive tract lining.

Figure 5.11 Micelle Formation

A micelle formed by phospholipids

Scheme of a micelle formed by phospholipids in an aqueous solution by Emmanuel BoutetCC BY-SA 3.0

Figure 5.12 Schematic Diagram Of A Chylomicron

Chylomicron

Chylomicrons Contain Triglycerides Cholesterol Molecules and other Lipids by OpenStax College / CC BY 3.0

Just as lipids require special handling in the digestive tract to move within a water-based environment, they require similar handling to travel in the bloodstream. Inside the intestinal cells, the monoglycerides and fatty acids reassemble themselves into triglycerides. Triglycerides, cholesterol, and phospholipids form lipoproteins when joined with a protein carrier. Lipoproteins have an inner core that is primarily made up of triglycerides and cholesterol esters (a cholesterol ester is a cholesterol linked to a fatty acid). The outer envelope is made of phospholipids interspersed with proteins and cholesterol. Together they form a chylomicron, which is a large lipoprotein that now enters the lymphatic system and will soon be released into the bloodstream via the jugular vein in the neck. Chylomicrons transport food fats perfectly through the body’s water-based environment to specific destinations such as the liver and other body tissues.

Cholesterols are poorly absorbed when compared to phospholipids and triglycerides. Cholesterol absorption is aided by an increase in dietary fat components and is hindered by high fiber content. This is the reason that a high intake of fiber is recommended to decrease blood cholesterol. Foods high in fiber such as fresh fruits, vegetables, and oats can bind bile salts and cholesterol, preventing their absorption and carrying them out of the colon.

If fats are not absorbed properly as is seen in some medical conditions, a person’s stool will contain high amounts of fat. If fat malabsorption persists the condition is known as steatorrhea. Steatorrhea can result from diseases that affect absorption, such as Crohn’s disease and cystic fibrosis.

Figure 5.13 Cholesterol and Soluble Fiber

The Truth about Storing and Using Body Fat

Before the prepackaged food industry, fitness centers, and weight-loss programs, our ancestors worked hard to even locate a meal. They made plans, not for losing those last ten pounds to fit into a bathing suit for vacation, but rather for finding food. Today, this is why we can go long periods without eating, whether we are sick with a vanished appetite, our physical activity level has increased, or there is simply no food available. Our bodies reserve fuel for a rainy day.

One way the body stores fat was previously touched upon in the Carbohydrates chapter. The body transforms carbohydrates into glycogen that is in turn stored in the muscles for energy. When the muscles reach their capacity for glycogen storage, the excess is returned to the liver, where it is converted into triglycerides and then stored as fat.

In a similar manner, much of the triglycerides the body receives from food is transported to fat storehouses within the body if not used for producing energy. The chylomicrons are responsible for shuttling the triglycerides to various locations such as the muscles, breasts, external layers under the skin, and internal fat layers of the abdomen, thighs, and buttocks where they are stored by the body in adipose tissue for future use. How is this accomplished? Recall that chylomicrons are large lipoproteins that contain a triglyceride and fatty-acid core. Capillary walls contain an enzyme called lipoprotein-lipase that dismantles the triglycerides in the lipoproteins into fatty acids and glycerol, thus enabling these to enter into the adipose cells. Once inside the adipose cells, the fatty acids and glycerol are reassembled into triglycerides and stored for later use. Muscle cells may also take up the fatty acids and use them for muscular work and generating energy. When a person’s energy requirements exceed the amount of available fuel presented from a recent meal or extended physical activity has exhausted glycogen energy reserves, fat reserves are retrieved for energy utilization.

As the body calls for additional energy, the adipose tissue responds by dismantling its triglycerides and dispensing glycerol and fatty acids directly into the blood. Upon receipt of these substances the energy-hungry cells break them down further into tiny fragments. These fragments go through a series of chemical reactions that yield energy, carbon dioxide, and water.

Figure 5.14 Storing and Using Fat

Image by Allison Calabrese / CC BY 4.0

Understanding Blood Cholesterol

You may have heard of the abbreviations LDL and HDL with respect to heart health. These abbreviations refer to low-density lipoprotein (LDL) and high-density lipoprotein (HDL), respectively. Lipoproteins are characterized by size, density, and composition. As the size of the lipoprotein increases, the density decreases. This means that HDL is smaller than LDL. Why are they referred to as “good” and “bad” cholesterol? What should you know about these lipoproteins?

Major Lipoproteins

Recall that chylomicrons are transporters of fats throughout the watery environment within the body. After about ten hours of circulating throughout the body, chylomicrons gradually release their triglycerides until all that is left of their composition is cholesterol-rich remnants. These remnants are used as raw materials by the liver to formulate specific lipoproteins. Following is a list of the various lipoproteins and their functions:

Figure 5.15 Lipoprotein Classes

Lipoprotein classes

The classification of the major types of lipoproteins are based on their densities. Density range is shown as well as lipid (red) and protein (blue) content. (Diagram not to scale) / CC BY 3.0

Blood Cholesterol Recommendations

For healthy total blood cholesterol, the desired range you would want to maintain is under 200 mg/dL. More specifically, when looking at individual lipid profiles, a low amount of LDL and a high amount of HDL prevents excess buildup of cholesterol in the arteries and wards off potential health hazards. An LDL level of less than 100 milligrams per deciliter is ideal while an LDL level above 160 mg/dL would be considered high. In contrast, a low value of HDL is a telltale sign that a person is living with major risks for disease. Values of less than 40 mg/dL for men and 50 mg/dL for women mark a risk factor for developing heart disease. In short, elevated LDL blood lipid profiles indicate an increased risk of heart attack, while elevated HDL blood lipid profiles indicate a reduced risk.The University of Maryland Medical Center reports that omega-3 fatty acids promote lower total cholesterol and lower triglycerides in people with high cholesterol.Omega-3 fatty acids. University of Maryland Medical Center.  http://www.umm.edu/altmed/articles/omega-3-000316.htm. Updated August 5, 2015. Accessed September 28, 2017.

It is suggested that people consume omega-3 fatty acids such as alpha-linolenic acid in their diets regularly. Polyunsaturated fatty acids are especially beneficial to consume because they both lower LDL and elevate HDL, thus contributing to healthy blood cholesterol levels. The study also reveals that saturated and trans fatty acids serve as catalysts for the increase of LDL cholesterol. Additionally, trans fatty acids decrease HDL levels, which can impact negatively on total blood cholesterol.

Tools for Change

Being conscious of the need to reduce cholesterol means limiting the consumption of saturated fats and trans fats. Remember that saturated fats found in some meat, whole-fat dairy products, and tropical oils elevate your total cholesterol. Trans fats, such as the ones often found in margarines, processed cookies, pastries, crackers, fried foods, and snack foods also elevate your cholesterol levels. Read and select from the following suggestions as you plan ahead:

  1. Soluble fiber reduces cholesterol absorption in the bloodstream. Try eating more oatmeal, oat bran, kidney beans, apples, pears, citrus fruits, barley, and prunes.
  2. Fatty fish are heart-healthy due to high levels of omega-3 fatty acids that reduce inflammation and lower cholesterol levels. Consume mackerel, lake trout, herring, sardines, tuna, salmon, and halibut. Grilling or baking is the best to avoid unhealthy trans fats that could be added from frying oil.
  3. Walnuts, almonds, peanuts, hazelnuts, pecans, some pine nuts, and pistachios all contain high levels of unsaturated fatty acids that aid in lowering LDL. Make sure the nuts are raw and unsalted. Avoid sugary or salty nuts. One ounce each day is a good amount.
  4. Olive oil contains a strong mix of antioxidants and monounsaturated fat, and may lower LDL while leaving HDL intact. Two tablespoons per day in place of less healthy saturated fats may contribute to these heart-healthy effects without adding extra calories. Extra virgin olive oil promises a greater effect, as the oil is minimally processed and contains more heart-healthy antioxidants.

Testing Your Lipid Profile

The danger of consuming foods rich in cholesterol and saturated and trans fats cannot be overemphasized. Regular testing can provide the foreknowledge necessary to take action to help prevent any life-threatening events.

Current guidelines recommend testing for anyone over age twenty. If there is family history of high cholesterol, your healthcare provider may suggest a test sooner than this. Testing calls for a blood sample to be drawn after nine to twelve hours of fasting for an accurate reading. (By this time, most of the fats ingested from the previous meal have circulated through the body and the concentration of lipoproteins in the blood will be stabilized.)

According to the National Institutes of Health (NIH), the following total cholesterol values are used to target treatmentHigh Blood Cholesterol: What You Need to Know. National Heart, Lung, and Blood Institute, National Institutes of Health. NIH Publication.  http://www.nhlbi.nih.gov/health/public/heart/chol/wyntk.htm. Updated June 2005.Accessed September 28, 2017.

According to the NIH, the following desired values are used to measure an overall lipid profile:

Balancing Your Diet with Lipids

You may reason that if some fats are healthier than other fats, why not consume as much healthy fat as desired? Remember, everything in moderation. As we review the established guidelines for daily fat intake, the importance of balancing fat consumption with proper fat sources will be explained.

Recommended Fat Intake

The acceptable macronutrient distribution range (AMDR) from the Dietary Reference Intake Committee for adult fat consumption is as followsDietary Reference Intakes: Macronutrients. Institute of Medicine. https://www.nal.usda.gov/sites/default/files/fnic_uploads/DRIEssentialGuideNutReq.pdf. Published 2006. Accessed September 28, 2017.:

The current AMDR for child and adolescent fat consumption (for children over four) are as follows:

Identifying Sources of Fat

Population-based studies of American diets have shown that intake of saturated fat is more excessive than intake of trans fat and cholesterol. Saturated fat is a prominent source of fat for most people as it is so easily found in animal fats, tropical oils such as coconut and palm oil, and full-fat dairy products. Oftentimes the fat in the diet of an average young person comes from foods such as cheese, pizza, cookies, chips, desserts, and animal meats such as chicken, burgers, sausages, and hot dogs. To aim for healthier dietary choices, the American Heart Association (AHA) recommends choosing lean meats and vegetable alternatives, choosing dairy products with low fat content, and minimizing the intake of trans fats. The AHA guidelines also recommend consuming fish, especially oily fish, at least twice per week.Fish and Omega-3 Fatty Acids. American Heart Association. https://healthyforgood.heart.org/Eat-smart/Articles/Fish-and-Omega-3-Fatty-Acids. Updated March 24, 2017. Accessed October 5, 2017.

These more appropriate dietary choices will allow for enjoyment of a wide variety of foods while providing the body with the recommended levels of fat from healthier sources. Evaluate the following sources of fat in your overall dietary pattern:

Omega-3 and Omega-6 Fatty Acids

Recall that the body requires fatty acids and is adept at synthesizing the majority of these from fat, protein, and carbohydrate. However, when we say essential fatty acid we are referring to the two fatty acids that the body cannot create on its own, namely, linolenic acid and linoleic acid.

Attain the Omega-3 and Omega-6 Balance

As our food choices evolve, the sources of omega-6 fatty acids in our diets are increasing at a much faster rate than sources of omega-3 fatty acids. Omega-3s are plentiful in diets of non-processed foods where grazing animals and foraging chickens roam free, eating grass, clover, alfalfa, and grass-dwelling insects. In contrast, today’s western diets are bombarded with sources of omega-6. For example, we have oils derived from seeds and nuts and from the meat of animals that are fed grain. Vegetable oils used in fast-food preparations, most snack-foods, cookies, crackers, and sweet treats are also loaded with omega-6 fatty acids. Also, our bodies synthesize eicosanoids from omega-6 fatty acids and these tend to increase inflammation, blood clotting, and cell proliferation, while the hormones synthesized from omega-3 fatty acids have just the opposite effect.

While omega-6 fatty acids are essential, they can be harmful when they are out of balance with omega-3 fatty acids. Omega-6 fats are required only in small quantities. Researchers believe that when omega-6 fats are out of balance with omega-3 fats in the diet they diminish the effects of omega-3 fats and their benefits. This imbalance may elevate the risks for allergies, arthritis, asthma, coronary heart disease, diabetes, and many types of cancer, autoimmunity, and neurodegenerative diseases, all of which are believed to originate from some form of inflammation in the body.

Lipids and the Food Industry

What is the first thing that comes to mind when you read ingredients such as “partially hydrogenated oil” and “hydrogenated oil” on a food label? Do you think of heart disease, heart health, or atherosclerosis? Most people probably do not. As we uncover what hydrogenation is and why manufacturers use it, you will be better equipped to adhere to healthier dietary choices and promote your heart health.

Hydrogenation: The Good Gone Bad?

Food manufacturers are aware that fatty acids are susceptible to attack by oxygen molecules because their points of unsaturation render them vulnerable in this regard. When oxygen molecules attack these points of unsaturation the modified fatty acid becomes oxidized. The oxidation of fatty acids makes the oil rancid and gives the food prepared with it an unappetizing taste. Because oils can undergo oxidation when stored in open containers, they must be stored in airtight containers and possibly be refrigerated to minimize damage from oxidation. Hydrogenation poses a solution that food manufacturers prefer.

When lipids are subjected to hydrogenation, the molecular structure of the fat is altered. Hydrogenation is the process of adding hydrogen to unsaturated fatty-acid chains, so that the hydrogen atoms are connected to the points of saturation and results in a more saturated fatty acid. Liquid oils that once contained more unsaturated fatty acids become semisolid or solid (upon complete hydrogenation) and behave like saturated fats. Oils initially contain polyunsaturated fatty acids. When the process of hydrogenation is not complete, for example, not all carbon double bonds have been saturated the end result is a partially hydrogenated oil. The resulting oil is not fully solid. Total hydrogenation makes the oil very hard and virtually unusable. Some newer products are now using fully hydrogenated oil combined with nonhydrogenated vegetable oils to create a usable fat.

Manufacturers favor hydrogenation as a way to prevent oxidation of oils and ensure longer shelf life. Partially hydrogenated vegetable oils are used in the fast food and processed food industries because they impart the desired texture and crispness to baked and fried foods. Partially hydrogenated vegetable oils are more resistant to breakdown from extremely hot cooking temperatures. Because hydrogenated oils have a high smoking point they are very well suited for frying. In addition, processed vegetable oils are cheaper than fats obtained from animal sources, making them a popular choice for the food industry.

Trans fatty acids occur in small amounts in nature, mostly in dairy products. However, the trans fats that are used by the food industry are produced from the hydrogenation process. Trans fats are a result of the partial hydrogenation of unsaturated fatty acids, which cause them to have a trans configuration, rather than the naturally occurring cis configuration.

Health Implications of Trans Fats

No trans fats! Zero trans fats! We see these advertisements on a regular basis. So widespread is the concern over the issue that restaurants, food manufacturers, and even fast-food establishments proudly tout either the absence or the reduction of these fats within their products. Amid the growing awareness that trans fats may not be good for you, let’s get right to the heart of the matter. Why are trans fats so bad?

Processing naturally occurring fats to modify their texture from liquid to semisolid and solid forms results in the development of trans fats, which have been linked to an increased risk for heart disease. Trans fats are used in many processed foods such as cookies, cakes, chips, doughnuts, and snack foods to give them their crispy texture and increased shelf life. However, because trans fats can behave like saturated fats, the body processes them as if they were saturated fats. Consuming large amounts of trans fats has been associated with tissue inflammation throughout the body, insulin resistance in some people, weight gain, and digestive troubles. In addition, the hydrogenation process robs the person of the benefits of consuming the original oil because hydrogenation destroys omega-3 and omega-6 fatty acids. The AHA states that, like saturated fats, trans fats raise LDL “bad cholesterol,” but unlike saturated fats, trans fats lower HDL “good cholesterol.” The AHA advises limiting trans-fat consumption to less than 1 percent.

How can you benefit from this information? When selecting your foods, steer clear of anything that says “hydrogenated,” “fractionally hydrogenated,” or “partially hydrogenated,” and read food labels in the following categories carefully:

Choose brands that don’t use trans fats and that are low in saturated fats.

Dietary-Fat Substitutes

In response to the rising awareness and concern over the consumption of trans fat, various fat replacers have been developed. Fat substitutes aim to mimic the richness, taste, and smooth feel of fat without the same caloric content as fat. The carbohydrate-based replacers tend to bind water and thus dilute calories. Fat substitutes can also be made from proteins (for example, egg whites and milk whey). However, these are not very stable and are affected by changes in temperature, hence their usefulness is somewhat limited.

Tools for Change

One classic cinnamon roll can have 5 grams of trans fat, which is quite high for a single snack. Many packaged foods often have their nutrient contents listed for a very small serving size—much smaller than what people normally consume—which can easily lead you to eat many “servings.” Labeling laws allow foods containing trans fat to be labeled “trans-fat free” if there are fewer than 0.5 grams per serving. This makes it possible to eat too much trans fat when you think you’re not eating any at all because it is labeled trans-fat free.

Always review the label for trans fat per serving. Check the ingredient list, especially the first three to four ingredients, for telltale signs of hydrogenated fat such as partially or fractionated hydrogenated oil. The higher up the words “partially hydrogenated oil” are on the list of ingredients, the more trans fat the product contains.

Measure out one serving and eat one serving only. An even better choice would be to eat a fruit or vegetable. There are no trans fats and the serving size is more reasonable for similar calories. Fruits and vegetables are packed with water, fiber, and many vitamins, minerals, phytonutrients, and antioxidants. At restaurants be aware that phrases such as “cooked in vegetable oil” might mean hydrogenated vegetable oil, and therefore trans fat.

Lipids and Disease

Because heart disease, cancer, and stroke are the three leading causes of death in the United States, it is critical to address dietary and lifestyle choices that will ultimately decrease risk factors for these diseases. According to the US Department of Health and Human Services (HHS), the following risk factors are controllable: high blood pressure, high cholesterol, cigarette smoking, diabetes, poor diet, physical inactivity, being overweight, and obesity.
In light of that, we present the following informational tips to help you define, evaluate, and implement healthy dietary choices to last a lifetime. The amount and the type of fat that composes a person’s dietary profile will have a profound effect upon the way fat and cholesterol is metabolized in the body.

Watch Out for Saturated Fat and Cholesterol

In proper amounts, cholesterol is a compound used by the body to sustain many important body functions. In excess, cholesterol is harmful if it accumulates in the structures of the body’s vast network of blood vessels. High blood LDL and low blood HDL are major indicators of blood cholesterol risk. The largest influence on blood cholesterol levels rests in the mix of saturated fat and trans fat in the diet. According to the Harvard School of Public Health, for every extra 2 percent of calories from trans fat consumed per day—about the amount found in a midsize order of French fries at a fast-food establishment—the risk of coronary heart disease increases by 23 percentFats and Cholesterol: Out with the Bad, In with the Good. Harvard School of Public Health. http://www.hsph.harvard.edu/nutritionsource/what-should-you -eat/fats-full-story/. Updated 2017. Accessed September 28, 2017. . A buildup of cholesterol in the blood can lead to brittle blood vessels and a blockage of blood flow to the affected area.

How saturated is the fat in your diet? Is it really necessary to eat saturated fat when the body makes all the saturated fat that it needs? Saturated fats should fall into the “bad” category—the body does not demand this kind of fat and it is proven to be a forerunner of cardiovascular disease. In the United States and other developed countries, populations acquire their saturated fat content mostly from meat, seafood, poultry (with skin consumed), and whole-milk dairy products (cheese, milk, and ice cream). Some plant foods are also high in saturated fats, including coconut oil, palm oil, and palm kernel oil.

Food Cholesterol’s Effect on Blood Cholesterol

Dietary cholesterol does have a small impact on overall blood cholesterol levels, but not as much as some people may think. The average American female consumes 237 milligrams of dietary cholesterol per day and for males the figure is slightly higher—about 358 milligrams. Most people display little response to normal dietary cholesterol intake as the body responds by halting its own synthesis of the substance in favor of using the cholesterol obtained through food. Genetic factors may also influence the way a person’s body modifies cholesterol. The 2015-2020 US Dietary Guidelines suggest limiting saturated fats, thereby indirectly limiting dietary cholesterol since foods that are high in cholesterol tend to be high in saturated fats also.

A Prelude to Disease

If left unchecked, improper dietary fat consumption can lead down a path to severe health problems. An increased level of lipids, triglycerides, and cholesterol in the blood is called hyperlipidemia. Hyperlipidemia is inclusive of several conditions but more commonly refers to high cholesterol and triglyceride levels. When blood lipid levels are high, any number of adverse health problems may ensue. Consider the following:

What You Can Do

Remember that saturated fats are found in large amounts in foods of animal origin. They should be limited within the diet. Polyunsaturated fats are generally obtained from non-animal sources. While they are beneficial for lowering bad cholesterol they also lower good cholesterol. They are better for you than saturated fats but are not to be consumed in excess. Monounsaturated fats are of plant origin and are found in most nuts, seeds, seed oils, olive oil, canola oil, and legumes. Monounsaturated fats are excellent because they not only lower bad cholesterol, but also they elevate the good cholesterol. Replace current dietary fats with an increased intake of monounsaturated fats.

Choose whole-grain and high-fiber foods. Reduced risk for cardiovascular disease has been associated with diets that are high in whole grains and fiber. Fiber also slows down cholesterol absorption. The AHA recommends that at least half of daily grain intake should originate from whole grains. The Adequate Intake value for fiber is 14 grams per 1,000 kilocalories. These amounts are based upon the amount of fiber that has been shown to reduce cardiovascular risk.

Do not be sedentary. Get more exercise on a regular basis. Increasing your energy expenditure by just twenty minutes of physical activity at least three times per week will improve your overall health. Physical exercise can help you manage or prevent high blood pressure and blood cholesterol levels. Regular activity raises HDL while at the same time decreases triglycerides and plaque buildup in the arteries. Calories are burned consistently, making it easier to lose and manage weight. Circulation will improve, the body will be better oxygenated, and the heart and blood vessels will function more efficiently.

A Personal Choice about Lipids

A Guide to Making Sense of Dietary Fat

On your next trip to the grocery store prepare yourself to read all food labels carefully and to seriously consider everything that goes into your shopping cart. Create a shopping list and divide your list into columns for “Best,” “Better,” “Good,” “Least Desirable,” and “Infrequent Foods.” As you refine your sense of dietary fat, here are key points to bear in mind:

Now that you have gained a wealth of information and food for thought to enable you to make changes to your dietary pattern we hope that your desire to pursue a healthier lifestyle has been solidified. While we realize that making grand strides in this direction may be awkward at first, even the smallest of accomplishments can produce noticeable results that will spur you on and perhaps spark the interest of friends and family to join you in this health crusade.

Becoming aware of the need to limit your total fat intake will facilitate your ability to make better choices. In turn, making better dietary choices requires gaining knowledge. As you understand that your food choices not only impact your personal physical health but also the delicate balance of our ecosystem, we are confident that you will successfully adapt to the dynamics of the ever-changing global food supply. Remember, the food choices you make today will benefit you tomorrow and into the years to come.

VI

Chapter 6. Protein

Introduction

He pūkoʻa kani ʻāina

A coral reef that grows into an island


Bowl of poke

Ahi poke by Arnold Gatilao / CC BY 2.0

Learning Objectives

By the end of this chapter, you will be able to:

  • Describe the role and structure of proteins
  • Describe the functions of proteins in the body
  • Describe the consequences of protein imbalance

Protein is a vital constituent of all organs in the body and is required to perform a vast variety of functions. Therefore, protein is an essential nutrient that must be consumed in the diet. Many Pacific Island societies such as the Native Hawaiians accompanied their starch meals with some type of meat or seafood. In Hawai‘i, a typical meal consisted of taro or poi accompanied with fish. Fish is known to be a complete protein source which means that all nine essential amino acids are present in the recommended amounts needed. Native Hawaiians ate their fish raw, cooked, salted or dried. If the fish was to be eaten raw, it was prepared by mashing the flesh with the fingers (lomi) to soften the meat and allow the salt to penetrate the flesh deeper. If the fish was not soft enough to lomi, it was cut into chunks or slices or left whole. Today, the most popular and contemporary prepared way of eating fish is known as poke.  Poke, which means “cut up pieces” in Hawaiian, is chopped up chunks of fish that can be seasoned in a variety of different ways.  Some common ways of seasoning include salt, shoyu (soy sauce), limu (seaweed), garlic, and onions. Any type of fish can be used to make poke but ahi (tuna) fish is typically the most desirable option.Fish Preparation/Eating. HawaiiHistory.org.  http://www.hawaiihistory.org/index.cfm?PageID=382. Updated 2017. Accessed October 30, 2017.

Your protein-rich muscles allow for body strength and movement, which enable you to enjoy many activities.

Image by William Hook on unsplash.com / CC0

Defining Protein

Protein makes up approximately 20 percent of the human body and is present in every single cell. The word protein is a Greek word, meaning “of utmost importance.” Proteins are called the workhorses of life as they provide the body with structure and perform a vast array of functions. You can stand, walk, run, skate, swim, and more because of your protein-rich muscles. Protein is necessary for proper immune system function, digestion, and hair and nail growth, and is involved in numerous other body functions. In fact, it is estimated that more than one hundred thousand different proteins exist within the human body. In this chapter you will learn about the components of protein, the important roles that protein serves within the body, how the body uses protein, the risks and consequences associated with too much or too little protein, and where to find healthy sources of it in your diet.

What Is Protein?

Proteins, simply put, are macromolecules composed of amino acids. Amino acids are commonly called protein’s building blocks. Proteins are crucial for the nourishment, renewal, and continuance of life. Proteins contain the elements carbon, hydrogen, and oxygen just as carbohydrates and lipids do, but proteins are the only macronutrient that contains nitrogen. In each amino acid the elements are arranged into a specific conformation around a carbon center. Each amino acid consists of a central carbon atom connected to a side chain, a hydrogen, a nitrogen-containing amino group, and a carboxylic acid group—hence the name “amino acid.” Amino acids differ from each other by which specific side chain is bonded to the carbon center.

Figure 6.1 Amino Acid Structure

Image by Allison Calabrese / CC BY 4.0

Amino acids contain four elements. The arrangement of elements around the carbon center is the same for all amino acids. Only the side chain (R) differs.

It’s All in the Side Chain

The side chain of an amino acid, sometimes called the “R” group, can be as simple as one hydrogen bonded to the carbon center, or as complex as a six-carbon ring bonded to the carbon center. Although each side chain of the twenty amino acids is unique, there are some chemical likenesses among them. Therefore, they can be classified into four different groups. These are nonpolar, polar, acidic, and basic.

Figure 6.2 The Different Groups of Amino Acids

Table of amino acid groups

Amino acids are classified into four groups. These are nonpolar, polar, acidic, and basic.

Essential and Nonessential Amino Acids

Amino acids are further classified based on nutritional aspects. Recall that there are twenty different amino acids, and we require all of them to make the many different proteins found throughout the body. Eleven of these are called nonessential amino acids because the body can synthesize them. However, nine of the amino acids are called essential amino acids because we cannot synthesize them either at all or in sufficient amounts. These must be obtained from the diet. Sometimes during infancy, growth, and in diseased states the body cannot synthesize enough of some of the nonessential amino acids and more of them are required in the diet. These types of amino acids are called conditionally essential amino acids. The nutritional value of a protein is dependent on what amino acids it contains and in what quantities.

Table 6.1 Essential and Nonessential Amino Acids

Essential Nonessential
Histidine Alanine
Isoleucine Arginine*
Leucine Asparagine
Lysine Aspartic acid
Methionine Cysteine*
Phenylalanine Glutamic acid
Threonine Glutamine*
Tryptophan Glycine*
Valine Proline*
Serine
Tyrosine*
*Conditionally essential

The Many Different Types of Proteins

As discussed, there are over one hundred thousand different proteins in the human body. Different proteins are produced because there are twenty types of naturally occurring amino acids that are combined in unique sequences to form polypeptides. These polypeptide chains then fold into a three-dimensional shape to form a protein (see Figure 6.3 “Formation of Polypeptides”). Additionally, proteins come in many different sizes. The hormone insulin, which regulates blood glucose, is composed of only fifty-one amino acids; whereas collagen, a protein that acts like glue between cells, consists of more than one thousand amino acids. Titin is the largest known protein. It accounts for the elasticity of muscles, and consists of more than twenty-five thousand amino acids! The abundant variations of proteins are due to the unending number of amino acid sequences that can be formed. To compare how so many different proteins can be designed from only twenty amino acids, think about music. All of the music that exists in the world has been derived from a basic set of seven notes C, D, E, F, G, A, B and variations thereof. As a result, there is a vast array of music and songs all composed of specific sequences from these basic musical notes. Similarly, the twenty amino acids can be linked together in an extraordinary number of sequences, much more than are possible for the seven musical notes to create songs. As a result, there are enormous variations and potential amino acid sequences that can be created. For example, if an amino acid sequence for a protein is 104 amino acids long the possible combinations of amino acid sequences is equal to 20104, which is 2 followed by 135 zeros!

Figure 6.3 The Formation of Polypeptides

Image by Allison Calabrese / CC BY 4.0

Building Proteins with Amino Acids

The building of a protein consists of a complex series of chemical reactions that can be summarized into three basic steps: transcription, translation, and protein folding. The first step in constructing a protein is the transcription (copying) of the genetic information in double-stranded deoxyribonucleic acid (DNA) into the single-stranded, messenger macromolecule ribonucleic acid (RNA). RNA is chemically similar to DNA, but has two differences; one is that its backbone uses the sugar ribose and not deoxyribose; and two, it contains the nucleotide base uracil, and not thymidine. The RNA that is transcribed from a given piece of DNA contains the same information as that DNA, but it is now in a form that can be read by the cellular protein manufacturer known as the ribosome. Next, the RNA instructs the cells to gather all the necessary amino acids and add them to the growing protein chain in a very specific order. This process is referred to as translation. The decoding of genetic information to synthesize a protein is the central foundation of modern biology.

Figure 6.4 Steps for Building a Protein

Steps for building a protein

Building a protein involves three steps: transcription, translation, and folding. During translation each amino acid is connected to the next amino acid by a special chemical bond called a peptide bond. The peptide bond forms between the carboxylic acid group of one amino acid and the amino group of another, releasing a molecule of water. The third step in protein production involves folding it into its correct shape. Specific amino acid sequences contain all the information necessary to spontaneously fold into a particular shape. A change in the amino acid sequence will cause a change in protein shape. Each protein in the human body differs in its amino acid sequence and consequently, its shape. The newly synthesized protein is structured to perform a particular function in a cell. A protein made with an incorrectly placed amino acid may not function properly and this can sometimes cause disease.

Protein Organization

Protein’s structure enables it to perform a variety of functions. Proteins are similar to carbohydrates and lipids in that they are polymers of simple repeating units; however, proteins are much more structurally complex. In contrast to carbohydrates, which have identical repeating units, proteins are made up of amino acids that are different from one another. Furthermore, a protein is organized into four different structural levels.

Primary: The first level is the one-dimensional sequence of amino acids that are held together by peptide bonds. Carbohydrates and lipids also are one-dimensional sequences of their respective monomers, which may be branched, coiled, fibrous, or globular, but their conformation is much more random and is not organized by their sequence of monomers.

Secondary: The second level of protein structure is dependent on the chemical interactions between amino acids, which cause the protein to fold into a specific shape, such as a helix (like a coiled spring) or sheet.

Tertiary: The third level of protein structure is three-dimensional. As the different side chains of amino acids chemically interact, they either repel or attract each other, resulting in the folded structure. Thus, the specific sequence of amino acids in a protein directs the protein to fold into a specific, organized shape.

Quaternary:  The fourth level of structure is achieved when protein fragments called peptides combine to make one larger functional protein. The protein hemoglobin is an example of a protein that has quaternary structure. It is composed of four peptides that bond together to form a functional oxygen carrier.

A protein’s structure also influences its nutritional quality. Large fibrous protein structures are more difficult to digest than smaller proteins and some, such as keratin, are indigestible. Because digestion of some fibrous proteins is incomplete, not all of the amino acids are absorbed and available for the body to utilize, thereby decreasing their nutritional value.

Figure 6.5 The Four Structural Levels of Proteins

The four structural levels of proteins

Figure by OpenStax / CC BY 4.0

The Role of Proteins in Foods: Cooking and Denaturation

In addition to having many vital functions within the body, proteins perform different roles in our foods by adding certain functional qualities to them. Protein provides food with structure and texture and enables water retention. For example, proteins foam when agitated. (Picture whisking egg whites to make angel food cake. The foam bubbles are what give the angel food cake its airy texture.) Yogurt is another good example of proteins providing texture. Milk proteins called caseins coagulate, increasing yogurt’s thickness. Cooked proteins add some color and flavor to foods as the amino group binds with carbohydrates and produces a brown pigment and aroma. Eggs are between 10 and 15 percent protein by weight. Most cake recipes use eggs because the egg proteins help bind all the other ingredients together into a uniform cake batter. The proteins aggregate into a network during mixing and baking that gives cake structure.

Birthday cake with a slice cut out

Image by Annie Spratt on unspash.com / CC0

Protein Denaturation: Unraveling the Fold

When a cake is baked, the proteins are denatured. Denaturation refers to the physical changes that take place in a protein exposed to abnormal conditions in the environment. Heat, acid, high salt concentrations, alcohol, and mechanical agitation can cause proteins to denature. When a protein denatures, its complicated folded structure unravels, and it becomes just a long strand of amino acids again. Weak chemical forces that hold tertiary and secondary protein structures together are broken when a protein is exposed to unnatural conditions. Because proteins’ function is dependent on their shape, denatured proteins are no longer functional. During cooking the applied heat causes proteins to vibrate. This destroys the weak bonds holding proteins in their complex shape (though this does not happen to the stronger peptide bonds). The unraveled protein strands then stick together, forming an aggregate (or network).

Figure 6.6 Protein Denaturation

Protein denaturation

When a protein is exposed to a different environment, such as increased temperature, it unfolds into a single strand of amino acids.


Protein Digestion and Absorption

How do the proteins from foods, denatured or not, get processed into amino acids that cells can use to make new proteins? When you eat food the body’s digestive system breaks down the protein into the individual amino acids, which are absorbed and used by cells to build other proteins and a few other macromolecules, such as DNA. We previously discussed the general process of food digestion,  let’s follow the specific path that proteins take down the gastrointestinal tract and into the circulatory system (Figure 6.7 “Digestion and Absorption of Protein”). Eggs are a good dietary source of protein and will be used as our example to describe the path of proteins in the processes of digestion and absorption. One egg, whether raw, hard-boiled, scrambled, or fried, supplies about six grams of protein.

Figure 6.7 Digestion and Absorption of Protein

From the Mouth to the Stomach

Unless you are eating it raw, the first step in egg digestion (or any other protein food) involves chewing. The teeth begin the mechanical breakdown of the large egg pieces into smaller pieces that can be swallowed. The salivary glands provide some saliva to aid swallowing and the passage of the partially mashed egg through the esophagus. The mashed egg pieces enter the stomach through the esophageal sphincter. The stomach releases gastric juices containing hydrochloric acid and the enzyme, pepsin, which initiate the breakdown of the protein. The acidity of the stomach facilitates the unfolding of the proteins that still retain part of their three-dimensional structure after cooking and helps break down the protein aggregates formed during cooking. Pepsin, which is secreted by the cells that line the stomach, dismantles the protein chains into smaller and smaller fragments. Egg proteins are large globular molecules and their chemical breakdown requires time and mixing. The powerful mechanical stomach contractions churn the partially digested protein into a more uniform mixture called chyme. Protein digestion in the stomach takes a longer time than carbohydrate digestion, but a shorter time than fat digestion. Eating a high-protein meal increases the amount of time required to sufficiently break down the meal in the stomach. Food remains in the stomach longer, making you feel full longer.

From the Stomach to the Small Intestine

The stomach empties the chyme containing the broken down egg pieces into the small intestine, where the majority of protein digestion occurs. The pancreas secretes digestive juice that contains more enzymes that further break down the protein fragments. The two major pancreatic enzymes that digest proteins are chymotrypsin and trypsin. The cells that line the small intestine release additional enzymes that finally break apart the smaller protein fragments into the individual amino acids. The muscle contractions of the small intestine mix and propel the digested proteins to the absorption sites. In the lower parts of the small intestine, the amino acids are transported from the intestinal lumen through the intestinal cells to the blood. This movement of individual amino acids requires special transport proteins and the cellular energy molecule, adenosine triphosphate (ATP). Once the amino acids are in the blood, they are transported to the liver. As with other macronutrients, the liver is the checkpoint for amino acid distribution and any further breakdown of amino acids, which is very minimal. Recall that amino acids contain nitrogen, so further catabolism of amino acids releases nitrogen-containing ammonia. Because ammonia is toxic, the liver transforms it into urea, which is then transported to the kidney and excreted in the urine. Urea is a molecule that contains two nitrogens and is highly soluble in water. This makes it a good choice for transporting excess nitrogen out of the body. Because amino acids are building blocks that the body reserves in order to synthesize other proteins, more than 90 percent of the protein ingested does not get broken down further than the amino acid monomers.

Amino Acids Are Recycled

Just as some plastics can be recycled to make new products, amino acids are recycled to make new proteins. All cells in the body continually break down proteins and build new ones, a process referred to as protein turnover. Every day over 250 grams of protein in your body are dismantled and 250 grams of new protein are built. To form these new proteins, amino acids from food and those from protein destruction are placed into a “pool.” Though it is not a literal pool, when an amino acid is required to build another protein it can be acquired from the additional amino acids that exist within the body. Amino acids are used not only to build proteins, but also to build other biological molecules containing nitrogen, such as DNA, RNA, and to some extent to produce energy. It is critical to maintain amino acid levels within this cellular pool by consuming high-quality proteins in the diet, or the amino acids needed for building new proteins will be obtained by increasing protein destruction from other tissues within the body, especially muscle. This amino acid pool is less than one percent of total body-protein content. Thus, the body does not store protein as it does with carbohydrates (as glycogen in the muscles and liver) and lipids (as triglycerides in adipose tissue).

Figure 6.8 Options For Amino Acid Use In The Human Body

Image by Allison Calabrese / CC BY 4.0


Amino acids in the cellular pool come from dietary protein and from the destruction of cellular proteins. The amino acids in this pool need to be replenished because amino acids are outsourced to make new proteins, energy, and other biological molecules.

Protein’s Functions in the Body

Shapes of various proteins

Proteins are the “workhorses” of the body and participate in many bodily functions. Proteins come in all sizes and shapes and each is specifically structured for its particular function.

Structure and Motion

Figure 6.9 Collagen Structure

Collagen triple helix protein 3d rendering

Collagen Triple Helix by Nevit Dilmen / CC BY-SA 3.0

More than one hundred different structural proteins have been discovered in the human body, but the most abundant by far is collagen, which makes up about 6 percent of total body weight. Collagen makes up 30 percent of bone tissue and comprises large amounts of tendons, ligaments, cartilage, skin, and muscle. Collagen is a strong, fibrous protein made up of mostly glycine and proline. Within its quaternary structure three peptide strands twist around each other like a rope and then these collagen ropes overlap with others. This highly ordered structure is even stronger than steel fibers of the same size. Collagen makes bones strong, but flexible. Collagen fibers in the skin’s dermis provide it with structure, and the accompanying elastin protein fibrils make it flexible. Pinch the skin on your hand and then let go; the collagen and elastin proteins in skin allow it to go back to its original shape. Smooth-muscle cells that secrete collagen and elastin proteins surround blood vessels, providing the vessels with structure and the ability to stretch back after blood is pumped through them. Another strong, fibrous protein is keratin, which is what skin, hair, and nails are made of. The closely packed collagen fibrils in tendons and ligaments allow for synchronous mechanical movements of bones and muscle and the ability of these tissues to spring back after a movement is complete.

Enzymes

Although proteins are found in the greatest amounts in connective tissues such as bone, their most extraordinary function is as enzymes. Enzymes are proteins that conduct specific chemical reactions. An enzyme’s job is to provide a site for a chemical reaction and to lower the amount of energy and time it takes for that chemical reaction to happen (this is known as “catalysis”). On average, more than one hundred chemical reactions occur in cells every single second and most of them require enzymes. The liver alone contains over one thousand enzyme systems. Enzymes are specific and will use only particular substrates that fit into their active site, similar to the way a lock can be opened only with a specific key. Nearly every chemical reaction requires a specific enzyme. Fortunately, an enzyme can fulfill its role as a catalyst over and over again, although eventually it is destroyed and rebuilt. All bodily functions, including the breakdown of nutrients in the stomach and small intestine, the transformation of nutrients into molecules a cell can use, and building all macromolecules, including protein itself, involve enzymes (see Figure 6.10 “Enzymes Role in Carbohydrate Digestion”).


Figure 6.10 Enzymes Role in Carbohydrate Digestion

Hormones

Proteins are responsible for hormone synthesis. Hormones are the chemical messages produced by the endocrine glands. When an endocrine gland is stimulated, it releases a hormone. The hormone is then transported in the blood to its target cell, where it communicates a message to initiate a specific reaction or cellular process. For instance, after you eat a meal, your blood glucose levels rise. In response to the increased blood glucose, the pancreas releases the hormone insulin. Insulin tells the cells of the body that glucose is available and to take it up from the blood and store it or use it for making energy or building macromolecules. A major function of hormones is to turn enzymes on and off, so some proteins can even regulate the actions of other proteins. While not all hormones are made from proteins, many of them are.

Fluid and Acid-Base Balance

Proper protein intake enables the basic biological processes of the body to maintain the status quo in a changing environment. Fluid balance refers to maintaining the distribution of water in the body. If too much water in the blood suddenly moves into a tissue, the results are swelling and, potentially, cell death. Water always flows from an area of high concentration to one of a low concentration. As a result, water moves toward areas that have higher concentrations of other solutes, such as proteins and glucose. To keep the water evenly distributed between blood and cells, proteins continuously circulate at high concentrations in the blood. The most abundant protein in blood is the butterfly-shaped protein known as albumin. Albumin’s presence in the blood makes the protein concentration in the blood similar to that in cells. Therefore, fluid exchange between the blood and cells is not in the extreme, but rather is minimized to preserve the status quo.

Figure 6.11 The Protein Albumin

The Protein Albumin

PDB 1o9x EBI by Jawahar Swaminathan and MSD staff at the European Bioinformatics Institute / Public Domain The butterfly-shaped protein, albumin, has many functions in the body including maintaining fluid and acid-base balance and transporting molecules.

Protein is also essential in maintaining proper pH balance (the measure of how acidic or basic a substance is) in the blood. Blood pH is maintained between 7.35 and 7.45, which is slightly basic. Even a slight change in blood pH can affect body functions. Recall that acidic conditions can cause protein denaturation, which stops proteins from functioning. The body has several systems that hold the blood pH within the normal range to prevent this from happening. One of these is the circulating albumin. Albumin is slightly acidic, and because it is negatively charged it balances the many positively charged molecules, such as protons (H+), calcium, potassium, and magnesium which are also circulating in the blood. Albumin acts as a buffer against abrupt changes in the concentrations of these molecules, thereby balancing blood pH and maintaining the status quo. The protein hemoglobin also participates in acid-base balance by binding and releasing protons.

Transport

Albumin and hemoglobin also play a role in molecular transport. Albumin chemically binds to hormones, fatty acids, some vitamins, essential minerals, and drugs, and transports them throughout the circulatory system. Each red blood cell contains millions of hemoglobin molecules that bind oxygen in the lungs and transport it to all the tissues in the body. A cell’s plasma membrane is usually not permeable to large polar molecules, so to get the required nutrients and molecules into the cell many transport proteins exist in the cell membrane. Some of these proteins are channels that allow particular molecules to move in and out of cells. Others act as one-way taxis and require energy to function.

Protection

Figure 6.12 Antibody Proteins

Antibody proteins

Abagovomab (monoclonal antibody) by Blake C / CC BY-SA 3.0

Figure 6.13 Antigens

Antibody protein structure

Antibody chains by Fred the Oyster / Public Domain

An antibody protein is made up of two heavy chains and two light chains. The variable region, which differs from one antibody to the next, allows an antibody to recognize its matching antigen.

Earlier we discussed that the strong collagen fibers in skin provide it with structure and support. The skin’s dense network of collagen fibers also serves as a barricade against harmful substances. The immune system’s attack and destroy functions are dependent on enzymes and antibodies, which are also proteins. An enzyme called lysozyme is secreted in the saliva and attacks the walls of bacteria, causing them to rupture. Certain proteins circulating in the blood can be directed to build a molecular knife that stabs the cellular membranes of foreign invaders. The antibodies secreted by the white blood cells survey the entire circulatory system looking for harmful bacteria and viruses to surround and destroy. Antibodies also trigger other factors in the immune system to seek and destroy unwanted intruders.

Wound Healing and Tissue Regeneration

Proteins are involved in all aspects of wound healing, a process that takes place in three phases: inflammatory, proliferative, and remodeling. For example, if you were sewing and pricked your finger with a needle, your flesh would turn red and become inflamed. Within a few seconds bleeding would stop. The healing process begins with proteins such as bradykinin, which dilate blood vessels at the site of injury. An additional protein called fibrin helps to secure platelets that form a clot to stop the bleeding. Next, in the proliferative phase, cells move in and mend the injured tissue by installing newly made collagen fibers. The collagen fibers help pull the wound edges together. In the remodeling phase, more collagen is deposited, forming a scar. Scar tissue is only about 80 percent as functional as normal uninjured tissue. If a diet is insufficient in protein, the process of wound healing is markedly slowed.

While wound healing takes place only after an injury is sustained, a different process called tissue regeneration is ongoing in the body. The main difference between wound healing and tissue regeneration is in the process of regenerating an exact structural and functional copy of the lost tissue. Thus, old, dying tissue is not replaced with scar tissue but with brand new, fully functional tissue. Some cells (such as skin, hair, nails, and intestinal cells) have a very high rate of regeneration, while others, (such as heart-muscle cells and nerve cells) do not regenerate at any appreciable levels. Tissue regeneration is the creation of new cells (cell division), which requires many different proteins including enzymes that synthesize RNA and proteins, transport proteins, hormones, and collagen. In a hair follicle, cells divide and a hair grows in length. Hair growth averages 1 centimeter per month and fingernails about 1 centimeter every one hundred days. The cells lining the intestine regenerate every three to five days. Protein-inadequate diets impair tissue regeneration, causing many health problems including impairment of nutrient digestion and absorption and, most visibly, hair and nail growth.

Energy Production

Some of the amino acids in proteins can be disassembled and used to make energy (Figure 6.14 “Amino Acids Used for Energy”). Only about 10 percent of dietary proteins are catabolized each day to make cellular energy. The liver is able to break down amino acids to the carbon skeleton, which can then be fed into the citric acid cycle. This is similar to the way that glucose is used to make ATP. If a person’s diet does not contain enough carbohydrates and fats their body will use more amino acids to make energy, which compromises the synthesis of new proteins and destroys muscle proteins. Alternatively, if a person’s diet contains more protein than the body needs, the extra amino acids will be broken down and transformed into fat.


Figure 6.14 Amino Acids Used for Energy

Image by Allison Calabrese / CC BY 4.0

Diseases Involving Proteins

As you may recall, moderation refers to having the proper amount of a nutrient—having neither too little nor too much. A healthy diet incorporates all nutrients in moderation. Low protein intake has several health consequences, and a severe lack of protein in the diet eventually causes death. Although severe protein deficiency is a rare occurrence in children and adults in the United States, it is estimated that more than half of the elderly in nursing homes are protein-deficient. The Acceptable Macronutrient Distribution Range (AMDR) for protein for adults is between 10 and 35 percent of kilocalories, which is a fairly wide range. The percent of protein in the diet that is associated with malnutrition and its health consequences is less than 10 percent, but this is often accompanied by deficiencies in calories and other micronutrients. In this section we will discuss the health consequences of protein intake that is either too low to support life’s processes or too high, thereby increasing the risk of chronic disease. In the last section of this chapter, we will discuss in more detail the personal choices you can make to optimize your health by consuming the right amount of high-quality protein.

Health Consequences of Protein Deficiency

Although severe protein deficiency is rare in the developed world, it is a leading cause of death in children in many poor, underdeveloped countries. There are two main syndromes associated with protein deficiencies: Kwashiorkor and Marasmus. Kwashiorkor affects millions of children worldwide. When it was first described in 1935, more than 90 percent of children with Kwashiorkor died. Although the associated mortality is slightly lower now, most children still die after the initiation of treatment. The name Kwashiorkor comes from a language in Ghana and means, “rejected one.” The syndrome was named because it occurred most commonly in children who had recently been weaned from the breast, usually because another child had just been born. Subsequently the child was fed watery porridge made from low-protein grains, which accounts for the low protein intake. Kwashiorkor is characterized by swelling (edema) of the feet and abdomen, poor skin health, growth retardation, low muscle mass, and liver malfunction. Recall that one of protein’s functional roles in the body is fluid balance. Diets extremely low in protein do not provide enough amino acids for the synthesis of albumin. One of the functions of albumin is to hold water in the blood vessels, so having lower concentrations of blood albumin results in water moving out of the blood vessels and into tissues, causing swelling. The primary symptoms of Kwashiorkor include not only swelling, but also diarrhea, fatigue, peeling skin, and irritability. Severe protein deficiency in addition to other micronutrient deficiencies, such as folate (vitamin B9), iodine, iron, and vitamin C all contribute to the many health manifestations of this syndrome.

Figure 6.15 A Young Boy With Kwashiorkor

Boy with Kwashiorkor disease sitting in chair

Source: Photo courtesy of the Centers for Disease Control and Prevention (CDC).

Kwashiorkor is a disease brought on by a severe dietary protein deficiency. Symptoms include edema of legs and feet, light-colored, thinning hair, anemia, a pot-belly, and shiny skin.

Children and adults with marasmus neither have enough protein in their diets nor do they take in enough calories. Marasmus affects mostly children below the age of one in poor countries. Body weights of children with Marasmus may be up to 80 percent less than that of a normal child of the same age. Marasmus is a Greek word, meaning “starvation.” The syndrome affects more than fifty million children under age five worldwide. It is characterized by an extreme emaciated appearance, poor skin health, and growth retardation. The symptoms are acute fatigue, hunger, and diarrhea.

Figure 6.16 Children With Marasmus

Children with marasmus disease

Japanese nurse with dependent children having typical appearance of malnutrition, New Bilibid Prison, September-October 1945 by Unknown / Public Domain

Kwashiorkor and marasmus often coexist as a combined syndrome termed marasmic kwashiorkor. Children with the combined syndrome have variable amounts of edema and the characterizations and symptoms of marasmus. Although organ system function is compromised by undernutrition, the ultimate cause of death is usually infection. Undernutrition is intricately linked with suppression of the immune system at multiple levels, so undernourished children commonly die from severe diarrhea and/or pneumonia resulting from bacterial or viral infection. The United Nations Children’s Fund (UNICEF), the most prominent agency with the mission of changing the world to improve children’s lives, reports that undernutrition causes at least one-third of deaths of young children. As of 2008, the prevalence of children under age five who were underweight was 26 percent. The percentage of underweight children has declined less than 5 percent in the last eighteen years despite the Millennium Development Goal of halving the proportion of people who suffer from hunger by the year 2015.

Figure 6.17 Causes Of Death For Children Under The Age Of Five, Worldwide

Pie graph of the causes of death for children

Health Consequences of Too Much Protein in the Diet

An explicit definition of a high-protein diet has not yet been developed by the Food and Nutrition Board of the Institute of Medicine (IOM), but typically diets high in protein are considered as those that derive more than 30 percent of calories from protein. Many people follow high-protein diets because marketers tout protein’s ability to stimulate weight loss. It is true that following high-protein diets increases weight loss in some people. However the number of individuals that remain on this type of diet is low and many people who try the diet and stop regain the weight they had lost. Additionally, there is a scientific hypothesis that there may be health consequences of remaining on high-protein diets for the long-term, but clinical trials are ongoing or scheduled to examine this hypothesis further. As the high-protein diet trend arose so did the intensely debated issue of whether there are any health consequences of eating too much protein. Observational studies conducted in the general population suggest diets high in animal protein, specifically those in which the primary protein source is red meat, are linked to a higher risk for kidney stones, kidney disease, liver malfunction, colorectal cancer, and osteoporosis. However, diets that include lots of red meat are also high in saturated fat and cholesterol and sometimes linked to unhealthy lifestyles, so it is difficult to conclude that the high protein content is the culprit.

High protein diets appear to only increase the progression of kidney disease and liver malfunction in people who already have kidney or liver malfunction, and not to cause these problems. However, the prevalence of kidney disorders is relatively high and underdiagnosed. In regard to colon cancer, an assessment of more than ten studies performed around the world published in the June 2011 issue of PLoS purports that a high intake of red meat and processed meat is associated with a significant increase in colon cancer risk.Chan DS, Lau R, et al. Red and Processed Meat and Colorectal Cancer Incidence: Meta-Analysis of Prospective Studies. PLoS One. 2011; 6(6), e20456. http://dx.plos.org/10.1371/journal.pone.0020456. Accessed September 30, 2017.Although there are a few ideas, the exact mechanism of how proteins, specifically those in red and processed meats, causes colon cancer is not known and requires further study.

Some scientists hypothesize that high-protein diets may accelerate bone-tissue loss because under some conditions the acids in protein block absorption of calcium in the gut, and, once in the blood, amino acids promote calcium loss from bone; however even these effects have not been consistently observed in scientific studies. Results from the Nurses’ Health Study suggest that women who eat more than 95 grams of protein each day have a 20 percent higher risk for wrist fracture.Protein: The Bottom Line. Harvard School of Public Health.The Nutrition Source. http://www.hsph.harvard.edu/nutritionsource/what-should-you-eat/protein/.Published 2012. Accessed September 28, 2017.Barzel US, Massey LK. Excess Dietary Protein Can Adversely Affect Bone. J Nutr. 1998; 128(6), 1051–53. http://jn.nutrition.org/content/128/6/1051.long. Accessed September 28, 2017.

Other studies have not produced consistent results. The scientific data on high protein diets and increased risk for osteoporosis remains highly controversial and more research is needed to come to any conclusions about the association between the two.St. Jeor ST, et al. Dietary Protein and Weight Reduction: A Statement for Healthcare Professionals from the Nutrition Committee of the Council on Nutrition, Physical Activity, and Metabolism of the American Heart Association. Circulation. 2001; 104, 1869–74. http://circ.ahajournals.org/cgi/pmidlookup?view=long&pmid=11591629. Accessed September 28, 2017.

High-protein diets can restrict other essential nutrients. The American Heart Association (AHA) states that “High-protein diets are not recommended because they restrict healthful foods that provide essential nutrients and do not provide the variety of foods needed to adequately meet nutritional needs. Individuals who follow these diets are therefore at risk for compromised vitamin and mineral intake, as well as potential cardiac, renal, bone, and liver abnormalities overall.”St. Jeor ST, et al. Dietary Protein and Weight Reduction: A Statement for Healthcare Professionals from the Nutrition Committee of the Council on Nutrition, Physical Activity, and Metabolism of the American Heart Association. Circulation. 2001; 104, 1869–74. http://circ.ahajournals.org/cgi/pmidlookup?view=long&pmid=11591629. Accessed September 28, 2017.

As with any nutrient, protein must be eaten in proper amounts. Moderation and variety are key strategies to achieving a healthy diet and need to be considered when optimizing protein intake. While the scientific community continues its debate about the particulars regarding the health consequences of too much protein in the diet, you may be wondering just how much protein you should consume to be healthy. Read on to find out more about calculating your dietary protein recommendations, dietary protein sources, and personal choices about protein.

Proteins in a Nutshell


Sprinter at the starting line

Image by Braden Collum on unsplash.com / CC0

Proteins are long chains of amino acids folded into precise structures that determine their functions, which are in the tens of thousands. They are the primary construction materials of the body serving as building blocks for bone, skin, hair, muscle, hormones, and antibodies. Without them we cannot breakdown or build macromolecules, grow, or heal from a wound. Too little protein impairs bodily functions and too much can lead to chronic disease. Eat proteins in moderation, at least 10 percent of the calories you take in and not more than 35 percent. Proteins are in a variety of foods. More complete sources are in animal-based foods, but choose those low in saturated fat and cholesterol. Some plant-based foods are also complete protein sources and don’t add much to your saturated fat or cholesterol intake. Incomplete protein sources can easily be combined in the daily diet and provide all of the essential amino acids at adequate levels. Growing children and the elderly need to ensure they get enough protein in their diet to help build and maintain muscle strength. Even if you’re a hardcore athlete, get your proteins from nutrient-dense foods as you need more than just protein to power up for an event. Nuts are one nutrient-dense food with a whole lot of protein. One ounce of pistachios, which is about fifty nuts, has the same amount of protein as an egg and contains a lot of vitamins, minerals, healthy polyunsaturated fats, and antioxidants. Moreover, the FDA says that eating one ounce of nuts per day can lower your risk for heart disease. Can you be a hardcore athlete and a vegetarian?

The analysis of vegetarian diets by the Dietary Guidelines Advisory Committee (DGAC) did not find professional athletes were inadequate in any nutrients, but did state that people who obtain proteins solely from plants should make sure they consume foods with vitamin B12, vitamin D, calcium, omega-3 fatty acids, and choline. Iron and zinc may also be of concern especially for female athletes. Being a vegetarian athlete requires that you pay more attention to what you eat, however this is also a true statement for all athletes. For an exhaustive list that provides the protein, calcium, cholesterol, fat, and fiber content, as well as the number of calories, of numerous foods, go to the website, http://www.soystache.com/protein.htm.

Everyday Connection

Getting All the Nutrients You Need—The Plant-Based Way

Below are five ways to assure you are getting all the nutrients needed on a plant-based diet;

  • Get your protein from foods such as soybeans, tofu, tempeh, lentils, and beans, beans, and more beans. Many of these foods are high in zinc too.
  • Eat foods fortified with vitamins B12 and D and calcium. Some examples are soy milk and fortified cereals.
  • Get enough iron in your diet by eating kidney beans, lentils, whole-grain cereals, and leafy green vegetables.
  • To increase iron absorption, eat foods with vitamin C at the same time.
  • Don’t forget that carbohydrates and fats are required in your diet too, especially if you are training. Eat whole-grain breads, cereals, and pastas. For fats, eat an avocado, add some olive oil to a salad or stir-fry, or spread some peanut or cashew butter on a bran muffin.

Proteins, Diet, and Personal Choices

We have discussed what proteins are, how they are made, how they are digested and absorbed, the many functions of proteins in the body, and the consequences of having too little or too much protein in the diet. This section will provide you with information on how to determine the recommended amount of protein for you, and your many choices in designing an optimal diet with high-quality protein sources.

How Much Protein Does a Person Need in Their Diet?

The recommendations set by the IOM for the Recommended Daily Allowance (RDA) and AMDR for protein for different age groups are listed in Table 6.2 “Dietary Reference Intakes for Protein”. A Tolerable Upper Intake Limit for protein has not been set, but it is recommended that you do not exceed the upper end of the AMDR.

Table 6.2 Dietary Reference Intakes for Protein

Age Group RDA (g/day) AMDR (% calories)
Infants (0–6 mo) 9.1* Not determined
Infants (7–12 mo) 11.0 Not determined
Children (1–3) 13.0 5–20
Children (4–8) 19.0 10–30
Children (9–13) 34.0 10–30
Males (14–18) 52.0 10–30
Females (14–18) 46.0 10–30
Adult Males (19+) 56.0 10–35
Adult Females (19+) 46.0 10–35
* Denotes Adequate Intake

Source: Dietary Reference Intakes: Macronutrients. Dietary Reference Intakes for Energy, Carbohydrate, Fiber, Fat, Fatty Acids, Cholesterol, Protein, and Amino Acids. Institute of Medicine. September 5, 2002. Accessed September 28, 2017.

Protein Input = Protein Used by the Body + Protein Excreted

The appropriate amount of protein in a person’s diet is that which maintains a balance between what is taken in and what is used. The RDAs for protein were determined by assessing nitrogen balance. Nitrogen is one of the four basic elements contained in all amino acids. When proteins are broken down and amino acids are catabolized, nitrogen is released. Remember that when the liver breaks down amino acids, it produces ammonia, which is rapidly converted to nontoxic, nitrogen-containing urea, which is then transported to the kidneys for excretion. Most nitrogen is lost as urea in the urine, but urea is also excreted in the feces. Proteins are also lost in sweat and as hair and nails grow. The RDA, therefore, is the amount of protein a person should consume in their diet to balance the amount of protein used up and lost from the body. For healthy adults, this amount of protein was determined to be 0.8 grams of protein per kilogram of body weight. You can calculate your exact recommended protein intake per day based on your weight by using the following equation:

(Weight in lbs. ÷ 2.2 lb/kg) × 0.8 g/kg

Note that if a person is overweight, the amount of dietary protein recommended can be overestimated.

The IOM used data from multiple studies that determined nitrogen balance in people of different age groups to calculate the RDA for protein. A person is said to be in nitrogen balance when the nitrogen input equals the amount of nitrogen used and excreted. A person is in negative nitrogen balance when the amount of excreted nitrogen is greater than that consumed, meaning that the body is breaking down more protein to meet its demands. This state of imbalance can occur in people who have certain diseases, such as cancer or muscular dystrophy. Someone who has a low-protein diet may also be in negative nitrogen balance as they are taking in less protein than what they actually need. Positive nitrogen balance occurs when a person excretes less nitrogen than what is taken in by the diet, such as during child growth or pregnancy. At these times the body requires more protein to build new tissues, so more of what gets consumed gets used up and less nitrogen is excreted. A person healing from a severe wound may also be in positive nitrogen balance because protein is being used up to repair tissues.

Dietary Sources of Protein

The protein food group consists of foods made from meat, seafood, poultry, eggs, soy, dry beans, peas, and seeds. According to the Harvard School of Public Health, “animal protein and vegetable protein probably have the same effects on health. It’s the protein package that’s likely to make a difference.”Protein: The Bottom Line. Harvard School of Public Health. The Nutrition Source. http://www.hsph.harvard.edu/nutritionsource/what-should-you-eat/protein/. Published 2012. Accessed September 30, 2017.

Simply put, different protein sources differ in their additional components, so it is necessary to pay attention to the whole nutrient “package.” Protein-rich animal-based foods commonly have high amounts of B vitamins, vitamin E, iron, magnesium, and zinc. Seafood often contains healthy fats, and plant sources of protein contain a high amount of fiber. Some animal-based protein-rich foods have an unhealthy amount of saturated fat and cholesterol. When choosing your dietary sources of protein, take note of the other nutrients and also the non-nutrients, such as cholesterol, dyes, and preservatives, in order to make good selections that will benefit your health. For instance, a hamburger patty made from 80 percent lean meat contains 22 grams of protein, 5.7 grams of saturated fat, and 77 milligrams of cholesterol. A burger made from 95 percent lean meat also contains 22 grams of protein, but has 2.3 grams of saturated fat and 60 milligrams of cholesterol. A cup of boiled soybeans contains 29 grams of protein, 2.2 grams of saturated fat, and no cholesterol. For more comparisons of protein-rich foods, see Table 6.3 “Sources of Dietary Protein”. To find out the complete nutrient package of different foods, visit the US Department of Agriculture (USDA) Food Composition Databases.

Table 6.3 Sources of Dietary Protein

Food Protein Content (g) Saturated Fat (g) Cholesterol (mg) Calories
Hamburger patty 3 oz. (80% lean) 22.0 5.7 77 230
Hamburger patty 3 oz. (95% lean) 22.0 2.3 60 139
Top sirloin 3 oz. 25.8 2.0 76 158
Beef chuck 3 oz. (lean, trimmed) 22.2 1.8 51 135
Pork loin 3 oz. 24.3 3.0 69 178
Pork ribs (country style, 1 piece) 56.4 22.2 222 790
Chicken breast (roasted, 1 c.) 43.4 1.4 119 231
Chicken thigh (roasted, 1 thigh) 13.5 1.6 49 109
Chicken leg (roasted, 1 leg) 29.6 4.2 105 264
Salmon 3 oz. 18.8 2.1 54 175
Tilapia 3 oz. 22.2 0.8 48 109
Halibut 3 oz. 22.7 0.4 35 119
Shrimp 3 oz. 17.8 0.2 166 84
Shrimp (breaded, fried, 6–8 pcs.) 18.9 5.4 200 454
Tuna 3 oz. (canned) 21.7 0.2 26 99
Soybeans 1 c. (boiled) 29.0 2.2 0 298
Lentils 1 c. (boiled) 17.9 0.1 0 226
Kidney beans 1 c. (canned) 13.5 0.2 0 215
Sunflower seeds 1 c. 9.6 2.0 0 269

The USDA provides some tips for choosing your dietary protein sources. Their motto is, “Go Lean with Protein”. The overall suggestion is to eat a variety of protein-rich foods to benefit health. The USDA recommends lean meats, such as round steaks, top sirloin, extra lean ground beef, pork loin, and skinless chicken. Additionally, a person should consume 8 ounces of cooked seafood every week (typically as two 4-ounce servings) to assure they are getting the healthy omega-3 fatty acids that have been linked to a lower risk for heart disease. Another tip is choosing to eat dry beans, peas, or soy products as a main dish. Some of the menu choices include chili with kidney and pinto beans, hummus on pita bread, and black bean enchiladas. You could also enjoy nuts in a variety of ways. You can put them on a salad, in a stir-fry, or use them as a topping for steamed vegetables in place of meat or cheese. If you do not eat meat, the USDA has much more information on how to get all the protein you need from a plant-based diet. When choosing the best protein-rich foods to eat, pay attention to the whole nutrient package and remember to select from a variety of protein sources to get all the other essential micronutrients.

Protein Quality

While protein is contained in a wide variety of foods, it differs in quality. High-quality protein contains all the essential amino acids in the proportions needed by the human body. The amino acid profile of different foods is therefore one component of protein quality. Foods that contain some of the essential amino acids are called incomplete protein sources, while those that contain all nine essential amino acids are called complete protein sources, or high-quality protein sources. Foods that are complete protein sources include animal foods such as milk, cheese, eggs, fish, poultry, and meat, and a few plant foods, such as soy and quinoa. The only animal-based protein that is not complete is gelatin, which is made of the protein, collagen.

Figure 6.18 Complete and Incomplete Protein Sources

Chicken, eggs, and nuts on a carving board

Protein-rich Foods by Smastronardo / CC BY-SA 4.0

Examples of complete protein sources include soy, dairy products, meat, and seafood. Examples of incomplete protein sources include legumes and corn.

Most plant-based foods are deficient in at least one essential amino acid and therefore are incomplete protein sources. For example, grains are usually deficient in the amino acid lysine, and legumes are deficient in methionine or tryptophan. Because grains and legumes are not deficient in the same amino acids they can complement each other in a diet. Incomplete protein foods are called complementary foods because when consumed in tandem they contain all nine essential amino acids at adequate levels. Some examples of complementary protein foods are given in Table 6.4 “Complementing Protein Sources the Vegan Way”. Complementary protein sources do not have to be consumed at the same time—as long as they are consumed within the same day, you will meet your protein needs.

Table 6.4 Complementing Protein Sources the Vegan Way

Foods Lacking Amino Acids Complementary Food Complementary Menu
Legumes Methionine, tryptophan Grains, nuts, and seeds Hummus and whole-wheat pita
Grains Lysine, isoleucine, threonine Legumes Cornbread and kidney bean chili
Nuts and seeds Lysine, isoleucine Legumes Stir-fried tofu with cashews

The second component of protein quality is digestibility, as not all protein sources are equally digested. In general, animal-based proteins are completely broken down during the process of digestion, whereas plant-based proteins are not. This is because some proteins are contained in the plant’s fibrous cell walls and these pass through the digestive tract unabsorbed by the body.

Protein Digestibility Corrected Amino Acid Score (PDCAAS)

The PDCAAS is a method adopted by the US Food and Drug Administration (FDA) to determine a food’s protein quality. It is calculated using a formula that incorporates the total amount of amino acids in the food and the amount of protein in the food that is actually digested by humans. The food’s protein quality is then ranked against the foods highest in protein quality. Milk protein, egg whites, whey, and soy all have a ranking of one, the highest ranking. Other foods’ ranks are listed in Table 6.5 “PDCAAS of Various Foods”.

Table 6.5 PDCAAS of Various Foods

Food PDCAAS*
Milk protein 1.00
Egg white 1.00
Whey 1.00
Soy protein 1.00
Beef 0.92
Soybeans 0.91
Chickpeas 0.78
Fruits 0.76
Vegetables 0.73
Whole wheat 0.42
*1 is the highest rank, 0 is the lowest

Protein Needs: Special Considerations

Some groups may need to examine how to meet their protein needs more closely than others. We will take a closer look at the special protein considerations for vegetarians, the elderly, and athletes.

Vegetarians and Vegans

People who follow variations of the vegetarian diet and consume eggs and/or dairy products can meet their protein requirements by consuming adequate amounts of these foods. Vegetarians and vegans can also attain their recommended protein intakes if they give a little more attention to high-quality plant-based protein sources. However, when following a vegetarian diet, the amino acid lysine can be challenging to acquire. Grains, nuts, and seeds are lysine-poor foods, but tofu, soy, quinoa, and pistachios are all good sources of lysine. Following a vegetarian diet and getting the recommended protein intake is also made a little more difficult because the digestibility of plant-based protein sources is lower than the digestibility of animal-based protein.

To begin planning a more plant-based diet, start by finding out which types of food you want to eat and in what amounts you should eat them to ensure that you get the protein you need. The Dietary Guidelines Advisory Committee (DGAC) has analyzed how three different, plant-based dietary patterns can meet the recommended dietary guidelines for all nutrients.Jacobs DR, et al. Food, Plant Food, and Vegetarian Diets in the US Dietary Guidelines: Conclusions of an Expert Panel. Am J Clin Nutr. 2009; 89(5). http://ajcn.nutrition.org/content/89/5/1549S.short.

The diets are defined in the following manner:

These diets are analyzed and compared to the more common dietary pattern of Americans, which is referred to as the USDA Base Diet. Table 6.6 “Percentage of “Meat and Beans Group” Components in the USDA Base Diet, and Three Vegetarian Variations” and Table 7.7 “Proportions of Milk Products and Calcium-Fortified Soy Products in the Base USDA Patterns and Three Vegetarian Variations” can be used to help determine what percentage of certain foods to eat when following a different dietary pattern. The percentages of foods in the different groups are the proportions consumed by the population, so that, on average, Americans obtain 44.6 percent of their foods in the meat and beans group from meats. If you choose to follow a lacto-ovo vegetarian diet, the meats, poultry, and fish can be replaced by consuming a higher percentage of soy products, nuts, seeds, dry beans, and peas. As an aside, the DGAC notes that these dietary patterns may not exactly align with the typical diet patterns of people in the United States. However, they do say that they can be adapted as a guide to develop a more plant-based diet that does not significantly affect nutrient adequacy.

Table 6.6 Percentage of “Meat and Beans Group” Components in the USDA Base Diet, and Three Vegetarian Variations

Food Category Base USDA (%) Plant-Based (%) Lacto-Ovo Vegetarian (%) Vegan (%)
Meats 44.6 10.5 0 0
Poultry 27.9 8.0 0 0
Fish (high omega-3) 2.2 3.0 0 0
Fish (low omega-3) 7.1 10.0 0 0
Eggs 7.9 7.6 10.0 0
Soy products 0.9 15.0 30.0 25.0
Nuts and seeds 9.4 20.9 35.0 40.0
Dry beans and peas n/a* 25.0 25.0 35.0
Total 100.0 100.0 100.0 100.0

*The dry beans and peas are in the vegetable food group of the base diet.
Source:  Vegetarian Food Patterns: Food Pattern Modeling Analysis. US Department of Agriculture. Appendix E-3.3. http://www.cnpp.usda.gov/Publications/DietaryGuidelines/2010/DGAC/Report/AppendixE-3-3-Vegetarian.pdf. Accessed September 28, 2017.

Table 6.7 Proportions of Milk Products and Calcium-Fortified Soy Products in the Base USDA Patterns and Three Vegetarian Variations

Food Category Base USDA (%) Plant-based (%) Lacto-ovo vegetarian (%) Vegan (%)
Fluid milk 54.6 54.6 54.6 0
Yogurt 1.6 1.6 1.6 0
Cheese 42.7 42.7 42.7 0
Soy milk (w/ calcium) 1.1 1.1 1.1 67.0
Rice milk (w/ calcium) 0 0 0 16.0
Tofu (w/ calcium) 0 0 0 15.0
Soy yogurt 0 0 0 2.0
Total 100.0 100.0 100.0 100.0

Source: Vegetarian Food Patterns: Food Pattern Modeling Analysis. US Department of Agriculture. Appendix E-3.3. http://www.cnpp.usda.gov/Publications/DietaryGuidelines/2010/DGAC/Report/AppendixE-3-3-Vegetarian.pdf. Accessed September 28, 2017.

From these analyses the DGAC concluded that the plant-based, lacto-ovo vegetarian, and vegan diets do not significantly affect nutrient adequacy. Additionally, the DGAC states that people who choose to obtain proteins solely from plants should include foods fortified with vitamins B12, D, and calcium. Other nutrients of concern may be omega-3 fatty acids and choline.

The Elderly

As we age, muscle mass gradually declines. This is a process referred to as sarcopenia. A person is sarcopenic when their amount of muscle tissue is significantly lower than the average value for a healthy person of the same age. A significantly lower muscle mass is associated with weakness, movement disorders, and a generally poor quality of life. It is estimated that about half the US population of men and women above the age of eighty are sarcopenic. A review published in the September 2010 issue of Clinical Intervention in Aging demonstrates that higher intakes (1.2 to 1.5 grams per kilogram of weight per day) of high-quality protein may prevent aging adults from becoming sarcopenic.Waters DL, et al. Advantages of Dietary, Exercise-Related, and Therapeutic Interventions to Prevent and Treat Sarcopenia in Adult Patients: An Update. Clin Interv Aging. 2010; 5, 259–70. http://www.ncbi.nlm.nih.gov/pmc/articles/PMC2938033/?tool=pubmed. Accessed September 28, 2017.

Currently, the RDA for protein for elderly persons is the same as that for the rest of the adult population, but several clinical trials are ongoing and are focused on determining the amount of protein in the diet that prevents the significant loss of muscle mass specifically in older adults.

Athletes

Muscle tissue is rich in protein composition and has a very high turnover rate. During exercise, especially when it is performed for longer than two to three hours, muscle tissue is broken down and some of the amino acids are catabolized to fuel muscle contraction. To avert excessive borrowing of amino acids from muscle tissue to synthesize energy during prolonged exercise, protein needs to be obtained from the diet. Intense exercise, such as strength training, stresses muscle tissue so that afterward, the body adapts by building bigger, stronger, and healthier muscle tissue. The body requires protein post-exercise to accomplish this. The IOM does not set different RDAs for protein intakes for athletes, but the AND, the American College of Sports Medicine, and Dietitians of Canada have the following position statementsAmerican College of Sports Medicine, Academy of Nutrition and Dietetics, and Dietitians of Canada. Joint Position Statement: Nutrition and Athletic Performance. Med Sci Sports Exerc. 2009; 41(3), 709-31. http://journals.lww.com/acsm-msse/fulltext/2009/03000/Nutrition_and_Athletic_Performance.27.aspx. Accessed September 28, 2017.:

Nitrogen balance studies suggest that dietary protein intake necessary to support nitrogen balance in endurance athletes ranges from 1.2 to 1.4 grams per kilogram of body weight per day.
Recommended protein intakes for strength-trained athletes range from approximately 1.2 to 1.7 grams per kilogram of weight per day.

An endurance athlete who weighs 170 pounds should take in 93 to 108 grams of protein per day (170 ÷ 2.2 × 1.2 and 170 ÷ 2.2 × 1.4). On a 3,000-kilocalorie diet, that amount is between 12 and 14 percent of total kilocalories and within the AMDR. There is general scientific agreement that endurance and strength athletes should consume protein from high-quality sources, such as dairy, eggs, lean meats, or soy; however eating an excessive amount of protein at one time does not further stimulate muscle-protein synthesis. Nutrition experts also recommend that athletes consume some protein within one hour after exercise to enhance muscle tissue repair during the recovery phase, but some carbohydrates and water should be consumed as well. The recommended ratio from nutrition experts for exercise-recovery foods is 4 grams of carbohydrates to 1 gram of protein.

Table 6.8 Snacks for Exercise Recovery

Foods Protein (g) Carbohydrates (g) Calories
Whole grain cereal with nonfat milk 14 53 260
Medium banana with nonfat milk 10 39 191
Power bar 10 43 250

In response to hard training, a person’s body also adapts by becoming more efficient in metabolizing nutrient fuels both for energy production and building macromolecules. However, this raises another question: if athletes are more efficient at using protein, is it necessary to take in more protein from dietary sources than the average person? There are two scientific schools of thought on this matter. One side believes athletes need more protein and the other thinks the protein requirements of athletes are the same as for nonathletes. There is scientific evidence to support both sides of this debate. The consensus of both sides is that few people exercise at the intensity that makes this debate relevant. It is good to remember that the increased protein intake recommended by the AND, American College of Sports Medicine, and Dietitians of Canada still lies within the AMDR for protein.

Protein Supplements

Protein supplements include powders made from compounds such as whey, soy or amino acids that either come as a powder or in capsules. We have noted that the protein requirements for most people, even those that are active, is not high. Is taking protein supplements ever justified, then? Neither protein nor amino acid supplements have been scientifically proven to improve exercise performance or increase strength. In addition, the average American already consumes more protein than is required. Despite these facts, many highly physically active individuals use protein or amino acid supplements. According to the AND, American College of Sports Medicine, and Dietitians of Canada, “the current evidence indicates that protein and amino acid supplements are no more or no less effective than food when energy is adequate for gaining lean body mass.”American College of Sports Medicine, Academy of Nutrition and Dietetics, and Dietitians of Canada. Joint Position Statement: Nutrition and Athletic Performance. Med Sci Sports Exerc. 2009; 41(3), 709-31. http://journals.lww.com/acsm-msse/fulltext/2009/03000/Nutrition_and_Athletic_Performance.27.aspx. Accessed September 28, 2017.

Branched-chain amino acids, such as leucine, are often touted as a way to build muscle tissue and enhance athletic performance. Despite these marketing claims, a review in the June 2005 issue of The Journal of Nutrition shows that most studies that evaluated a variety of exercise types failed to show any performance-enhancing effects of taking branched-chain amino acids.Gleeson, M. Interrelationship between Physical Activity and Branched-Chain Amino Acids. J Nutr. 2005; 135(6), 1591S–5S. http://jn.nutrition.org/content/135/6/1591S.long. Accessed October 1, 2017.

Moreover, the author of this review claims that high-quality protein foods are a better and cheaper source for branched-chain amino acids and says that a chicken breast (100 grams) contains the equivalent of seven times the amount of branched-chain amino acids as one supplement tablet. This means if you are interested in enhancing exercise performance or building muscle, you do not need to support the $20 billion supplement industry.

Although the evidence for protein and amino acid supplements impacting athletic performance is lacking, there is some scientific evidence that supports consuming high-quality dairy proteins, such as casein and whey, and soy proteins positively influences muscle recovery in response to hard training. If you choose to buy a bucket of whey protein, use it to make a protein shake after an intense workout and do not add more than what is required to obtain 20 to 25 grams of protein. As always, choosing high-quality protein foods will help you build muscle and not empty your wallet as much as buying supplements. Moreover, relying on supplements for extra protein instead of food will not provide you with any of the other essential nutrients. The bottom line is that whether you are an endurance athlete or strength athlete, or just someone who takes Zumba classes, there is very little need to put your money into commercially sold protein and amino acid supplements. The evidence to show that they are superior to regular food in enhancing exercise performance is not sufficient.

What about the numerous protein shakes and protein bars on the market? Are they a good source of dietary protein? Do they help you build muscle or lose weight as marketers claim? These are not such a bad idea for an endurance or strength athlete who has little time to fix a nutritious exercise-recovery snack. However, before you ingest any supplement, do your homework. Read the label, be selective, and don’t use them to replace meals, but rather as exercise-recovery snacks now and then. Some protein bars have a high amount of carbohydrates from added sugars and are not actually the best source for protein, especially if you are not an athlete. Protein bars are nutritionally designed to restore carbohydrates and protein after endurance or strength training; therefore they are not good meal replacements. If you want a low-cost alternative after an intense workout, make yourself a peanut butter sandwich on whole-grain bread and add some sliced banana for less than fifty cents.

Supermarket and health-food store shelves offer an extraordinary number of high-protein shake mixes. While the carbohydrate count is lower now in some of these products than a few years ago, they still contain added fats and sugars. They also cost, on average, more than two dollars per can. If you want more nutritional bang for your buck, make your own shakes from whole foods. Use the AMDRs for macronutrients as a guide to fill up the blender. Your homemade shake can now replace some of the whole foods on your breakfast, lunch, or dinner plate. Unless you are an endurance or strength athlete and consume commercially sold protein bars and shakes only postexercise, these products are not a good dietary source of protein.

VII

Chapter 7. Alcohol

Introduction

Ka wai hoʻomalule kino

The liquid that causes limpness to the body


Image by Allison Calabrese / CC BY 4.0

Learning Objectives

By the end of this chapter, you will be able to:

  • Describe the process of alcohol metabolism
  • Describe the health benefits and health risks associated with alcohol consumption

Alcohol is both a beverage providing some sustenance and a drug. For thousands of years, alcohol has been consumed in a medicinal, celebratory, and ritualistic manner. It is drunk in just about every country and often in excessive amounts. Alcohol can be made from a variety of different starch foods through the processes called fermentation. Fermentation of a starchy food such as barley or wheat can produce ethanol and CO2 which makes up what is commonly known as beer. The Native Hawaiians distilled a mash of fermented ti roots in iron try-pots pre-colonization in the 1700s. This form of alcohol was called “Okolehao”. This alcoholic beverage more commonly known today as “moonshine”, is still made locally in the islands today.Will Hoover. Will New ‘Okolehao be your cup of Ti?. Honolulu Advertiser.com http://the.honoluluadvertiser.com/article/2003/Jun/01/ln/ln05a.html. Published June 1, 2003. Accessed November 10, 2017.

Alcohol is a psychoactive drug. A psychoactive drug is any substance that crosses the blood-brain barrier primarily affecting the functioning of the brain, be it altering mood, thinking, memory, motor control, or behavior. Alcohols in chemistry refer to a group of similar organic compounds, but in beverages the only alcohol consumed is ethanol.

The Behavioral Risk Factor Surveillance System survey reported that more than half of the adult US population drank alcohol in the past thirty days.Alcohol and Public Health. Centers for Disease Control and Prevention. http://www.cdc.gov/alcohol/. Updated March 5, 2012. Accessed October 1, 2017. Of the total population who drank alcohol, approximately 5 percent drank heavily, while 15 percent binge drank. Binge drinking (as defined by the National Institute on Alcohol Abuse and Alcoholism) is when men consume five or more drinks, and when women consume four or more drinks, in two hours or less.Alcohol and Public Health. Centers for Disease Control and Prevention. http://www.cdc.gov/alcohol/. Updated March 5, 2012. Accessed October 1, 2017.

Alcohol in excess is detrimental to health; however since its beginnings it has been suspected and promoted as a benefit to the body and mind when consumed in moderation. In the United States, the Dietary Guidelines define moderate alcohol intake as no more than one drink per day for women and no more than two drinks per day for men.Alcoholic Beverages.US Department of Agriculture and US Department of Health and Human Services.http://www.health.gov/DIETARYGUIDELINES/dga2005/document/html/chapter9.htm. Published 2005. Accessed October 5, 2017. Although drunkenness has pervaded many cultures, drinking in moderation has long been a mantra of multiple cultures with access to alcohol.

More than 90 percent of ingested alcohol is metabolized in the liver. The remaining amount stays in the blood and is eventually excreted through the breath (which is how Breathalyzers work), urine, saliva, and sweat. The blood alcohol concentration (BAC) is measured in milligrams percent, comparing units of alcohol to units of blood. BAC is a measurement used legally to assess intoxication and the impairment and ability to perform certain activities, as in driving a car. As a general rule, the liver can metabolize one standard drink (defined as 12 ounces of beer, 5 ounces of wine, or 1 ½ ounces of hard liquor) per hour. Drinking more than this, or more quickly, will cause BAC to rise to potentially unsafe levels. Table 10.1 “Mental and Physical Effects of Different BAC Levels” summarizes the mental and physical effects associated with different BAC levels.


Table 7.1 Mental and Physical Effects of Different BAC Levels

BAC Percent Typical Effects
0.02 Some loss of judgment, altered mood, relaxation, increased body warmth
0.05 Exaggerated behavior, impaired judgment, may have some loss of muscle control (focusing eyes), usually good feeling, lowered alertness, release of inhibition
0.08 Poor muscle coordination (balance, speech, vision, reaction time), difficulty detecting danger, and impaired judgment, self-control, reasoning, and memory
0.10 Clear deterioration of muscle control and reaction time, slurred speech, poor coordination, slowed thinking
0.15 Far less muscle control than normal, major loss of balance, vomiting

In addition to the one drink per hour guideline, the rate at which an individual’s BAC rises is affected by the following factors:

Alcohol Metabolism

Image by Serge Esteve on unsplash.com / CC0 

Giving the liver enough time to fully metabolize the ingested alcohol is the only effective way to avoid alcohol toxicity. Drinking coffee or taking a shower will not help. The legal limit for intoxication is a BAC of 0.08. Taking into account the rate at which the liver metabolizes alcohol after drinking stops, and the alcohol excretion rate, it takes at least five hours for a legally intoxicated person to achieve sobriety.

Figure 7.1 Alcohol Metabolism Summary

Image by Allison Calabrese / CC BY 4.0

Ethanol Consumption

Distilled spirits have exceptionally few nutrients, but beer and wine do provide some nutrients, vitamins, minerals, and beneficial plant chemicals along with calories. A typical beer is 150 kilocalories, a glass of wine contains approximately 80 kilocalories, and an ounce of hard liquor (without mixer) is around 65 kilocalories.

As a person starts drinking alcohol, up to 5% of the ingested ethanol is directly absorbed and metabolized by some of cells of the gastrointestinal tract (the mouth, tongue, esophagus and stomach). Up to 100% of the remaining ethanol travels in circulation. This is one reason why blood tests are more accurate in measuring alcohol levels.

The lungs and kidneys will excrete about 2% to 10% of this circulatory ethanol. The more you drink the more quick trips to the restroom. The human body dehydrates as a result of these frequent trips to the restroom. This dehydration affects every single cell in your body, including your brain cells. This is the cause of the so-called “morning hangover”. Do not take Tylenol (acetaminophen). Alcohol metabolism activates an enzyme that transforms acetaminophen into a toxic metabolite that causes liver inflammation and damage. Liver damage may not be irreversible. Instead, drink water with electrolytes or sport drinks to rehydrate the body’s cells.

Alcohol is a volatile (flammable) organic substance and can be converted to a gas. The lungs exhale alcohol as a gas. The more alcohol consumed, the stronger the smell of alcohol in a person’s breathe. Breathalyzer tests measure the exhaled alcohol levels in the lungs to determine the state of inebriation.

The liver metabolizes up to 85% – 98% of the circulatory ethanol. The liver uses two metabolic processes to get rid of this circulatory ethanol as quickly and safely as possible.

  1. Alcohol dehydrogenase system
  2. Microsomal ethanol oxidizing system (MEOS)

Alcohol Dehydrogenase System

About 80 to 90% of the total hepatic ethanol uptake is processed via the alcohol dehydrogenase system.The degradation of ethanol begins in the liver. The enzyme that catalyzes this reaction is called alcohol dehydrogenase. The products from this reaction are acetaldehyde, NADH (a reduced coenzyme that carries electrons from one reaction to another)  and H+ ion. Acetaldehyde is very toxic to the liver and the body’s cells. The moment acetaldehyde is produced; it must be degraded to protect the liver cells. The enzyme that will carry this type of degradation reaction is acetaldehyde dehydrogenase (ALDH). Acetaldehyde dehydrogenase converts acetaldehyde into acetate, a non-toxic molecule.

Microsomal Ethanol Oxidizing System (MEOS)

In a moderate drinker, about 10 to 20% of the total liver ethanol uptake is processed via the microsomal ethanol oxidizing system (MEOS). During periods of heavy drinking, the MEOS system will metabolize most of the excess ethanol ingested. Heavy drinking stimulates the human body to include the MEOS system enzymes to clear ethanol faster from the body.

The MEOS system is also located in the liver. Similar to the Alcohol dehydrogenase system, acetaldehyde dehydrogenase will immediately convert acetaldehyde into acetate, a non-toxic molecule. Other products from this reaction are NADH and H+ ion.

Fate of Acetate

The acetate produced (from the alcohol dehydrogenase system and microsomal ethanol oxidizing system) is either released into circulation or retained inside the liver cells. In the liver cells, acetate is converted to acetyl CoA where it is used to produce other molecules like CO2 or used in the synthesis of fatty acids and cholesterol.


Health Consequences of Alcohol Abuse

Alcoholic drinks in excess contribute to weight gain by substantially increasing caloric intake. However, alcohol displays its two-faced character again in its effects on body weight, making many scientific studies contradictory. Multiple studies show high intakes of hard liquor are linked to weight gain, although this may be the result of the regular consumption of hard liquor with sugary soft drinks, juices, and other mixers. On the other hand drinking beer and, even more so, red wine, is not consistently linked to weight gain and in some studies actually decreases weight gain. The contradictory results of scientific studies that have examined the association of alcohol intake with body weight are partly due to the fact that alcohol contributes calories to the diet. When alcohol is drunk in excess, it reduces the secretion of pancreatic juice and damages the lining of the gastrointestinal system, impairing nutrient digestion and absorption. The impaired digestion and absorption of nutrients in alcoholics contributes to their characteristic “skinniness” and multiple associated micronutrient deficiencies. The most common macronutrient deficiency among alcoholics is water, as it is excreted in excess. Commonly associated micronutrient deficiencies include thiamine, pyridoxine, folate, vitamin A, magnesium, calcium, and zinc. Furthermore, alcoholics typically replace calories from alcohol with those of nutritious foods, sometimes getting 50 percent or more of their daily caloric intake from alcoholic beverages.

Effects of Alcohol Abuse on the Brain

A small amount (up to 10%) of the liver acetaldehyde may accumulate inside the liver cells. As more alcohol is ingested, this stimulates the production of acetaldehyde by both the alcohol dehydrogenase and MEOS systems. As the levels of acetaldehyde increase inside the liver cells with heavy consumption of alcohol, some of the acetaldehyde diffuse into the blood circulation. In circulation, high levels of acetaldehyde cause nausea and vomiting. Vomiting causes more body dehydration and loss of electrolytes. If the dehydration becomes severe enough, this can impair brain function and a person may lose consciousness.

Alcohol can adversely affect nearly every area of the brain. When BAC rises, the central nervous system is depressed. Alcohol disrupts the way nerve cells communicate with each other by interfering with receptors on certain cells. The immediate impact of alcohol on the brain can be seen in the awkwardly displayed symptoms of confusion, blurred vision, slurred speech, and other signs of intoxication. These symptoms will go away once drinking stops, but abusive alcohol consumption over time can lead to long-lasting damage to the brain and nervous system. This is because alcohol and its metabolic byproducts kill brain cells.

Effects of Excessive Alcohol on the Liver

Alcohol stimulates the release of epinephrine from the kidneys. Epinephrine binds to receptors in the liver cells to stimulate the release of glucagon from the pancreas. Glucagon and epinephrine stimulate glycogenolysis in the liver cells. Epinephrine also stimulates the breakdown of triglycerides and glycerol into free fatty acids  in adipose tissue and are released into the bloodstream and travel to the liver.

A portion of these triglycerides are stored in the liver cells; while, the remainder of these triglycerides are converted to very low density lipoprotein (VLDL). The increased accumulation of both stored triglycerides and VLDL particles inside the liver cells causes a condition called fatty liver or hepatic steatosis. This can impair normal liver function. The more alcohol consumed, the more lipids produced and stored inside the liver cells. These effects are cumulative over time.

According to the CDC, 14,406 Americans died from alcohol-related liver diseases in 2007. Although not every alcoholic or heavy drinker will die from liver problems, the liver is one of the body’s main filtering organs and is severely stressed by alcohol abuse. The term Alcoholic Liver Disease (ALD) is used to describe liver problems linked to excessive alcohol intake. ALD can be progressive, with individuals first suffering from a fatty liver and going on to develop cirrhosis. It is also possible to have different forms of ALD at the same time.

Figure 7.2 Liver Cirrhosis

Cirrosi Micronodular by Amanda Alvarez / CC BY SY 4.0 

Excessive alcohol consumption causes the destruction of liver cells. In an attempt to repair itself, the liver initiates an inflammatory and reparation process causing scar tissue to form. In the liver’s attempt to replace the dead cells, surviving liver cells multiply. The result is clusters of newly formed liver cells, also called regenerative nodules, within the scar tissue. This state is called cirrhosis of the liver.

The three most common forms of ALD are:

Figure 7.3 The Progression of ALD

Stages of Liver Damage by National Digestive Diseases Information Clearinghouse / Public Domain

As the liver cells release VLDL particles into circulation, this increases the levels of VLDL particles in blood. As VLDL particles continue to accumulate in blood, this cause a condition called hyperlipidemia. In their journey through circulation, VLDL particles are eventually degraded to low density lipoproteins (LDL) particles. LDL particles are also known as “bad cholesterol”. Higher levels of LDL particles in circulation lead to the build-up of cholesterol deposition plaques inside the walls of the blood vessels (known as atherosclerosis). These plaques can impair or stop blood flow to the cells. If an artery is blocked, the cells cannot make enough energy and eventually stop working. If the artery remains blocked for more than a few minutes, the cells may die. When a cardiac artery is blocked, this causes a heart attack (acute myocardial infarction). Depending on the length and severity of the blockage, damage to the cardiac cells may be permanent and irreversible. Once the heart structure and function is compromised, the more susceptible a patient would be to suffer a second heart attack.

Health Benefits of Moderate Alcohol Intake

In contrast to excessive alcohol intake, moderate alcohol intake has been shown to provide health benefits. The data is most convincing for preventing heart disease in middle-aged and older people. A review of twenty-nine studies concluded that moderate alcohol intake reduces the risk of coronary heart disease by about 30 percent in comparison to those who do not consume alcohol.Ronksley PE, et al. Association of Alcohol Consumption with Selected Cardiovascular Disease Outcomes: A Systematic Review and Meta-Analysis. BMJ. 2011; 342, d671. http://www.bmj.com/content/342/bmj.d671. Accessed October 5, 2017.  

Several other studies demonstrate that moderate alcohol consumption reduces the incidences of stroke and heart attack, and also death caused by cardiovascular and heart disease. The drop in risk for these adverse events ranges between percent. Moreover, there is some scientific evidence that moderate alcohol intake reduces the risk for metabolic syndrome, Type 2 diabetes, and gallstones. In addition to providing some health benefits, moderate alcohol intake also serves as a digestive aid, a source of comfort and relaxation, and inducing social interactions, thereby benefiting all aspects of the health triangle. It has not been clearly demonstrated that moderate alcohol consumption benefits younger populations, and the risks of any alcohol consumption do not outweigh the benefits for pregnant women, those who are taking medications that interact with alcohol, and those who are unable to drink in moderation.

The Reality

Alcohol is a diuretic that results in dehydration. It suppresses the release of antidiuretic hormone and less water is reabsorbed and more is excreted. Drinking alcohol in excess can lead to a “hangover,” of which the majority of symptoms are the direct result of dehydration.

VIII

Chapter 8. Energy

Introduction

Hoʻā ke ahi, kōʻala ke ola

Light the fire for there is life-giving substance


Canoe paddler in a race

Learning Objectives

By the end of this chapter, you will be able to:

  • Describe the body’s use, storage and balance of energy
  • Describe the process of calculating Body Mass Index (BMI)
  • Describe factors that contribute to weight management
  • Identify evidence-based nutritional recommendations

Months and months of training lead up to one of the most prestigious one-man (or woman) outrigger canoe paddling races in the world, the Ka‘iwi Channel Solo World Championship. Athletes from Hawai‘i and across the world paddle from the island of Molokai to Oahu in the Ka‘iwi Channel, whose name carries the meanings of its two core words “the bones.” The channel is said to be one of the most treacherous  bodies of water and depending on the ocean conditions top paddlers finish between 3 1/2 and 6 hours. Paddlers spend hours and hours each week training to physically prepare their bodies and minds for the race but equally important is the refueling that takes place off the water. Each paddler will say they have their own “secret” training nutrition plan which may consist of a specific food or drink they prefer, but the bottom line is that the energy from carbohydrates, protein, and fat they ingest is required to fuel their body for training, recovering and repairing so they are able to continue to perform at high levels. Having a nutrition plan for race day is equally important for achieving peak performance and there are all sorts of products available with claims about digestibility, energy-sustenance, and promises of optimal performance results. Even with all of these highly specified and formulated products many paddlers prefer to rely on what fueled Native Hawaiians and other ancient voyager, poi. Poi, made of watered down pa‘i‘ai or mashed kalo (taro) was considered a voyaging staple and for many paddlers it continues to be. This easily transported food contains water that supports hydration, energy-rich carbohydrates, and for some serves as a connection to their voyaging ancestors, making it a “go-to” for many paddlers as they cross the Ka‘iwi Channel.

Energy is essential to life. Normal function of the human body requires a constant input and output of energy to maintain life. Various chemical components of food provide the input of energy to the body. The chemical breakdown of those chemicals provides the energy needed to carry out thousands of body functions that allow the body to perform daily functions and tasks such as breathing, walking up a flight of steps, and studying for a test.

Energy is classified as either potential or kinetic. Potential energy is stored energy, or energy waiting to happen. Kinetic energy is energy in motion. To illustrate this, think of an Olympic swimmer standing at the pool’s edge awaiting the sound of the whistle to begin the race. While he waits for the signal, he has potential energy. When the whistle sounds and he dives into the pool and begins to swim, his energy is kinetic (in motion).

In food and in components of the human body, potential energy resides in the chemical bonds of specific molecules such as carbohydrates, fats, proteins, and alcohol. This potential energy is converted into kinetic energy in the body that drives many body functions ranging from muscle and nerve function to driving the synthesis of body protein for growth. After potential energy is released to provide kinetic energy, it ultimately becomes thermal energy or heat. You can notice this when you exercise and your body heats up.

The Calorie Is a Unit of Energy

The amount of energy in nutrients or the amount of energy expended by the body can be quantified with a variety of units used to measure energy. In the US, the kilocalorie (kcal) is most commonly used and is often just referred to as a calorie. Strictly speaking, a kcal is 1000 calories. In nutrition, the term calories almost always refers to kcals. Sometimes the kcal is indicated by capitalizing calories as “Calories.”  A kilocalorie is the amount of energy in the form of heat that is required to heat one kilogram of water one degree Celsius.

Most other countries use the kilojoule (kJ) as their standard unit of energy. The Joule is a measure of energy based on work accomplished – the energy needed to produce a specific amount of force. Since calories and Joules are both measures of energy, one can be converted to the other – 1 kcal = 4.18 kJ.

Estimating Caloric Content

The energy contained in energy-yielding nutrients differs because the energy-yielding nutrients are composed of different types of chemical bonds. The carbohydrate or protein in a food yields approximately 4 kilocalories per gram, whereas the triglycerides that compose the fat in a food yield 9 kilocalories per gram. A kilocalorie of energy performs one thousand times more work than a calorie. On the Nutrition Facts panel found on packaged food, the calories listed for a particular food are actually kilocalories.

Estimating the number of calories in commercially prepared food is fairly easy since the total number of calories in a serving of a particular food is listed on the Nutrition Facts panel. If you wanted to know the number of calories in the breakfast you consumed this morning just add up the number of calories in each food. For example, if you ate one serving of yogurt that contained 150 calories, on which you sprinkled half of a cup of low-fat granola cereal that contained 209 calories, and drank a glass of orange juice that contained 100 calories, the total number of calories you consumed at breakfast is 150 + 209 + 100 = 459 calories. If you do not have a Nutrition Facts panel for a certain food, such as a half cup of blueberries, and want to find out the amount of calories it contains, go to Food-a-pedia, a website maintained by the USDA. For more details on food composition data, go to the USDA Food Composition Databases page.

An Organism Requires Energy and Nutrient Input

Energy is required in order to build molecules into larger macromolecules (like proteins), and to turn macromolecules into organelles and cells, which then turn into tissues, organs, and organ systems, and finally into an organism. Proper nutrition provides the necessary nutrients to make the energy that supports life’s processes. Your body builds new macromolecules from the nutrients in food.

Nutrient and Energy Flow

Energy is stored in a nutrient’s chemical bonds. Energy comes from sunlight, which plants capture and, via photosynthesis, use it to transform carbon dioxide in the air into the molecule glucose. When the glucose bonds are broken, energy is released. Bacteria, plants, and animals (including humans) harvest the energy in glucose via a biological process called cellular respiration. In this process oxygen is required and the chemical energy of glucose is gradually released in a series of chemical reactions. Some of this energy is trapped in the molecule adenosine triphosphate (ATP) and some is lost as heat. ATP can be used when needed to drive chemical reactions in cells that require an input of energy. Cellular respiration requires oxygen (aerobic) and it is provided as a byproduct of photosynthesis. The byproducts of cellular respiration are carbon dioxide (CO2) and water, which plants use to conduct photosynthesis again. Thus, carbon is constantly cycling between plants and animals.

Figure 8.1 Energy Flow From Sun to Plants to Animals

Energy flow from sun to plants to animals

Plants harvest energy from the sun and capture it in the molecule glucose. Humans harvest the energy in glucose and capture it into the molecule ATP.

Food Quality

One measurement of food quality is the amount of nutrients it contains relative to the amount of energy it provides. High-quality foods are nutrient dense, meaning they contain lots of nutrients relative to the amount of calories they provide. Nutrient-dense foods are the opposite of “empty-calorie” foods such as carbonated sugary soft drinks, which provide many calories and very little, if any, other nutrients. Food quality is additionally associated with its taste, texture, appearance, microbial content, and how much consumers like it.

The Atom

Cells are the basic building blocks of life, but atoms are the basic building blocks of all matter, living and nonliving. The structural elements of an atom are protons (positively charged), neutrons (no charge), and electrons (negatively charged). Protons and neutrons are contained in the dense nucleus of the atom; the nucleus thus has a positive charge. Because opposites attract, electrons are attracted to this nucleus and move around it in the electron cloud.

Electrons contain energy, and this energy is stored within the charge and movement of electrons and the bonds atoms make with one another. However, this energy is not always stable, depending on the number of electrons within an atom. Atoms are more stable when their electrons orbit in pairs. An atom with an odd number of electrons must have an unpaired electron. In most cases, these unpaired electrons are used to create chemical bonds. A chemical bond is the attractive force between atoms and contains potential energy. By bonding, electrons find pairs and chemicals become part of a molecule.

Bond formation and bond breaking are chemical reactions that involve the movement of electrons between atoms. These chemical reactions occur continuously in the body. We previously reviewed how glucose breaks down into water and carbon dioxide as part of cellular respiration. The energy released by breaking those bonds is used to form molecules of adenosine triphosphate (ATP). Recall how during this process electrons are extracted from glucose in a stepwise manner and transferred to other molecules. Occasionally electrons “escape” and, instead of completing the cellular respiration cycle, are transferred to an oxygen molecule. Oxygen (a molecule with two atoms) with one unpaired electron is known as superoxide (Figure 8.2).

Atoms and molecules such as superoxide that have unpaired electrons are called free radicals; those containing oxygen are more specifically referred to as reactive oxygen species. The unpaired electron in free radicals destabilizes them, making them highly reactive. Other reactive oxygen species include hydrogen peroxide and the hydroxyl radical.

Figure 8.2 Superoxide

Superoxide molecule

Image by DoSiDo / CC BY-SA 3.0

A molecule with one unpaired electron, which makes it a free radical.

The reactivity of free radicals is what poses a threat to macromolecules such as DNA, RNA, proteins, and fatty acids. Free radicals can cause chain reactions that ultimately damage cells. For example, a superoxide molecule may react with a fatty acid and steal one of its electrons. The fatty acid then becomes a free radical that can react with another fatty acid nearby. As this chain reaction continues, the permeability and fluidity of cell membranes changes, proteins in cell membranes experience decreased activity, and receptor proteins undergo changes in structure that either alter or stop their function. If receptor proteins designed to react to insulin levels undergo a structural change it can negatively affect glucose uptake. Free radical reactions can continue unchecked unless stopped by a defense mechanism.

Metabolism Overview

Metabolism is defined as the sum of all chemical reactions required to support cellular function and hence the life of an organism. Metabolism is either categorized as catabolism, referring to all metabolic processes involved in molecule breakdown, or anabolism, which includes all metabolic processes involved in building bigger molecules. Generally, catabolic processes release energy and anabolic processes consume energy. The overall goals of metabolism are energy transfer and matter transport. Energy is transformed from food macronutrients into cellular energy, which is used to perform cellular work. Metabolism transforms the matter of macronutrients into substances a cell can use to grow and reproduce and also into waste products. For example, enzymes are proteins and their job is to catalyze chemical reactions. Catalyze means to speed-up a chemical reaction and reduce the energy required to complete the chemical reaction, without the catalyst being used up in the reaction. Without enzymes, chemical reactions would not happen at a fast enough rate and would use up too much energy for life to exist. A metabolic pathway is a series of enzyme catalyzed reactions that transform the starting material (known as a substrate) into intermediates, that are the substrates for subsequent enzymatic reactions in the pathway, until, finally, an end product is synthesized by the last enzymatic reaction in the pathway. Some metabolic pathways are complex and involve many enzymatic reactions, and others involve only a few chemical reactions.

To ensure cellular efficiency, the metabolic pathways involved in catabolism and anabolism are regulated in concert by energy status, hormones, and substrate and end-product levels. The concerted regulation of metabolic pathways prevents cells from inefficiently building a molecule when it is already available. Just as it would be inefficient to build a wall at the same time as it is being broken down, it is not metabolically efficient for a cell to synthesize fatty acids and break them down at the same time.

Catabolism of food molecules begins when food enters the mouth, as the enzyme salivary amylase initiates the breakdown of the starch in foods. The entire process of digestion converts the large polymers in food to monomers that can be absorbed. Starches are broken down to monosaccharides, lipids are broken down to fatty acids, and proteins are broken down to amino acids. These monomers are absorbed into the bloodstream either directly, as is the case with monosaccharides and amino acids, or repackaged in intestinal cells for transport by an indirect route through lymphatic vessels, as is the case with most fatty acids and other fat-soluble molecules.

Once absorbed, water-soluble nutrients first travel to the liver which controls their passage into the blood that transports the nutrients to cells throughout the body. The fat-soluble nutrients gradually pass from the lymphatic vessels into blood flowing to body cells. Cells requiring energy or building blocks take up the nutrients from the blood and process them in either catabolic or anabolic pathways. The organ systems of the body require fuel and building blocks to perform the many functions of the body, such as digesting, absorbing, breathing, pumping blood, transporting nutrients in and wastes out, maintaining body temperature, and making new cells.

Figure 8.3 Cellular Metabolic Processes

Metabolic pathways of a cell

Energy metabolism refers more specifically to the metabolic pathways that release or store energy. Some of these are catabolic pathways, like glycolysis (the splitting of glucose), β-oxidation (fatty-acid breakdown), and amino acid catabolism. Others are anabolic pathways, and include those involved in storing excess energy (such as glycogenesis), and synthesizing triglycerides (lipogenesis). Table 8.1 “Metabolic Pathways” summarizes some of the catabolic and anabolic pathways and their functions in energy metabolism.

Table 8.1 Metabolic Pathways

Catabolic Pathways Function Anabolic Pathways Function
Glycolysis Glucose breakdown Gluconeogenesis Synthesize glucose
Glycogenolysis Glycogen breakdown Glycogenesis Synthesize glycogen
β-oxidation Fatty-acid breakdown Lipogenesis Synthesize triglycerides
Proteolysis Protein breakdown to amino acids Protein synthesis Synthesize proteins

Catabolism: The Breakdown

All cells are in tune to their energy balance. When energy levels are high cells build molecules, and when energy levels are low catabolic pathways are initiated to make energy. Glucose is the preferred energy source by most tissues, but fatty acids and amino acids also can be catabolized to release energy that can drive the formation of ATP. ATP is a high energy molecule that can drive chemical reactions that require energy. The catabolism of nutrients to release energy can be separated into three stages, each containing individual metabolic pathways. The three stages of nutrient breakdown are the following:

Figure 8.4 ATP Production Pathway

ATP production pathways

The breakdown of glucose begins with glycolysis, which is a ten-step metabolic pathway yielding two ATP per glucose molecule; glycolysis takes place in the cytosol and does not require oxygen. In addition to ATP, the end-products of glycolysis include two three-carbon molecules, called pyruvate. Pyruvate can either be shuttled to the citric acid cycle to make more ATP or follow an anabolic pathway. If a cell is in negative-energy balance, pyruvate is transported to the mitochondria where it first gets one of its carbons chopped off, yielding acetyl-CoA. The breakdown of fatty acids begins with the catabolic pathway, known as β-oxidation, which takes place in the mitochondria. In this catabolic pathway, four enzymatic steps sequentially remove two-carbon molecules from long chains of fatty acids, yielding acetyl-CoA molecules. In the case of amino acids, once the nitrogen is removed from the amino acid the remaining carbon skeleton can be enzymatically converted into acetyl-CoA or some other intermediate of the citric acid cycle. Acetyl-CoA, a two-carbon molecule common to glucose, lipid, and protein metabolism enters the second stage of energy metabolism, the citric acid cycle.

In the citric acid cycle, acetyl-CoA is joined to a four-carbon molecule. In this multistep pathway, two carbons are lost as two molecules of carbon dioxide. The energy obtained from the breaking of chemical bonds in the citric acid cycle is transformed into two more ATP molecules (or equivalents thereof) and high energy electrons that are carried by the molecules, nicotinamide adenine dinucleotide (NADH) and flavin adenine dinucleotide (FADH2). NADH and FADH2 carry the electrons to the inner membrane in the mitochondria where the third stage of energy release takes place, in what is called the electron transport chain. In this metabolic pathway a sequential transfer of electrons between multiple proteins occurs and ATP is synthesized. The entire process of nutrient catabolism is chemically similar to burning, as carbon and hydrogen atoms are  combusted (oxidized) producing carbon dioxide, water, and heat. However, the stepwise chemical reactions in nutrient catabolism pathways slow the oxidation of carbon atoms so that much of the energy is captured and not all transformed into heat and light. Complete nutrient catabolism is between 30 and 40 percent efficient, and some of the energy is therefore released as heat. Heat is a vital product of nutrient catabolism and is involved in maintaining body temperature. If cells were too efficient at trapping nutrient energy into ATP, humans would not last to the next meal, as they would die of hypothermia (excessively low body temperature).

Anabolism: The Building

The energy released by catabolic pathways powers anabolic pathways in the building of macromolecules such as the proteins RNA and DNA, and even entire new cells and tissues. Anabolic pathways are required to build new tissue, such as muscle, after prolonged exercise or the remodeling of bone tissue, a process involving both catabolic and anabolic pathways. Anabolic pathways also build energy-storage molecules, such as glycogen and triglycerides. Intermediates in the catabolic pathways of energy metabolism are sometimes diverted from ATP production and used as building blocks instead. This happens when a cell is in positive-energy balance. For example, the citric-acid-cycle intermediate, α-ketoglutarate can be anabolically processed to the amino acids glutamate or glutamine if they are required. The human body is capable of synthesizing eleven of the twenty amino acids that make up proteins. The metabolic pathways of amino acid synthesis are all inhibited by the specific amino acid that is the end-product of a given pathway. Thus, if a cell has enough glutamine it turns off its synthesis.

Anabolic pathways are regulated by their end-products, but even more so by the energy state of the cell. When there is ample energy, bigger molecules, such as protein, RNA and DNA, will be built as needed. Alternatively, when energy is insufficient, proteins and other molecules will be destroyed and catabolized to release energy. A dramatic example of this is seen in children with marasmus, a form of advanced starvation. These children have severely compromised bodily functions, often culminating in death by infection. Children with marasmus are starving for calories and protein, which are required to make energy and build macromolecules. The negative-energy balance in children who have marasmus results in the breakdown of muscle tissue and tissues of other organs in the body’s attempt to survive. The large decrease in muscle tissue makes children with marasmus look emaciated or “muscle-wasted.”

Figure 8.5 Metabolic Pathway of Gluconeogenesis

Metabolic Pathway of Gluconeogenesis

In a much less severe example, a person is also in negative-energy balance between meals. During this time, blood-glucose levels start to drop. In order to restore blood-glucose levels to their normal range, the anabolic pathway, called gluconeogenesis, is stimulated. Gluconeogenesis is the process of building glucose molecules mostly from certain amino acids and it occurs primarily in the liver (Figure 8.5 “Metabolic Pathway of Gluconeogenesis”). The liver exports the synthesized glucose into the blood for other tissues to use.

Energy Storage

In contrast, in the “fed” state (when energy levels are high), extra energy from nutrients will be stored. Glucose is stored mainly in muscle and liver tissues. In these tissues it is stored as glycogen, a highly branched macromolecule consisting of thousands of glucose molecules held together by chemical bonds. The glucose molecules are joined together by an anabolic pathway called glycogenesis. For each molecule of glucose stored, one molecule of ATP is used. Therefore, it costs energy to store energy. Glycogen levels do not take long to reach their physiological limit and when this happens excess glucose will be converted to fat. A cell in positive-energy balance detects a high concentration of ATP as well as acetyl-CoA produced by catabolic pathways. In response, the rate of catabolism is slowed or shut off and the synthesis of fatty acids, which occurs by an anabolic pathway called lipogenesis, is turned on. The newly made fatty acids are transported to fat-storing cells called adipocytes where they are stored as triglycerides. Fat is a better alternative to glycogen for energy storage as it is more compact (per unit of energy) and, unlike glycogen, the body does not store water along with fat. Water weighs a significant amount, and increased glycogen stores, which are accompanied by water, would dramatically increase body weight. When the body is in positive-energy balance, excess carbohydrates, lipids, and protein can all be metabolized to fat.

Weight Management

Pencil and notebook on table

Photo by Hope House Press on unsplash.com / CC0

“Obesogenic” is a word that has sprung up in the language of public health professionals in the last two decades. The Centers for Disease Control and Prevention (CDC) defines obesogenic as “an environment that promotes increased food intake, non-healthful foods, and physical inactivity.”Obesogenic Environments. Center for Disease Control and Prevention (CDC). https://www.cdc.gov/pcd/issues/2015/14_0559.htm. Published 2013. Accessed September 22, 2017.

The CDC reports that in 2009 in the United States, 33 percent of adults and 16 percent of children were obese, a doubling and tripling of the numbers since 1980, respectively, while in Hawai‘i the obesity rate was 23.8% in 2016 with 40.8% of those individuals being Native Hawaiians.Hawaii State Obesity Data, Rates, and Trends.  The State of Obesity: Better Policies for a Healthier America. https://stateofobesity.org/states/hi/. Published August 2017. Accessed September 22, 2017.

The health consequences of too much body fat are numerous, including increased risks for cardiovascular disease, Type 2 diabetes, and some cancers. The medical costs related to obesity are well over one hundred billion dollars and in Hawai‘i, over $470 million is spent annually.  On the individual level, people who are obese spend $1,429 more per year for medical care than people of healthy weight.

Numerous obesogenic agents that contribute to this immense public health problem have become a part of everyday life in American society. The fast food industry has been growing for decades and continues to grow despite the latest economic slump. In America today there are over twelve thousand McDonald’s restaurants, while in 1960 there was one. Food portions have been getting bigger since the 1960s, and in the 1990s North American society experienced the “super-size” marketing boom, which still endures. Between 1960 and 2000 more than 123 million vehicles were added to the American society. Escalators, elevators, and horizontal walkways now dominate shopping malls and office buildings, factory work has become increasingly mechanized and robotized, the typical American watches more than four hours of television daily, and in many work places the only tools required to conduct work are a chair and a computer. The list of all the societal obesogenic factors goes on and on. They are the result of modernization, industrialization, and urbanization continuing on without individuals, public health officials, or government adequately addressing the concurrent rise in overweight and obesity.

With obesity at epidemic proportions in America it is paramount that policies be implemented or reinforced at all levels of society, and include education, agriculture, industry, urban planning, healthcare, and government. Reversing and stopping obesity are two different things. The former will require much more societal and individual change than the latter. The following are some ideas for constructing an environment in America that promotes health and confronts the obesity epidemic:

Individual Level

Community Level

National Level

Some scientists predict that the childhood obesity rate will reach 100 percent by 2044. It is critical for the nation’s health to change our environment to one that promotes weight loss and/or weight maintenance. However, action is needed on multiple fronts to reverse the obesity epidemic trend within one generation.

In this section  you will learn how to assess body weight and fatness. You will also learn that it is not only society and environment that play a role in body weight and fatness, but also physiology, genetics, and behavior—and that all of them interact. We will also discuss the health risks of being underweight and overweight, learn evidence-based solutions to maintain body weight at the individual level, and assess the current state of affairs of combating the obesity epidemic in the United States.

Balancing Energy Input with Energy Output

Hiker balancing on log

Photo by Jon Flobrant on unsplash.com / CC0

To Maintain Weight, Energy Intake Must Balance Energy Output

Recall that the macronutrients you consume are either converted to energy, stored, or used to synthesize macromolecules. A nutrient’s metabolic path is dependent upon energy balance. When you are in a positive energy balance the excess nutrient energy will be stored or used to grow (e.g., during childhood, pregnancy, and wound healing). When you are in negative energy balance you aren’t taking in enough energy to meet your needs, so your body will need to use its stores to provide energy. Energy balance is achieved when intake of energy is equal to energy expended. Weight can be thought of as a whole body estimate of energy balance; body weight is maintained when the body is in energy balance, lost when it is in negative energy balance, and gained when it is in positive energy balance. In general, weight is a good predictor of energy balance, but many other factors play a role in energy intake and energy expenditure. Some of these factors are under your control and others are not. Let us begin with the basics on how to estimate energy intake, energy requirement, and energy output. Then we will consider the other factors that play a role in maintaining energy balance and hence, body weight.

Estimating Energy Requirement

To maintain body weight you have to balance the calories obtained from food and beverages with the calories expended every day. Here, we will discuss how to calculate your energy needs in kilocalories per day so that you can determine whether your caloric intake falls short, meets, or exceeds your energy needs. The Institute of Medicine has devised a formula for calculating your Estimated Energy Requirement (EER). It takes into account your age, sex, weight, height, and physical activity level (PA). The EER is a standardized mathematical prediction of a person’s daily energy needs in kilocalories per day required to maintain weight. It is calculated for those over 18 years of age via the following formulas:

Adult male: EER = 662 − [9.53 X age (y)] + PA X [15.91 X wt (kg) + 5.39.6 X ht (m)]

Adult female: EER = 354 − [6.91 x age (y)] + PA x [9.36 x wt (kg) + 726 x ht (m)]

Note: to convert pounds to kilograms, divide weight in pounds by 2.2. To convert feet to meters, divide height in feet by 3.3.

Estimating Caloric Intake

To begin your dietary assessment, go to MyPlate, which is available on the US Department of Agriculture (USDA) website: http://www.choosemyplate.gov/.

Table 8.3 Physical Activity (PA) Categories and ValuesDietary Reference Intake Tables.Health Canada. http://www.hc-sc.gc.ca/fn-an/nutrition/reference/table/index-eng.php#eeer. Updated November 29, 2010. Accessed September 22, 2017.

Activity Level Men PA Value Women PA Value Description
Sedentary 1.00 1.00 No physical activity beyond that required for independent living
Low 1.11 1.12 Equivalent to walking 1.5 to 3 miles per day
Moderate 1.25 1.27 Equivalent to walking 3 to 10 miles per day
High 1.48 1.45 Equivalent to walking 10 or more miles per day
These values only apply to normal weight adults and not to children or pregnant or lactating women.

These values only apply to normal weight adults and not to children or pregnant or lactating women.

The numbers within the equations for the EER were derived from measurements taken from a group of people of the same sex and age with similar body size and physical activity level. These standardized formulas are then applied to individuals whose measurements have not been taken, but who have similar characteristics, in order to estimate their energy requirements. Thus, a person’s EER is, as the name suggests, an estimate for an average person of similar characteristics. EER values are different for children, pregnant or lactating women, and for overweight and obese people. Also, remember the EER is calculated based on weight maintenance, not for weight loss or weight gain.

The 2015 Dietary Guidelines provides a table (Table 8.4 “Estimated Daily Calorie Needs”) that gives the estimated daily calorie needs for different age groups of males and females with various activity levels. The Dietary Guidelines also states that while knowing the number of calories you need each day is useful, it is also pertinent to obtain your calories from nutrient-dense foods and consume the various macronutrients in their Acceptable Macronutrient Distribution Ranges (AMDRs) (Table 8.5 “Acceptable Macronutrient Distribution Ranges”).

Table 8.4 Estimated Daily Calorie Needs

Sex Age (years) Sedentary Moderately Active Active
Child (female and male) 2–3 1,000 1,000–1,400 (male)1,000-1,200 (female) 1,000–1,400
Female 4–8 1,200–1,400 1,400–1,600 1,400–1,800
Female 9–13 1,400–1,600 1,600–2,000 1,800–2,200
Female 14–18 1,800 2,000 2,400
Female 19–30 1,800–2,000 2,000–2,200 2,400
Female 31–50 1,800 2,000 2,200
Female 51+ 1,600 1,800 2,000–2,200
Male 4–8 1,200–1,400 1,400–1,600 1,600–2,000
Male 9–13 1,600–2,000 1,800–2,200 2,000–2,600
Male 14–18 2,000–2,400 2,400–2,800 2,800–3,200
Male 19–30 2,400–2,600 2,600–2,800 3,000
Male 31–50 2,200–2,400 2,400–2,600 2,800–3,000
Male 51+ 2,000–2,200 2,200–2,400 2,400–2,800

Source: 2010 Dietary Guidelines for Americans.US Department of Agriculture. http://health.gov/dietaryguidelines/dga2010/DietaryGuidelines2010.pdf. Published 2010. Accessed September 22, 2017.

Table 8.5 Acceptable Macronutrient Distribution Ranges

Age Carbohydrates (% of Calories) Protein (% of Calories) Fat (% of Calories)
Young Children (1–3) 45–65 5–20 30–40
Older children/adolescents (4–18) 45–65 10–30 25–35
Adults (19 and older) 45–65 10–35 20–35

Source:Dietary Reference Intakes: Macronutrients.” Dietary Reference Intakes for Energy, Carbohydrate. Fiber, Fat, Fatty Acids, Cholesterol, Protein, and Amino Acids. Institute of Medicine. http://nationalacademies.org/hmd/~/media/Files/Activity%20Files/Nutrition/DRI-Tables/8_Macronutrient%20Summary.pdf?la=en. Accessed September 22, 2017.

Total Energy Expenditure (Output)

The amount of energy you expend every day includes not only the calories you burn during physical activity, but also the calories you burn while at rest (basal metabolism), and the calories you burn when you digest food. The sum of caloric expenditure is referred to as total energy expenditure (TEE). Basal metabolism refers to those metabolic pathways necessary to support and maintain the body’s basic functions (e.g. breathing, heartbeat, liver and kidney function) while at rest. The basal metabolic rate (BMR) is the amount of energy required by the body to conduct its basic functions over a certain time period. The great majority of energy expended (between 50 and 70 percent) daily is from conducting life’s basic processes. Of all the organs, the liver requires the most energy (Table 8.6 “Energy Breakdown of Organs”). Unfortunately, you cannot tell your liver to ramp up its activity level to expend more energy so you can lose weight. BMR is dependent on body size, body composition, sex, age, nutritional status, and genetics. People with a larger frame size have a higher BMR simply because they have more mass. Muscle tissue burns more calories than fat tissue even while at rest and thus the more muscle mass a person has, the higher their BMR. Since females typically have less muscle mass and a smaller frame size than men, their BMRs are generally lower than men’s. As we get older muscle mass declines and thus so does BMR. Nutritional status also affects basal metabolism. Caloric restriction, as occurs while dieting, for example, causes a decline in BMR. This is because the body attempts to maintain homeostasis and will adapt by slowing down its basic functions to offset the decrease in energy intake. Body temperature and thyroid hormone levels are additional determinants of BMR.

Table 8.6 Energy Breakdown of Organs

Organ Percent of Energy Expended
Liver 27
Brain 19
Heart 7
Kidneys 10
Skeletal muscle (at rest) 18
Other organs 19

FAO/WHO/UNU, 1985.
Energy and Protein Requirements. World Health Organization Technical Report Series 724. http://www.fao.org/doCReP/003/aa040e/AA040E00.htm. Updated 1991. Accessed September 17, 2017.

Figure 8.6 Total Energy Expenditure

Metabolic states and activities

Total energy expenditure is the sum of energy expended at rest, during digestion, and during physical activity.

The energy required for all the enzymatic reactions that take place during food digestion and absorption of nutrients is called the “thermic effect of food” and accounts for about 10 percent of total energy expended per day. The other energy required during the day is for physical activity. Depending on lifestyle, the energy required for this ranges between 15 and 30 percent of total energy expended. The main control a person has over TEE is to increase physical activity.

How to Calculate Total Energy Expenditure

Calculating TEE can be tedious, but has been made easier as there are now calculators available on the Web. TEE is dependent on age, sex, height, weight, and physical activity level. The equations are based on standardized formulas produced from actual measurements on groups of people with similar characteristics. To get accurate results from web-based TEE calculators, it is necessary to record your daily activities and the time spent performing them. A spreadsheet for doing so is available online at http://www.health-calc.com/Calculate_daily_energy_expenditure.pdf. Health-calc.com offers an interactive TEE calculator. http://www.health-calc.com/diet/energy-expenditure-advanced

Factors Affecting Energy Intake

Child with a bowl of cereal and milk

Photo by Providence Doucet on unsplash.com / CC0

Physiology

In the last few decades scientific studies have revealed that how much we eat and what we eat is controlled not only by our own desires, but also is regulated physiologically and influenced by genetics. The hypothalamus in the brain is the main control point of appetite. It receives hormonal and neural signals, which determine if you feel hungry or full. Hunger is an unpleasant sensation of feeling empty that is communicated to the brain by both mechanical and chemical signals from the periphery. Conversely, satiety is the sensation of feeling full and it also is determined by mechanical and chemical signals relayed from the periphery. The hypothalamus contains distinct centers of neural circuits that regulate hunger and satiety (Figure 8.7).

Figure 8.7 Sagittal View of the Brain

Sagittal View of the Brain

Hypothalamus by Methoxyroxy~commonswiki / Public Domain

This is a scan of a brain. The hypothalamus contains distinct centers of neural circuits that regulate hunger and satiety.

Hunger pangs are real and so is a “growling” stomach. When the stomach is empty it contracts, producing the characteristic pang and “growl.” The stomach’s mechanical movements relay neural signals to the hypothalamus, which relays other neural signals to parts of the brain. This results in the conscious feeling of the need to eat. Alternatively, after you eat a meal the stomach stretches and sends a neural signal to the brain stimulating the sensation of satiety and relaying the message to stop eating. The stomach also sends out certain hormones when it is full and others when it is empty. These hormones communicate to the hypothalamus and other areas of the brain either to stop eating or to find some food.

Fat tissue also plays a role in regulating food intake. Fat tissue produces the hormone leptin, which communicates to the satiety center in the hypothalamus that the body is in positive energy balance. The discovery of leptin’s functions sparked a craze in the research world and  the diet pill industry, as it was hypothesized that if you give leptin to a person who is overweight, they will decrease their food intake. Alas, this is not the case. In several clinical trials it was found that people who are overweight or obese are actually resistant to the hormone, meaning their brain does not respond as well to it.Dardeno TA, Chou, SH, et al. Leptin in Human Physiology and Therapeutics. Front Neuroendocrinol. 2010; 31(3), 377–93. http://www.ncbi.nlm.nih.gov/pmc/articles/PMC2916735/?tool=pubmed. Accessed September 22, 2017.

Therefore, when you administer leptin to an overweight or obese person there is no sustained effect on food intake.

Nutrients themselves also play a role in influencing food intake. The hypothalamus senses nutrient levels in the blood. When they are low the hunger center is stimulated, and when they are high the satiety center is stimulated. Furthermore, cravings for salty and sweet foods have an underlying physiological basis. Both undernutrition and overnutrition affect hormone levels and the neural circuitry controlling appetite, which makes losing or gaining weight a substantial physiological hurdle.

Genetic Influences

Genetics certainly play a role in body fatness and weight and also affects food intake. Children who have been adopted typically are similar in weight and body fatness to their biological parents. Moreover, identical twins are twice as likely to be of similar weights as compared to fraternal twins. The scientific search for obesity genes is ongoing and a few have been identified, such as the gene that encodes for leptin. However, overweight and obesity that manifests in millions of people is not likely to be attributed to one or even a few genes, but  the interactions of hundreds of genes with the environment. In fact, when an individual has a mutated version of the gene coding for leptin, they are obese, but only a few dozen people around the world have been identified as having a completely defective leptin gene.

Psychological/Behavioral Influences

When your mouth waters in response to the smell of a roasting Thanksgiving turkey and steaming hot pies, you are experiencing a psychological influence on food intake. A person’s perception of good-smelling and good-tasting food influences what they eat and how much they eat. Mood and emotions are associated with food intake. Depression, low self-esteem, compulsive disorders, and emotional trauma are sometimes linked with increased food intake and obesity.

Certain behaviors can be predictive of how much a person eats. Some of these are how much food a person heaps onto their plate, how often they snack on calorie-dense, salty foods, how often they watch television or sit at a computer, and how often they eat out. A study published in a 2008 issue of Obesity looked at characteristics of Chinese buffet patrons. The study found that those who chose to immediately eat before browsing the buffet used larger plates, used a fork rather than chopsticks, chewed less per bite of food, and had higher BMIs than patrons who did not exhibit these behaviors.Levin BE. Developmental Gene X Environment Interactions Affecting Systems Regulating Energy Homeostasis and Obesity. Front Neuroendocrinol. 2010; 3, 270–83. http://www.ncbi.nlm.nih.gov/pmc/articles/PMC2903638/?tool=pubmed. Accessed September 22, 2017.

Of course many behaviors are reflective of what we have easy access to—a concept we will discuss next.

Societal Influences

It is without a doubt that the American society affects what and how much we eat. Portion sizes have increased dramatically in the past few decades. For example, a bagel is now more than twice the size it was in the 1960s. Today, American teenagers have access to a massive amount of calorie-dense foods and beverages, which is a large contributor to the recent rapid increase in overweight and obesity in adolescents in this country. Even different cultures within the United States have different eating habits. For instance, Native Hawaiians and Pacific Islanders who have since adopted the western diet, post-colonization consume  foods high in fat, which is a contributing factor to their higher incidences of overweight and obesity.

The fast food industry in America not only supplies Americans with a large proportion of their diet, but because of its massive presence in society dominates the workings of the entire food system. To generalize, most fast food items have little nutritional merit as they are highly processed and rich in saturated fat, salt, and added sugars. Despite fast foods being a poor source of nourishment, Americans spend over one hundred billion dollars per year on fast food, up from six billion dollars in the early 1970s. The fast food business is likely to continue to grow in North America (and the rest of the world) and greatly affect the diets of whole populations. Because it is unrealistic to say that Americans should abruptly quit eating fast food to save their health (because they will not) society needs to come up with ideas that push nutrient-dense whole foods into the fast food industry. You may have observed that this largely consumer-driven push is having some effect on the foods the fast food industry serves (just watch a recent Subway commercial, or check the options now available in a McDonald’s Happy Meal). Pushing the fast food industry to serve healthier foods is a realistic and positive way to improve the American diet.

Tools for Change

Support the consumer movement of pushing the fast food industry and your favorite local restaurants into serving more nutrient-dense foods. You can begin this task by starting simple, such as requesting extra tomatoes and lettuce on your burger and more nutrient-dense choices in the salad bar. Also, choose their low-calorie menu options and help support the emerging market of healthier choices in the fast food industry. In today’s fast-paced society, it is difficult for most people to avoid fast food all the time. When you do need a quick bite on the run, choose the fast food restaurants that serve healthier foods. Also, start asking for caloric contents of foods so that the restaurant becomes more aware that their patrons are being calorie conscious.

Factors Affecting Energy Expenditure

Crowd running a large race in a city

Photo by Martins Zemlickis on unsplash.com / CC0

Physiological and Genetic Influences

Why is it so difficult for some people to lose weight and for others to gain weight? One theory is that every person has a “set point” of energy balance. This set point can also be called a fat-stat or lipostat, meaning the brain senses body fatness and triggers changes in energy intake or expenditure to maintain body fatness within a target range. Some believe that this theory provides an explanation as to why after dieting, most people return to their original weight not long after stopping the diet. Another theory is referred to as the “settling” point system, which takes into account (more so than the “set-point” theory) the contribution of the obesogenic environment to weight gain. In this model, the reservoir of body fatness responds to energy intake or energy expenditure, such that if a person is exposed to a greater amount of food, body fatness increases, or if a person watches more television body fatness increases. A major problem with these theories is that they overgeneralize and do not take into account that not all individuals respond in the same way to changes in food intake or energy expenditure. This brings up the importance of the interactions of genes and the environment.

Not all individuals who take a weight-loss drug lose weight and not all people who smoke are thin. An explanation for these discrepancies is that each individual’s genes respond differently to a specific environment. Alternatively, environmental factors can influence a person’s gene profile, which is exemplified by the effects of the prenatal environment on body weight and fatness and disease incidence later in life.Matthews CE, Chen KY, et al. Amount of Time Spent in Sedentary Behaviors in the United States, 2003–2004. Am J Epidemiol. 2008; 167(7), 875–81. https://www.ncbi.nlm.nih.gov/pubmed/18303006. Accessed September 22, 2017.

One example is a study of the offspring of women who were overweight during pregnancy had a greater propensity for being overweight and for developing Type 2 diabetes. Thus, undernutrition and overnutrition during pregnancy influence body weight and disease risk for offspring later in life. They do so by adapting energy metabolism to the early nutrient and hormonal environment in the womb.

Psychological/Behavioral Influence

Sedentary behavior is defined as the participation in the pursuits in which energy expenditure is no more than one-and-one-half times the amount of energy expended while at rest and include sitting, reclining, or lying down while awake. Of course, the sedentary lifestyle of many North Americans contributes to their average energy expenditure in daily life. Simply put, the more you sit, the less energy you expend. A study published in a 2008 issue of the American Journal of Epidemiology reports that 55 percent of Americans spend 7.7 hours in sedentary behavior daily.Matthews CE, Chen KY, et al. Amount of Time Spent in Sedentary Behaviors in the United States, 2003–2004. Am J Epidemiol. 2008; 167(7), 875–81. https://www.ncbi.nlm.nih.gov/pubmed/18303006. Accessed September 22, 2017.

Fortunately, including only a small amount of low-level physical activity benefits weight control. A study published in the June 2001 issue of the International Journal of Behavioral Nutrition and Physical Activity reports that even breaking up sitting-time with frequent but brief increased energy expenditure activities, such as walking for five minutes every hour, helps maintain weight and even aids in weight loss.Wu Y. Overweight and Obesity in China. Br Med J. 2006; 333(7564), 362-363. https://www.ncbi.nlm.nih.gov/pmc/articles/PMC1550451/. Accessed September 22, 2017.

Americans partake in an excessive amount of screen time, which is a sedentary behavior that not only reduces energy expenditure, but also contributes to weight gain because of the exposure to aggressive advertising campaigns for unhealthy foods.

Societal Influence

In the United States, many societal factors influence the number of calories burned in a day. Escalators, moving walkways, and elevators (not to mention cars!) are common modes of transportation that reduce average daily energy expenditure. Office work, high-stress jobs, and occupations requiring extended working hours are all societal pressures that reduce the time allotted for exercise of large populations of Americans. Even the remote controls that many have for various electronic devices in their homes contribute to the US society being less active. More obesogenic factors were discussed in the weight management section of this chapter.

Socioeconomic status has been found to be inversely proportional to weight gain. One reason for this relationship is that inhabitants of low-income neighborhoods have reduced access to safe streets and parks for walking. Another is that fitness clubs are expensive and few are found in lower-income neighborhoods. The recent and long-lasting economic crisis in this country is predicted to have profound effects on the average body weight of Americans. The number of homeless in this country is rising with many children and adults living in hotels and cars. As you can imagine neither of these “home spaces” has a kitchen, making it impossible to cook nutritious meals and resulting in increased economically-forced access to cheap, unhealthy foods, such as that at a nearby gas station.

Too Little or Too Much Weight: What Are the Health Risks?

The number of people considered overweight and obese in the world has now surpassed the number that are starving, with some officials estimating that the number of overweight people is nearly double the number of underweight people worldwide. Countries that have more recently modernized, industrialized, and urbanized are experiencing a surge in their overweight and obese populations. China, the most populous country in the world, now has more than 215 million people, approximately one-fifth of their population, that are considered overweight or obese.Wu Y. Overweight and Obesity in China. Br Med J. 2006; 333(7564), 362-363. https://www.ncbi.nlm.nih.gov/pmc/articles/PMC1550451/. Accessed September 22, 2017.

The increase in China’s waistline is partly attributed to changes in the traditional diet, more sedentary lives, and a massive increase in motor vehicle use. Moreover, China’s recent famines in the 1950s, which affected the poor and lower classes to a greater extent than the upper class, have sanctioned lax social attitudes toward body fat and reinspired the age-old Chinese belief that excess body fat represents health and prosperity.

One of the worst statistics regarding overweight and obesity in China is that more than ten million adolescents between ages seventeen and eighteen were overweight in 2000, which is twenty-eight times the number that were overweight in 1985.Wu Y. Overweight and Obesity in China. Br Med J. 2006; 333(7564), 362-363. https://www.ncbi.nlm.nih.gov/pmc/articles/PMC1550451/. Accessed September 22, 2017.

The associated diseases of overweight and obesity happen over many years, and signs and symptoms commonly take decades to manifest. With China’s younger population and other developed countries experiencing a dramatic weight increase, the associated chronic diseases will come about much earlier in life than in previous generations. This will put an even greater burden on society.

Health Risks of Being Overweight and Being Obese

The health consequences of obesity are great and contribute to more than one hundred thousand deaths per year in the United States. According to the CDC, in the United States in 2013-2014Obesity and Overweight.The Centers for Disease Control and Prevention. https://www.cdc.gov/nchs/fastats/obesity-overweight.htm. Updated May 3, 2017. Accessed June 19, 2017.:


State Map of the Prevalence of Obesity in America

US state map of obesity prevalence


Visit https://www.cdc.gov/obesity/data/prevalence-maps.html to see the prevalence of self-reported obesity among U.S. adults from 2014-2016.


As BMIs increase over 25, the risks increase for heart disease, Type 2 diabetes, hypertension, endometrial cancer, postmenopausal breast cancer, colon cancer, stroke, osteoarthritis, liver disease, gallbladder disorders, and hormonal disorders. The WHO reports that overweight and obesity are the fifth leading cause for deaths globally, and estimates that more than 2.8 million adults die annually as a result of being overweight or obese.Obesity and Overweight. World Health Organization. http://www.who.int/mediacentre/factsheets/fs311/en/. Updated June 2016. Accessed September 22, 2017. Moreover, overweight and obesity contribute to 44 percent of the Type 2 diabetes burden, 23 percent of the heart disease burden, and between 7 and 41 percent of the burden of certain cancers.Obesity and Overweight. World Health Organization. http://www.who.int/mediacentre/factsheets/fs311/en/. Updated June 2016. Accessed September 22, 2017.

Similar to other public health organizations, the WHO states the main causes of the obesity epidemic worldwide are the increased intake of energy-dense food and decreased level of physical activity that is mainly associated with modernization, industrialization, and urbanization. The environmental changes that contribute to the dietary and physical activity patterns of the world today are associated with the lack of policies that address the obesity epidemic in the food and health industry, urban planning, agriculture, and education sectors.

Dietary, Behavioral, and Physical Activity Recommendations for Weight Management

Wooden crate with pineapples and oranges inside

Photo by Igor Ovsyannikov on unsplash.com / CC0


We have just considered the gravity of the obesity problem in America and worldwide. How is America combating its weight problem on a national level, and have the approaches been successful? Successful weight loss is defined as individuals intentionally losing at least 10 percent of their body weight and keeping it off for at least one year.Wing RR, Hill JO. Successful Weight Loss Maintenance. Annu Rev Nutr. 2001; 21, 323–41. http://www.ncbi.nlm.nih.gov/pubmed/11375440?dopt=Abstract. Accessed September 22, 2017. Wing RR, Hill JO. Successful Weight Loss Maintenance. Annu Rev Nutr. 2001; 21, 323–41. http://www.ncbi.nlm.nih.gov/pubmed/11375440?dopt=Abstract. Accessed September 22, 2017. Results from lifestyle intervention studies suggest fewer than 20 percent of participants are successful at weight loss. An evaluation of successful weight loss, involving more than fourteen thousand participants published in the November 2011 issue of the International Journal of Obesity estimates that more than one in six Americans (17 percent) who were overweight or obese were successful in achieving long-term weight loss.Kraschnewski JL, Boan J, et al. Long-Term Weight Loss Maintenance in the United States. Int J Obes. 2010; 34(11),1644–54. http://www.ncbi.nlm.nih.gov/pubmed/20479763. Accessed September 22, 2017. However, these numbers are on the high end because many similar studies report fewer than 10 percent of participants as successful in weight loss.

The National Weight Control Registry (NWCR) tracks over ten thousand people who have been successful in losing at least 30 pounds and maintaining this weight loss for at least one year. Their research findings are that 98 percent of participants in the registry modified their food intake and 94 percent increased their physical activity (mainly walking).Research Findings. The National Weight Control Registry. http://www.nwcr.ws/Research/default.htm. Accessed September 22, 2017.

Although there are a great variety of approaches taken by NWCR members to achieve successful weight loss, most report that their approach involved adhering to a low-calorie, low-fat diet and doing high levels of activity (about one hour of exercise per day). Moreover, most members eat breakfast every day, watch fewer than ten hours of television per week, and weigh themselves at least once per week. About half of them lost weight on their own, and the other half used some type of weight-loss program. In most scientific studies successful weight loss is accomplished only by changing the diet and by increasing physical activity. Doing one without the other limits the amount of weight lost and the length of time that weight loss is sustained. On an individual level it is quite possible to achieve successful weight loss, as over ten thousand Americans can attest. Moreover, losing as little as 10 percent of your body weight can significantly improve health and reduce disease risk.Clinical Guidelines on the Identification, Evaluation, and Treatment of Overweight and Obesity in Adults: The Evidence Report. National Heart, Lung, and Blood Institute. 1998, 51S–210S. http://www.ncbi.nlm.nih.gov/books/NBK2003/. Accessed September 22, 2017.

You do not have to be overweight or obese to reap benefits from eating a healthier diet and increasing physical activity as both provide numerous benefits beyond weight loss and maintenance.

Evidence-Based Dietary Recommendations

The 2015 Dietary Guidelines for Americans offers specific, evidence-based recommendations for dietary changes aimed at keeping calorie intake in balance with physical activity, which is key for weight management. These recommendations include:

Follow a healthy eating pattern that accounts for all foods and beverages within an appropriate calorie level that includes:

A healthy eating pattern limits:

Key quantitative recommendations are provided for several components of the diet that should be limited. These components are of particular public health concern in the United States, and the specified limits can help individuals achieve healthy eating patterns within calorie limits2010 Dietary Guidelines for Americans. US Department of Agriculture. http://health.gov/dietaryguidelines/dga2010/DietaryGuidelines 2010.pdf. Published 2010.  Accessed September 22, 2017.:

If alcohol is consumed, it should be consumed in moderation—up to one drink per day for women and up to two drinks per day for men—and only by adults of legal drinking age.

Evidence-Based Physical Activity Recommendations

The other part of the energy balance equation is physical activity. The Dietary Guidelines are complemented by the 2008 Physical Activity Guidelines for Americans issued by the Department of Health and Human Services (HHS) in an effort to provide evidence-based guidelines for appropriate physical activity levels. The 2008 Physical Activity Guidelines provide guidance to Americans aged six and older about how to improve health and reduce chronic disease risk through physical activity. Increased physical activity has been found in scientific studies to lower the risk of heart disease, stroke, high blood pressure, Type 2 diabetes, colon, breast, and lung cancer, falls and fractures, depression, and early death. Increased physical activity not only reduces disease risk, but also improves overall health by increasing cardiovascular and muscular fitness, increasing bone density and strength, improving cognitive function, and assisting in weight loss and weight maintenance.2008 Physical Activity Guidelines for Americans. US Department of Health and Human Services. http://www.health.gov/paguidelines/guidelines/chapter2.aspx. Published 2008. Accessed September 22, 2017.

The key guidelines for adults are the following (those for pregnant women, children, and older people will be given in Chapter 13):

The 2008 Physical Activity Guidelines broadly classify moderate physical activities as those when “you can talk while you do them, but can’t sing” and vigorous activities as those when “you can only say a few words without stopping to catch your breath.”2008 Physical Activity Guidelines for Americans. US Department of Health and Human Services. http://www.health.gov/paguidelines/guidelines/chapter2.aspx. Published 2008. Accessed September 22, 2017.

Table 8.7 Moderate and Vigorous Physical ActivitiesSource: 2008 Physical Activity Guidelines for Americans. US Department of Health and Human Services. http://www.health.gov/paguidelines/guidelines/chapter2.aspx. Published 2008. Accessed September 22, 2017.

Moderate Activities Vigorous Activities
Ballroom/line dancing Aerobic dance
Biking on level ground Biking (more than 10 miles per hour)
Canoeing Heavy gardening (digging, hoeing)
Gardening Hiking uphill
Baseball, softball, volleyball Fast dancing

Campaigns for a Healthy-Weight America

On a national level, strategies addressing overweight and obesity in the past have not been all that successful, as obesity levels continue to climb. However, in the recent past (2007–2011) several newly created initiatives and organizations are actively reinforcing strategies aimed to meet the challenge of improving the health of all Americans.

In 2010 the national campaign to reduce obesity was reinforced when First Lady Michelle Obama launched the “Let’s Move” initiative, which has the goal of “solving the challenge of childhood obesity within a generation so that children born today will reach adulthood at a healthy weight.”The White House, Office of the First Lady. First Lady Michelle Obama Launches Let’s Move: America’s Move to Raise a Healthier Generation of Kids.https://letsmove.obamawhitehouse.archives.gov/about. Published February 9, 2010. Accessed September 22, 2017. Another campaign, “Campaign to End Obesity,” was recently established to try to enable more Americans to eat healthy and be active by bringing together leaders from academia and industry, as well as public-health policy-makers in order to create policies that will reverse the obesity trend and its associated diseases.

The “Small-Change” Approach

Currently, most people are not obese in this country. The gradual rise in overweight is happening because, on average, people consume slightly more calories daily than they expend, resulting in a gradual weight gain of one to two pounds a year. In 2003 the idea was first published that promoting small lifestyle changes to reduce weight gain occurring over time in all age groups may better reduce obesity rates in the American population.Hill JO. Can a Small-Changes Approach Help Address the Obesity Epidemic? A Report of the Joint Task Force of the American Society for Nutrition, Institute of Food Technologists, and International Food Information Council. Am J Clin Nutr. 2009; 89(2), 477–84. http://www.ajcn.org/content/89/2/477.long. Accessed September 22, 2017.

Scientific studies have demonstrated that asking people to increase the number of steps they take each day while providing them with pedometers that count the steps they take each day successfully prevented weight gain. A “small-changes” study published in the October 2007 issue of Pediatrics evaluated whether families that made two small lifestyle changes, which were to walk an additional two thousand steps per day and to eliminate 100 kilocalories per day from their typical diet by replacing dietary sugar with a noncaloric sweetener, would prevent weight gain in overweight children.Rodearmel SJ, Wyatt HR, et al. Small Changes in Dietary Sugar and Physical Activity As an Approach to Preventing Excessive Weight Gain: The America on the Move Family Study. Pediatrics. 2007; 120(4), e869–79. http://pediatrics.aappublications.org/content/120/4/e869.long. Accessed September 22, 2017. The results of this study were that a higher percentage of children who made the small changes maintained or reduced their BMI in comparison to children of families given a pedometer but not asked to also make physical activity or dietary changes.Rodearmel SJ, Wyatt HR, et al. Small Changes in Dietary Sugar and Physical Activity As an Approach to Preventing Excessive Weight Gain: The America on the Move Family Study. Pediatrics. 2007; 120(4), e869–79. http://pediatrics.aappublications.org/content/120/4/e869.long. Accessed September 22, 2017. Several more studies funded by the National Institutes of Health and USDA are ongoing and are evaluating the effectiveness of the “small-changes” approach in reducing weight gain.

In 2009, a report of the Joint Task Force of the American Society for Nutrition, Institute of Food Technologists, and International Food Information Council proposed that the “small-changes” approach when supported at the community, industry, and governmental levels will be more effective than current strategies in gradually reducing the obesity rate in America.Hill JO. Can a Small-Changes Approach Help Address the Obesity Epidemic? A Report of the Joint Task Force of the American Society for Nutrition, Institute of Food Technologists, and International Food Information Council. Am J Clin Nutr. 2009; 89(2), 477–84. http://www.ajcn.org/content/89/2/477.long. Accessed September 22, 2017.

The HHS encouraged the approach and launched a “Small Step” website in 2008.

IX

Chapter 9. Vitamins

Introduction

Malia paha he iki ‘unu, pa‘a ka pōhaku nui ‘a‘ole e ka‘a

Perhaps it is the small stone that can keep the big rock from rolling down


Sliced karat bananas

Learning Objectives

By the end of this chapter, you will be able to:

  • Describe the role of vitamins as antioxidants in the body
  • Describe the functions and sources of antioxidant micronutrients, phytochemicals, and antioxidant minerals
  • Describe the functions of vitamins in catabolic pathways, anabolic pathways, and blog

Vitamins are obtained from the different types of foods that we consume. If a diet is lacking a certain type of nutrient, a vitamin deficiency may occur. The traditional diet in Pohnpei (an island in the Federal States of Micronesia) consisted of a diet rich in local tropical produce such as bananas, papaya, mango, pineapple, coconut as well as seafood. However, due to a shift in dietary patterns from fresh foods to processed and refined foods the island is suffering from a magnitude of health concerns. A study conducted by the Department of Health of the Federated States of Micronesia on children aged two to four years old in Pohnpei  showed that the prevalence for vitamin A deficiency among children aged 2-5 was 53 percentYamamura CM, Sullivan KM. Risk factors for vitamin A deficiency among preschool aged children in Pohnpei, Federated States of Micronesia. J Trop Pediatr. 2004; 50(1),16-9. https://www.ncbi.nlm.nih.gov/pubmed/14984164. Accessed October 15, 2017..

To combat this issue the Island Food Community of Pohnpei has been instrumental in promoting the citizens of Pohnpei to increase local karat banana consumption. The karat banana is rich in beta-carotene (a source of vitamin A) and increasing consumption among the locals will decrease the prevalence of vitamin A deficiencies in Pohnpei. For further information on this issue visit the Island Food Community of Pohnpei’s website at http://www.islandfood.org/ and watch the video at https://www.youtube.com/watch?v=DGVxnefqbTQ.

Vitamins are organic compounds that are traditionally assigned to two groups fat-soluble (hydrophobic) or water-soluble (hydrophilic). This classification determines where they act in the body. Water-soluble vitamins act in the cytosol of cells or in extracellular fluids such as blood; fat-soluble vitamins are largely responsible for protecting cell membranes from free radical damage. The body can synthesize some vitamins, but others must be obtained from the diet.

Figure 9.1 The Vitamins

Flowchart of types of vitamins

One major difference between fat-soluble vitamins and water-soluble vitamins is the way they are absorbed in the body. Vitamins are absorbed primarily in the small intestine and their bioavailability is dependent on the food composition of the diet. Fat-soluble vitamins are absorbed along with dietary fat. Therefore, if a meal is very low in fat, the absorption of the fat-soluble vitamins will be impaired. Once fat-soluble vitamins have been absorbed in the small intestine, they are packaged and incorporated into chylomicrons along with other fatty acids and transported in the lymphatic system to the liver. Water-soluble vitamins on the other hand are absorbed in the small intestine but are transported to the liver through blood vessels.  (Figure 9.2 “Absorption of Fat-Soluble and Water-Soluble Vitamins”).

Figure 9.2 Absorption of Fat-Soluble and Water-Soluble Vitamins

Process of vitamin absorption in body

Fat-Soluble Vitamins

Vitamin A Functions and Health Benefits

Vitamin A is a generic term for a group of similar compounds called retinoids. Retinol is the form of vitamin A found in animal-derived foods, and is converted in the body to the biologically active forms of vitamin A: retinal and retinoic acid (thus retinol is sometimes referred to as “preformed vitamin A”). About 10 percent of plant-derived carotenoids, including beta-carotene, can be converted in the body to retinoids and are another source of functional vitamin A. Carotenoids are pigments synthesized by plants that give them their yellow, orange, and red color. Over six hundred carotenoids have been identified and, with just a few exceptions, all are found in the plant kingdom. There are two classes of carotenoids—the xanthophylls, which contain oxygen, and the carotenes, which do not.

In plants, carotenoids absorb light for use in photosynthesis and act as antioxidants. Beta-carotene, alpha-carotene, and beta-cryptoxanthin are converted to some extent to retinol in the body. The other carotenoids, such as lycopene, are not. Many biological actions of carotenoids are attributed to their antioxidant activity, but they likely act by other mechanisms, too.

Vitamin A is fat-soluble and is packaged into chylomicrons in small intestine, and transported to the liver. The liver stores and exports vitamin A as needed; it is released into the blood bound to a retinol-binding protein, which transports it to cells. Carotenoids are not absorbed as well as vitamin A, but similar to vitamin A, they do require fat in the meal for absorption. In intestinal cells, carotenoids are packaged into the lipid-containing chylomicrons inside small intestine mucosal cells and then transported to the liver. In the liver, carotenoids are repackaged into lipoproteins, which transport them to cells.

The retinoids are aptly named as their most notable function is in the retina of the eye where they aid in vision, particularly in seeing under low-light conditions. This is why night blindness is the most definitive sign of vitamin A deficiency.Vitamin A has several important functions in the body, including maintaining vision and a healthy immune system. Many of vitamin A’s functions in the body are similar to the functions of hormones (for example, vitamin A can interact with DNA, causing a change in protein function). Vitamin A assists in maintaining healthy skin and the linings and coverings of tissues; it also regulates growth and development. As an antioxidant, vitamin A protects cellular membranes, helps in maintaining glutathione levels, and influences the amount and activity of enzymes that detoxify free radicals.

Vision

Retinol that is circulating in the blood is taken up by cells in the eye retina, where it is converted to retinal and is used to help the pigment rhodopsin, which is involved in the eye’s ability to see under low light conditions. A deficiency in vitamin A thus results in less rhodopsin and a decrease in the detection of low-level light, a condition referred to as night-blindness.

Insufficient intake of dietary vitamin A over time can also cause complete vision loss. In fact, vitamin A deficiency is the number one cause of preventable blindness worldwide. Vitamin A not only supports the vision function of eyes but also maintains the coverings and linings of the eyes. Vitamin A deficiency can lead to the dysfunction of the linings and coverings of the eye (eg. bitot spots), causing dryness of the eyes, a condition called xerophthalmia. The progression of this condition can cause ulceration of the cornea and eventually blindness.

Figure 9.3 Bitot Spot caused by vitamin A deficiency

Bitot spot on eye

Malnutrition-Bitot’s Spots/ Bitot’s Spots caused by vitamin A deficiency by CDC / Nutrition Program

Figure 9.4 Vitamin A Deficiency World Map

Vitamin deficiency world map

Map by Wikipedia user Chris55 / CC BY-SA 4.0

Legend: Disability-adjusted life years (DALY) lost from Vitamin A deficiency in 2012 per million persons.
0-28 31-78 85-85 85-141 144-257 258-376 432-455 558-558 586-883

Immunity

The common occurrence of advanced xerophthalmia in children who died from infectious diseases led scientists to hypothesize that supplementing vitamin A in the diet for children with xerophthalmia might reduce disease-related mortality. In Asia in the late 1980s, targeted populations of children were administered vitamin A supplements, and the death rates from measles and diarrhea declined by up to 50 percent. Vitamin A supplementation in these deficient populations did not reduce the number of children who contracted these diseases, but it did decrease the severity of the diseases so that they were no longer fatal. Soon after the results of these studies were communicated to the rest of the world, the World Health Organization (WHO) and the United Nations Children’s Fund (UNICEF) commenced worldwide campaigns against vitamin A deficiency. UNICEF estimates that the distribution of over half a billion vitamin A capsules prevents 350,000 childhood deaths annually.Sommer A. Vitamin A Deficiency and Clinical Disease: An Historical Overview. J Nutr. 2008; 138, 1835–39. http://jn.nutrition.org/content/138/10/1835.long. Accessed October 4, 2017.

In the twenty-first century, science has demonstrated that vitamin A greatly affects the immune system. What we are still lacking are clinical trials investigating the proper doses of vitamin A required to help ward off infectious disease and how large of an effect vitamin A supplementation has on populations that are not deficient in this vitamin. This brings up one of our common themes in this text—micronutrient deficiencies may contribute to the development, progression, and severity of a disease, but this does not mean that an increased intake of these micronutrients will solely prevent or cure disease. The effect, as usual, is cumulative and depends on the diet as a whole, among other things.

Growth and Development

Vitamin A acts similarly to some hormones in that it is able to change the amount of proteins in cells by interacting with DNA. This is the primary way that vitamin A affects growth and development. Vitamin A deficiency in children is linked to growth retardation; however, vitamin A deficiency is often accompanied by protein malnutrition and iron deficiency, thereby confounding the investigation of vitamin A’s specific effects on growth and development.

In the fetal stages of life, vitamin A is important for limb, heart, eye, and ear development and in both deficiency and excess, vitamin A causes birth defects. Furthermore, both males and females require vitamin A in the diet to effectively reproduce.

Cancer

Vitamin A’s role in regulating cell growth and death, especially in tissues that line and cover organs, suggests it may be effective in treating certain cancers of the lung, neck, and liver. It has been shown in some observational studies that vitamin A-deficient populations have a higher risk for some cancers. However, vitamin A supplements have actually been found to increase the risk of lung cancer in people who are at high risk for the disease (i.e., smokers, ex-smokers, workers exposed to asbestos). The Beta-Carotene and Retinol Efficacy Trial (CARET) involving over eighteen thousand participants who were at high risk for lung cancer found that people who took supplements containing very high doses of vitamin A (25,000 international units) and beta-carotene had a 28 percent higher incidence of lung cancer midway through the study, which was consequently stopped.Goodman GE, et al. The Beta-Carotene and Retinol Efficacy Trial: Incidence of Lung Cancer and Cardiovascular Disease Mortality During 6-year Follow-up after Stopping Beta-Carotene and Retinol Supplements. J Natl Cancer Inst. 2004; 96(23), 1743–50. http://jnci.oxfordjournals.org/content/96/23/1743.long. Accessed October 6, 2017.

Vitamin A Toxicity

Vitamin A toxicity, or hypervitaminosis A, is rare. Typically it requires you to ingest ten times the RDA of preformed vitamin A in the form of supplements (it would be hard to consume such high levels from a regular diet) for a substantial amount of time, although some people may be more susceptible to vitamin A toxicity at lower doses. The signs and symptoms of vitamin A toxicity include dry, itchy skin, loss of appetite, swelling of the brain, and joint pain. In severe cases, vitamin A toxicity may cause liver damage and coma.

Vitamin A is essential during pregnancy, but doses above 3,000 micrograms per day (10,000 international units) have been linked to an increased incidence of birth defects. Pregnant women should check the amount of vitamin A contained in any prenatal or pregnancy multivitamin she is taking to assure the amount is below the UL.

Dietary Reference Intakes for Vitamin A

There is more than one source of vitamin A in the diet. There is preformed vitamin A, which is abundant in many animal-derived foods, and there are carotenoids, which are found in high concentrations in vibrantly colored fruits and vegetables and some oils.

Some carotenoids are converted to retinol in the body by intestinal cells and liver cells. However, only minuscule amounts of certain carotenoids are converted to retinol, meaning fruits and vegetables are not necessarily good sources of vitamin A.

The RDA for vitamin A includes all sources of vitamin A. The RDA for vitamin A is given in mcg of retinol activity requirements (RAE) to take into account the many different forms it is available in.  The human body converts all dietary sources of vitamin A into retinol. Therefore, 1 mcg of retinol is equivalent to 12 mcg of beta-carotene, and 24 mcg of alpha-carotene or beta-cryptoxanthin.  For example, 12 micrograms of fruit- or vegetable-based beta-carotene will yield 1 microgram of retinol. Currently vitamin A listed in food and on supplement labels use international units (IUs). The following conversions are listed belowDietary Supplement Fact Sheet: Vitamin A. National Institutes of Health, Office of Dietary Supplements. http://ods.od.nih.gov/factsheets/VitaminA-QuickFacts/. Updated September 5, 2012. Accessed October 7, 2017.:

The RDA for vitamin A is considered sufficient to support growth and development, reproduction, vision, and immune system function while maintaining adequate stores (good for four months) in the liver.

Table 9.1 Dietary Reference Intakes for Vitamin A

Age Group RDA Males and Females mcg RAE/day UL
Infants (0–6 months) 400* 600
Infants (7–12 months) 500* 600
Children (1–3 years) 300 600
Children (4–8 years) 400 900
Children (9–13 years) 600 1,700
Adolescents (14–18 years) Males: 900 2,800
Adolescents (14–18 years) Females: 700 2,800
Adults (> 19 years) Males: 900 3,000
Adults (> 19 years) Females: 700 3,000
*denotes Adequate Intake

Source: Source: Dietary Supplement Fact Sheet: Vitamin A. National Institutes of Health, Office of Dietary Supplements. http://ods.od.nih.gov/factsheets/VitaminA-QuickFacts/. Updated September 5, 2012. Accessed October 7, 2017.

Dietary Sources of Vitamin A and Beta-Carotene

Preformed vitamin A is found only in foods from animals, with the liver being the richest source because that’s where vitamin A is stored (see Table 9.2 “Vitamin A Content of Various Foods”). The dietary sources of carotenoids will be given in the following text.

Table 9.2 Vitamin A Content of Various Foods

Food Serving Vitamin A (IU) Percent Daily Value
Beef liver 3 oz. 27,185 545
Chicken liver 3 oz. 12,325 245
Milk, skim 1 c. 500 10
Milk, whole 1 c. 249 5
Cheddar cheese 1 oz. 284 6

Source: Dietary Supplement Fact Sheet: Vitamin A. National Institutes of Health, Office of Dietary Supplements. http://ods.od.nih.gov/factsheets/VitaminA-QuickFacts/. Updated September 5, 2012. Accessed October 7, 2017.

In the United States, the most consumed carotenoids are alpha-carotene, beta-carotene, beta-cryptoxanthin, lycopene, lutein, and zeaxanthin. See Table 9.3 “Alpha- and Beta-Carotene Content of Various Foods” for the carotenoid content of various foods.

Table 9.3 Alpha- and Beta-Carotene Content of Various Foods

Food Serving Beta-carotene (mg) Alpha-carotene (mg)
Pumpkin, canned 1c. 17.00 11.70
Carrot juice 1c. 22.00 10.20
Carrots, cooked 1c. 13.00 5.90
Carrots, raw 1 medium 5.10 2.10
Winter squash, baked 1c. 5.70 1.40
Collards, cooked 1c. 11.60 0.20
Tomato 1 medium 0.55 0.10
Tangerine 1 medium 0.13 0.09
Peas, cooked 1c. 1.20 0.09

Source:2010. USDA National Nutrient Database for Standard Reference, Release 23. US Department of Agriculture, Agricultural Research Service. http://www.ars.usda.gov/ba/bhnrc/ndl. Accessed October 22, 2017.

Vitamin D Functions and Health Benefits

Vitamin D refers to a group of fat-soluble vitamins derived from cholesterol. Vitamins D2 (ergocalciferol) and D3 (calcitriol) are the only ones known to have biological actions in the human body. The skin synthesizes vitamin D when exposed to sunlight. In fact, for most people, more than 90 percent of their vitamin D3 comes from the casual exposure to the UVB rays in sunlight. Anything that reduces your exposure to the sun’s UVB rays decreases the amount of vitamin D3 your skin synthesizes. That would include long winters, your home’s altitude, whether you are wearing sunscreen, and the color of your skin (including tanned skin). Do you ever wonder about an increased risk for skin cancer by spending too much time in the sun? Do not fret. Less than thirty minutes of sun exposure to the arms and legs will increase blood levels of vitamin D3 more than orally taking 10,000 IU (250 micrograms) of vitamin D3.

Figure 9.5 The Functions of Vitamin D

Functions of Vitamin D in the body

Vitamin D’s Functional Role

Activated vitamin D3 (calcitriol) regulates blood calcium levels in concert with parathyroid hormone. In the absence of an adequate intake of vitamin D, less than 15 percent of calcium is absorbed from foods or supplements. The effects of calcitriol on calcium homeostasis are critical for bone health. A deficiency of vitamin D in children causes the bone disease nutritional rickets. Rickets is very common among children in developing countries and is characterized by soft, weak, deformed bones that are exceptionally susceptible to fracture. In adults, vitamin D deficiency causes a similar disease called osteomalacia, which is characterized by low BMD. Osteomalacia has the same symptoms and consequences as osteoporosis and often coexists with osteoporosis. Vitamin D deficiency is common, especially in the elderly population, dark-skinned populations, and in the many people who live in the northern latitudes where sunlight exposure is much decreased during the long winter season.

Figure 9.6 Rickets in Children

Children with Rickets

Rickets, stages of development for children from Wellcome Images / CC BY 4.0

Health Benefits

Observational studies have shown that people with low levels of vitamin D in their blood have lower BMD and an increased incidence of osteoporosis. In contrast, diets with high intakes of salmon, which contains a large amount of vitamin D, are linked with better bone health. A review of twelve clinical trials, published in the May 2005 issue of the Journal of the American Medical Association, concluded that oral vitamin D supplements at doses of 700–800 international units per day, with or without coadministration of calcium supplements, reduced the incidence of hip fracture by 26 percent and other nonvertebral fractures by 23 percent.Fracture Prevention with Vitamin D Supplementation: A Meta-Analysis of Randomized Controlled Trials. JAMA. 2005; 293(18), 2257–64. http://jama.ama-assn.org/content/293/18/2257.long. Accessed October 12, 2017. A reduction in fracture risk was not observed when people took vitamin D supplements at doses of 400 international units.

Many other health benefits have been linked to higher intakes of vitamin D, from decreased cardiovascular disease to the prevention of infection. Furthermore, evidence from laboratory studies conducted in cells, tissues, and animals suggest vitamin D prevents the growth of certain cancers, blocks inflammatory pathways, reverses atherosclerosis, increases insulin secretion, and blocks viral and bacterial infection and many other things. Vitamin D deficiency has been linked to an increased risk for autoimmune diseases. Immune diseases, rheumatoid arthritis, multiple sclerosis, and Type 1 diabetes have been observed in populations with inadequate vitamin D levels. Additionally, vitamin D deficiency is linked to an increased incidence of hypertension. Until the results come out from the VITAL study, the bulk of scientific evidence touting other health benefits of vitamin D is from laboratory and observational studies and requires confirmation in clinical intervention studies.

Vitamin D Toxicity

Although vitamin D toxicity is rare, too much can cause high levels of calcium concentrations or hypercalcemia. Hypercalcemia can lead to a large amount of calcium to be excreted through the urine which can cause kidney damage.  Calcium deposits may also develop in soft tissues such as the kidneys, blood vessels, or other parts of the cardiovascular system. However, it is important to know that the synthesis of vitamin D from the sun does not cause vitamin D toxicity due to the skin production of vitamin D3 being a tightly regulated process.

Dietary Reference Intake for Vitamin D

The Institute of Medicine RDAs for vitamin D for different age groups is listed in Table 10.4 “Dietary Reference Intakes for Vitamin D”. For adults, the RDA is 600 international units (IUs), which is equivalent to 15 micrograms of vitamin D. The National Osteoporosis Foundation recommends slightly higher levels and that adults under age fifty get between 400 and 800 international units of vitamin D every day, and adults fifty and older get between 800 and 1,000 international units of vitamin D every day. According to the IOM, the tolerable upper intake level (UL) for vitamin D is 4,000 international units per day. Toxicity from excess vitamin D is rare, but certain diseases such as hyperparathyroidism, lymphoma, and tuberculosis make people more sensitive to the increases in calcium caused by high intakes of vitamin D.

Table 9.4 Dietary Reference Intakes for Vitamin D

Age Group RDA (mcg/day) UL (mcg/day)
Infant (0–6 months) 10* 25
Infants (6–12 months) 10* 25
Children (1–3 years) 15 50
Children (4–8 years) 15 50
Children (9–13 years) 15 50
Adolescents (14–18 years) 15 50
Adults (19–71 years) 15 50
Adults (> 71 years) 20 50
* denotes Adequate Intake

Source: Ross, A. C. et al. The 2011 Report on Dietary Reference Intakes for Calcium and Vitamin D from the Institute of Medicine: What Clinicians Need to Know. J Clin Endocrinol Metab. 2011; 96(1), 53–8. http://www.ncbi.nlm.nih.gov/pubmed/21118827. Accessed October 10, 2017.

Dietary Sources of Vitamin D

Table 9.5 Vitamin D Content of Various Foods

Food Serving Vitamin D (IU) Percent Daily Value
Swordfish 3 oz. 566 142
Salmon 3 oz. 447 112
Tuna fish, canned in water, drained 3 oz. 154 39
Orange juice fortified with vitamin D 1 c. 137 34
Milk, nonfat, reduced fat, and whole, vitamin D- fortified 1 c. 115-124 29-31
Margarine, fortified 1 tbsp. 60 15
Sardines, canned in oil, drained 2 e. 46 12
Beef liver 3 oz. 42 11
Egg, large 1 e. 41 10

Source: Dietary Supplement Fact Sheet: Vitamin D. National Institutes of Health, Office of Dietary Supplements.https://ods.od.nih.gov/factsheets/VitaminD-HealthProfessional/#h3. Updated  September 5, 2012. Accessed October 22, 2017.

Vitamin E Functions and Health Benefits

Vitamin E occurs in eight chemical forms, of which alpha-tocopherol appears to be the only form that is recognized to meet human requirements. Alpha-tocopherol and vitamin E’s other constituents are fat-soluble and primarily responsible for protecting cell membranes against lipid destruction caused by free radicals, therefore making it an antioxidant. When alpha-tocopherol interacts with a free radical it is no longer capable of acting as an antioxidant unless it is enzymatically regenerated. Vitamin C helps to regenerate some of the alpha-tocopherol, but the remainder is eliminated from the body. Therefore, to maintain vitamin E levels, you ingest it as part of your diet.

Insufficient levels are rare (signs and symptoms of such conditions are not always evident) but are primarily the result of nerve degeneration. People with malabsorption disorders, such as Crohn’s disease or cystic fibrosis, and babies born prematurely, are at higher risk for vitamin E deficiency.

Vitamin E has many other important roles and functions in the body such as boosting the immune system by helping to fight off bacteria and viruses.  It also enhances the dilation of blood vessels and inhibiting the formation of blood clotting.  Despite vitamin E’s numerous beneficial functions when taken in recommended amounts, large studies do not support the idea that taking higher doses of this vitamin will increase its power to prevent or reduce disease risk.Goodman M, Bostlick RM, Kucuk O, Jones DP. Clinical trials of antioxidants as cancer prevention agents: past, present, and future. Free Radic Biol Med. 2011; 51(5), 1068–84. https://www.ncbi.nlm.nih.gov/pubmed/21683786. Accessed October 5, 2017.McGinley C, Shafat A. Donnelly AE. Does antioxidant vitamin supplementation protect against muscle damage. Sports Med. 2009; 39(12), 1011–32. https://www.ncbi.nlm.nih.gov/pubmed/19902983. Accessed October 5, 2017.

Fat in the diet is required for vitamin E absorption as it is packaged into lipid-rich chylomicrons in intestinal cells and transported to the liver. The liver stores some of the vitamin E or packages it into lipoproteins, which deliver it to cells.

Cardiovascular Disease

Vitamin E reduces the oxidation of LDLs, and it was therefore hypothesized that vitamin E supplements would protect against atherosclerosis. However, large clinical trials have not consistently found evidence to support this hypothesis. In fact, in the “Women’s Angiographic Vitamin and Estrogen Study,” postmenopausal women who took 400 international units (264 milligrams) of vitamin E and 500 milligrams of vitamin C twice per day had higher death rates from all causes.Waters DD, et al. Effects of Hormone Replacement Therapy and Antioxidant Vitamin Supplements on Coronary Atherosclerosis in Postmenopausal Women: A Randomized Controlled Trial. JAMA. 2002; 288(19), 2432–40. https://jamanetwork.com/journals/jama/fullarticle/195531. Accessed October 5, 2017.

Other studies have not confirmed the association between increased vitamin E intake from supplements and increased mortality. There is more consistent evidence from observational studies that a higher intake of vitamin E from foods is linked to a decreased risk of dying from a heart attack.

Cancer

The large clinical trials that evaluated whether there was a link between vitamin E and cardiovascular disease risk also looked at cancer risk. These trials, called the HOPE-TOO Trial and Women’s Health Study, did not find that vitamin E at doses of 400 international units (264 milligrams) per day or 600 international units (396 milligrams) every other day reduced the risk of developing any form of cancer.HOPE and HOPE-TOO Trial Investigators. Effects of Long-Term Vitamin E Supplementation on Cardiovascular Events and Cancer. JAMA. 2005; 293, 1338–47. http://jama.ama-assn.org/content/293/11/1338.long., Accessed October 5, 2017.Lee IM, et al. Vitamin E in the Primary Prevention of Cardiovascular Disease and Cancer: The Women’s Health Study. JAMA.2005; 294, 56–65. http://jama.ama-assn.org/content/294/1/56.long. Accessed October 5, 2017.

Eye Conditions

Oxidative stress plays a role in age-related loss of vision, called macular degeneration. Age-related macular degeneration (AMD) primarily occurs in people over age fifty and is the progressive loss of central vision resulting from damage to the center of the retina, referred to as the macula. There are two forms of AMD, dry and wet, with wet being the more severe form.

In the dry form, deposits form in the macula; the deposits may or may not directly impair vision, at least in the early stages of the disease. In the wet form, abnormal blood vessel growth in the macula causes vision loss. Clinical trials evaluating the effects of vitamin E supplements on AMD and cataracts (clouding of the lens of an eye) did not consistently observe a decreased risk for either. However, scientists do believe vitamin E in combination with other antioxidants such as zinc and copper may slow the progression of macular degeneration in people with early-stage disease.

Dementia

The brain’s high glucose consumption makes it more vulnerable than other organs to oxidative stress. Oxidative stress has been implicated as a major contributing factor to dementia and Alzheimer’s disease. Some studies suggest vitamin E supplements delay the progression of Alzheimer’s disease and cognitive decline, but again, not all of the studies confirm the relationship. A recent study with over five thousand participants published in the July 2010 issue of the Archives of Neurology demonstrated that people with the highest intakes of dietary vitamin E were 25 percent less likely to develop dementia than those with the lowest intakes of vitamin E.Devore EE, et al. Dietary Antioxidants and Long-Term Risk of Dementia. Arch Neurol. 2010; 67(7), 819–25. http://www.ncbi.nlm.nih.gov/pmc/articles/PMC2923546/?tool=pubmed. Accessed October 5, 2017.

More studies are needed to better assess the dose and dietary requirements of vitamin E and, for that matter, whether other antioxidants lower the risk of dementia, a disease that not only devastates the mind, but also puts a substantial burden on loved ones, caretakers, and society in general.

Vitamin E Toxicity

Currently, researchers have not found any adverse effects from consuming vitamin E in food. Although that may be the case, supplementation of alpha-tocopherol in animals has shown to cause hemorrhage and disrupt blood coagulation.  Extremely high levels of vitamin E can interact with vitamin K-dependent clotting factors causing an inhibition of blood clotting.Dietary Supplement Fact Sheet: Vitamin E.National Institutes of Health, Office of Dietary Supplements. http://ods.od.nih.gov/factsheets/VitaminE-QuickFacts/. Updated October 11, 2011. Accessed October 5, 2017.

Dietary Reference Intakes for Vitamin E

The Recommended Dietary Allowances (RDAs) and Tolerable Upper Intake Levels (ULs) for different age groups for vitamin E are given in Table 9.6 “Dietary Reference Intakes for Vitamin E”.

Table 9.6 Dietary Reference Intakes for Vitamin E

Age Group RDA Males and Females mg/day UL
Infants (0–6 months) 4*
Infants (7–12 months) 5*
Children (1–3 years) 6 200
Children (4–8 years) 7 300
Children (9–13 years) 11 600
Adolescents (14–18 years) 15 800
Adults (> 19 years) 15 1,000
*denotes Adequate Intake

Source:  Dietary Supplement Fact Sheet: Vitamin E.National Institutes of Health, Office of Dietary Supplements. http://ods.od.nih.gov/factsheets/VitaminE-QuickFacts/. Updated October 11, 2011. Accessed October 5, 2017.

Vitamin E supplements often contain more than 400 international units, which is almost twenty times the RDA. The UL for vitamin E is set at 1,500 international units for adults. There is some evidence that taking vitamin E supplements at high doses has negative effects on health. As mentioned, vitamin E inhibits blood clotting and a few clinical trials have found that people taking vitamin E supplements have an increased risk of stroke. In contrast to vitamin E from supplements, there is no evidence that consuming foods containing vitamin E compromises health.

Dietary Sources of Vitamin E

Add some nuts to your salad and make your own dressing to get a healthy dietary dose of vitamin E.

A lunch salad with nuts on top

Image by rawpixel.com on unsplash.com / CC0

Vitamin E is found in many foods, especially those higher in fat, such as nuts and oils. Some spices, such as paprika and red chili pepper, and herbs, such as oregano, basil, cumin, and thyme, also contain vitamin E. (Keep in mind spices and herbs are commonly used in small amounts in cooking and therefore are a lesser source of dietary vitamin E.) See Table 10.7 “Vitamin E Content of Various Foods” for a list of foods and their vitamin E contents.

Everyday Connection

To increase your dietary intake of vitamin E from plant-based foods try a spinach salad with tomatoes and sunflower seeds, and add a dressing made with sunflower oil, oregano, and basil.

Table 9.7 Vitamin E Content of Various Foods

Food Serving Size Vitamin E (mg) Percent Daily Value
Sunflower seeds 1 oz. 7.4 37
Almonds 1 oz. 6.8 34
Sunflower oil 1 Tbsp 5.6 28
Hazelnuts 1 oz. 1 oz. 4.3 22
Peanut butter 2 Tbsp. 2.9 15
Peanuts 1 oz. 1 oz. 2.2 11
Corn oil 1 Tbsp. 1 Tbsp. 1.9 10
Kiwi 1 medium 1.1 6
Tomato 1 medium 0.7 4
Spinach 1 c. raw 0.6 3

Source: Dietary Supplement Fact Sheet: Vitamin E.National Institutes of Health, Office of Dietary Supplements. http://ods.od.nih.gov/factsheets/VitaminE-QuickFacts/. Updated October 11, 2011. Accessed October 5, 2017.

Vitamin K Functions and Health Benefits

Vitamin K refers to a group of fat-soluble vitamins that are similar in chemical structure. Vitamin K is critical for blood function acting as coenzymes which play an essential role in blood coagulation (aka blood clotting). Blood-clotting proteins are continuously circulating in the blood. Upon injury to a blood vessel, platelets stick to the wound forming a plug. Without vitamin K, blood would not clot.

A deficiency in vitamin K causes bleeding disorders. It is relatively rare, but people who have liver or pancreatic disease, celiac disease, or malabsorption conditions are at higher risk for vitamin K deficiency. Signs and symptoms include nosebleeds, easy bruising, broken blood vessels, bleeding gums, and heavy menstrual bleeding in women. The function of the anticoagulant drug warfarin is impaired by excess vitamin K intake from supplements. Calcium additionally plays a role in activation of blood-clotting proteins.

Bone Health

Vitamin K is also required for maintaining bone health. It modifies the protein osteocalcin, which is involved in the bone remodeling process. All the functions of osteocalcin and the other vitamin K-dependent proteins in bone tissue are not well understood and are under intense study. Some studies do show that people who have diets low in vitamin K also have an increased risk for bone fractures.

Dietary Reference Intake and Food Sources for Vitamin K

The AI of vitamin K for adult females is 90 micrograms per day, and for males it is 120 micrograms per day. A UL for vitamin K has not been set. The Food and Nutrition Board (FNB) has not established an UL for vitamin K because it has a low potential for toxicity. According to the FNB, “no adverse effects associated with vitamin K consumption from food or supplements have been reported in humans or animals.”

Institute of Medicine. Dietary reference intakes for vitamin A, vitamin K, arsenic, boron, chromium, copper, iodine, iron, manganese, molybdenum, nickel, silicon, vanadium, and zinc. Washington, DC: National Academy Press; 2001.

Table 9.8 Dietary Reference Intakes for Vitamin K

Age Group RDA (mcg/day)
Infants (0–6 months) 2.0*
Infants (6–12 months) 2.5*
Children (1–3 years) 30
Children (4–8 years) 55
Children (9–13 years) 60
Adolescents (14–18 years) 75
Adult Males (> 19 years) 120
Adult Females (> 19 years) 90
* denotes Adequate Intake

Source: Dietary Reference Intakes for Vitamin A, Vitamin K, Arsenic, Boron, Chromium, Copper, Iodine, Iron, Manganese, Molybdenum, Nickel, Silicon, Vanadium, and Zinc. Institute of Medicine. http://www.iom.edu/Reports/2001/Dietary-Reference-Intakes-for-Vitamin-A-Vitamin-K-Arsenic-Boron-Chromium-Copper-Iodine-Iron-Manganese-Molybdenum-Nickel-Silicon-Vanadium-and-Zinc.aspx. Published January 9, 2001. Accessed October 10, 2017.

Dietary Sources of Vitamin K

Vitamin K is present in many foods. It is found in highest concentrations in green vegetables such as broccoli, cabbage, kale, parsley, spinach, and lettuce. Additionally, vitamin K can be synthesized via bacteria in the large intestine. The exact amount of vitamin K synthesized by bacteria that is actually absorbed in the lower intestine is not known, but likely contributes less than 10 percent of the recommended intake. Newborns have low vitamin K stores and it takes time for the sterile newborn gut to acquire the good bacteria it needs to produce vitamin K. So, it has become a routine practice to inject newborns with a single intramuscular dose of vitamin K. This practice has basically eliminated vitamin K-dependent bleeding disorders in babies.

Table 9.9 Dietary Sources of Vitamin K

Food Serving Vitamin K (mcg) Percent Daily Value
Broccoli ½ c. 160 133
Asparagus 4 spears 34 28
Cabbage ½ c. 56 47
Spinach ½ c. 27 23
Green peas ½ c. 16 13
Cheese 1 oz. 10 8
Ham 3 oz. 13 11
Ground beef 3 oz. 6 5
Bread 1 slice 1.1 <1
Orange 1 e. 1.3 1

Summary of Fat-soluble Vitamins

Table 9.10 Fat-Soluble Vitamins

Vitamin Sources Recommended Intake for adults Major functions Deficiency diseases and symptoms Groups at risk of deficiency Toxicity UL
Vitamin A (retinol, retinal, retinoic acid,carotene, beta-carotene) Retinol: beef and chicken liver, skim milk, whole milk, cheddar cheese; Carotenoids: pumpkin, carrots, squash, collards, peas 700-900 mcg/day Antioxidant,vision, cell differentiation, reproduction, immune function Xerophthalmia, night blindness, eye infections; poor growth, dry skin, impaired immune function People living in poverty (especially infants and children), premature infants, pregnant and lactating women people who consume low-fat or low-protein diets Hypervitaminosis A: Dry, itchy skin, hair loss, liver damage, joint pain, fractures, birth defects, swelling of the brain 3000 mcg/day
Vitamin D Swordfish, salmon, tuna, orange juice (fortified), milk (fortified), sardines, egg, synthesis from sunlight 600-800 IU/day (15-20 mcg/day) Absorption and regulation of calcium and phosphorus, maintenance of bone Rickets in children: abnormal growth, misshapen bones, bowed legs, soft bones; osteomalacia in adults Breastfed infants, older adults people with limited sun exposure, people with dark skin Calcium deposits in soft tissues, damage to the heart, blood vessels, and kidneys 4000 IU/day (100 mcg/day)
Vitamin E Sunflower seeds, almonds, hazelnuts,peanuts 15 mg/day Antioxidant, protects cell membranes Broken red blood cells, nerve damage People with poor fat absorption, premature infants Inhibition of vitamin K clotting factors 1000 mcg/day from supplemental sources
Vitamin K Vegetable oils, leafy greens, synthesis by intestinal bacteria 90-120 mcg/day Synthesis of blood clotting proteins and proteins needed for bone health and cell growth Hemorrhage Newborns, people on long term antibiotics Anemia, brain damage ND

Water-Soluble Vitamins

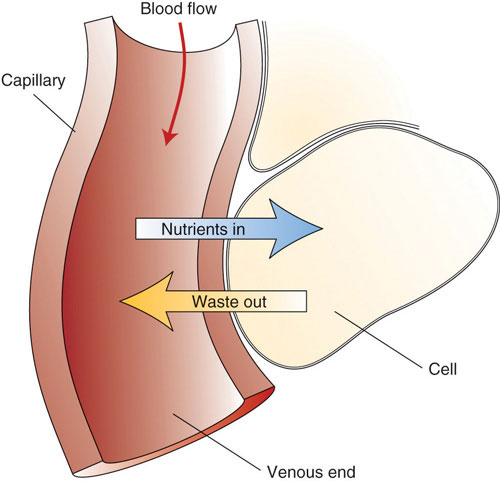
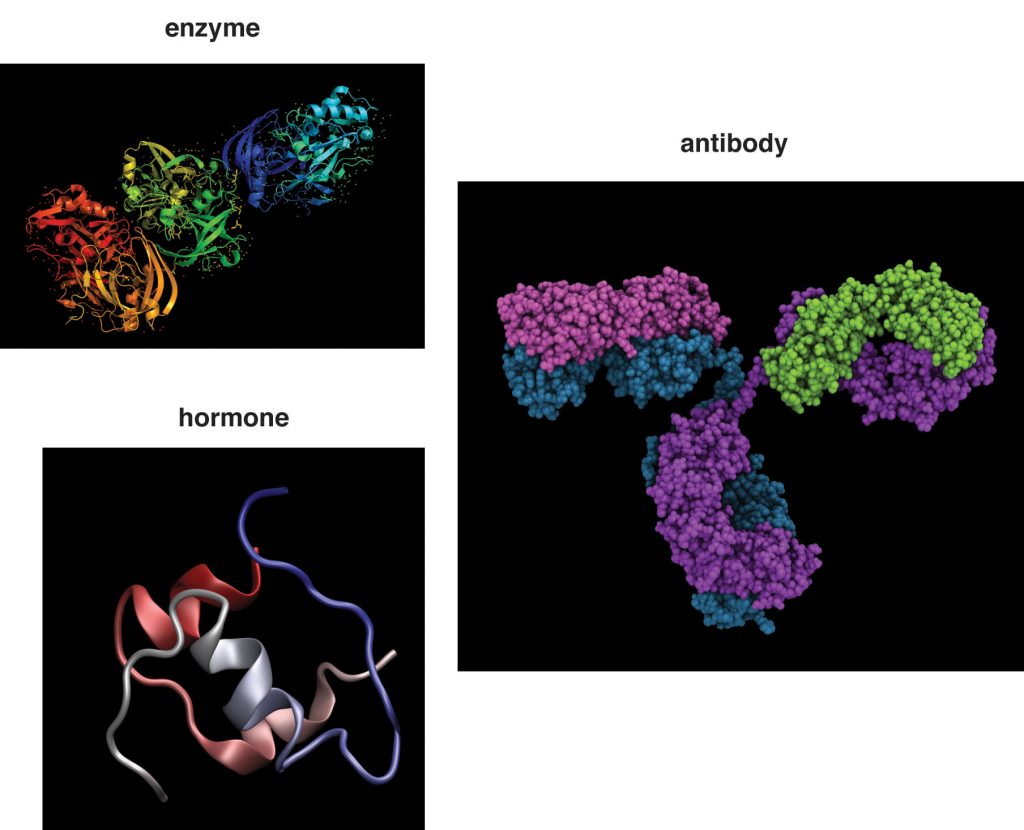
All water-soluble vitamins play a different kind of role in energy metabolism; they are required as functional parts of enzymes involved in energy release and storage. Vitamins and minerals that make up part of enzymes are referred to as coenzymes and cofactors, respectively. Coenzymes and cofactors are required by enzymes to catalyze a specific reaction. They assist in converting a substrate to an end-product. Coenzymes and cofactors are essential in catabolic pathways and play a role in many anabolic pathways too. In addition to being essential for metabolism, many vitamins and minerals are required for blood renewal and function. At insufficient levels in the diet these vitamins and minerals impair the health of blood and consequently the delivery of nutrients in and wastes out, amongst its many other functions. In this section we will focus on the vitamins that take part in metabolism and blood function and renewal.

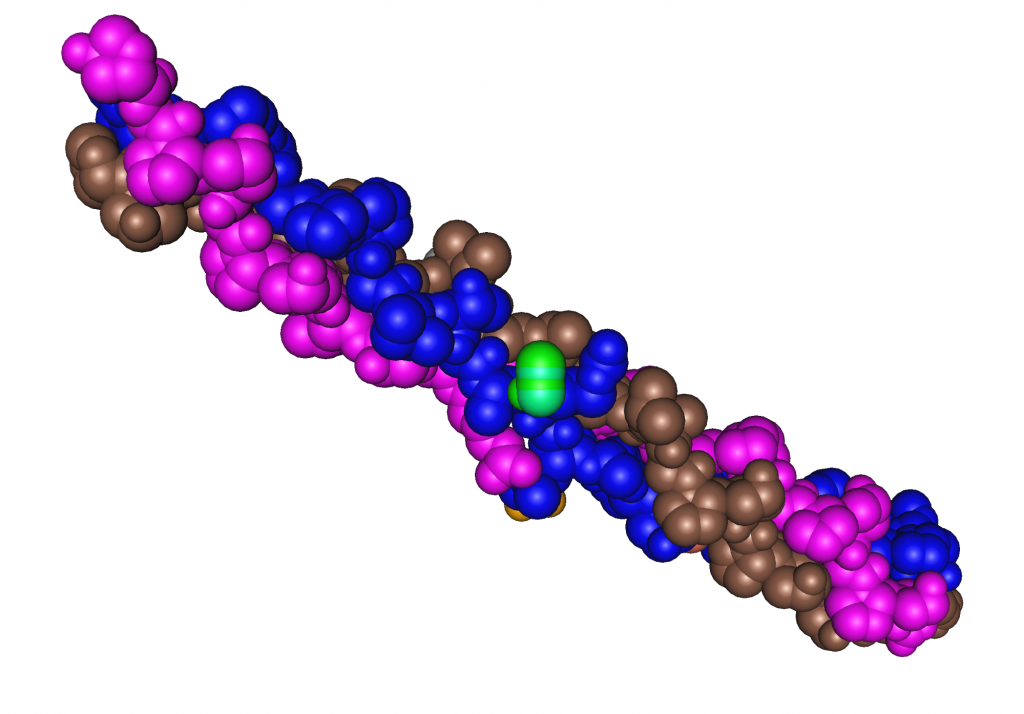
Figure 9.7 Enzyme Active Site for Cofactors

Enzyme and side for cofactor

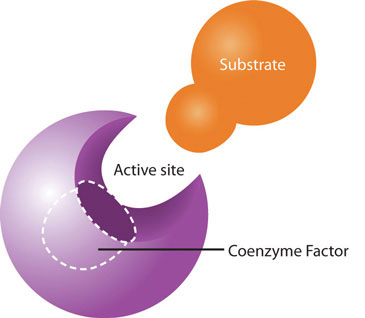
Coenzymes and cofactors are the particular vitamin or mineral required for enzymes to catalyze a specific reaction.

Vitamin C

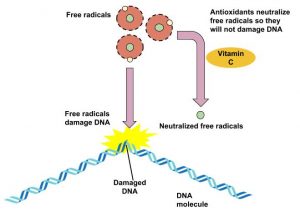
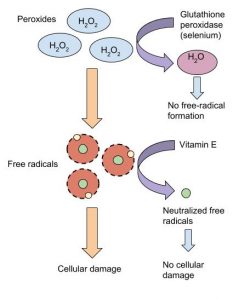
Vitamin C, also commonly called ascorbic acid, is a water-soluble micronutrient essential in the diet for humans, although most other mammals can readily synthesize it. Vitamin C’s ability to easily donate electrons makes it a highly effective antioxidant. It is effective in scavenging reactive oxygen species, reactive nitrogen species, and many other free radicals. It protects lipids both by disabling free radicals and by aiding in the regeneration of vitamin E.

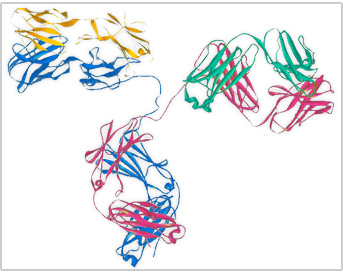
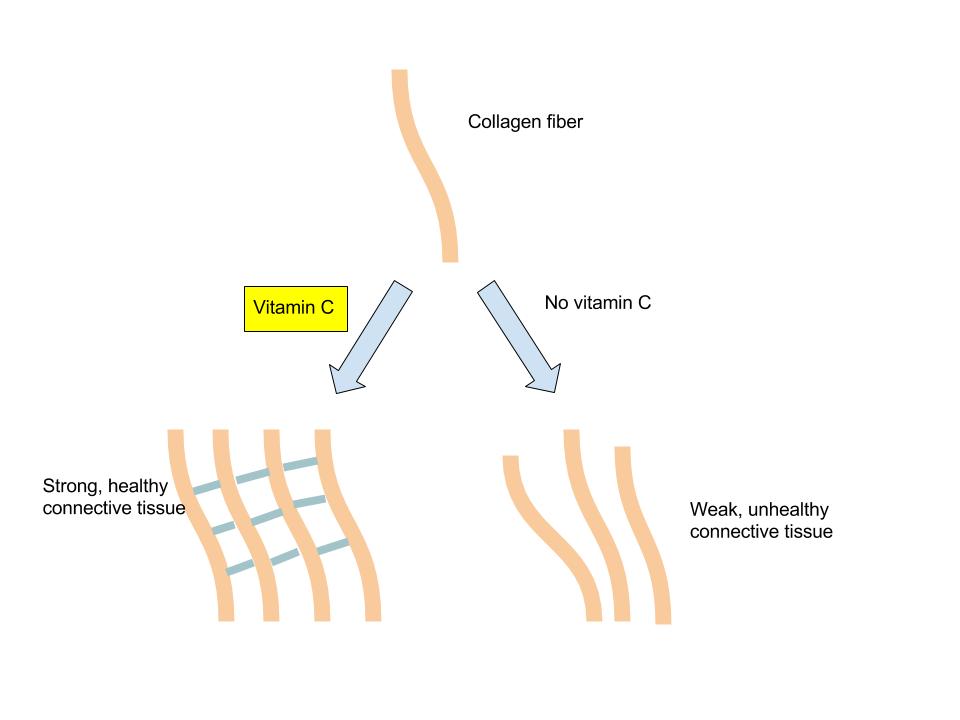
In addition to its role as an antioxidant, vitamin C is a required part of several enzymes like signaling molecules in the brain, some hormones, and amino acids. Vitamin C is also essential for the synthesis and maintenance of collagen. Collagen is the most abundant protein in the body and used for different functions such as the structure for ligaments, tendons, and blood vessels and also scars that bind wounds together. Vitamin C acts as the glue that holds the collagen fibers together and without sufficient levels in the body, collagen strands are weak and abnormal. (Figure 9.8 “The Role of Vitamin C in Collagen Synthesis”)

Figure 9.8 The Role of Vitamin C in Collagen Synthesis

Vitamin C and collagen synthesis

Image by Allison Calabrese / CC BY 4.0

Vitamin C levels in the body are affected by the amount in the diet, which influences how much is absorbed and how much the kidney allows to be excreted, such that the higher the intake, the more vitamin C is excreted. Vitamin C is not stored in any significant amount in the body, but once it has reduced a free radical, it is very effectively regenerated and therefore it can exist in the body as a functioning antioxidant for many weeks.

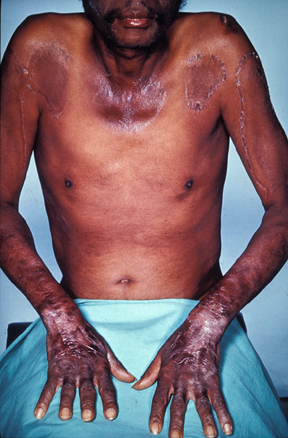
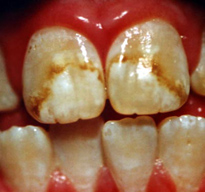
The classic condition associated with vitamin C deficiency is scurvy. The signs and symptoms of scurvy include skin disorders, bleeding gums, painful joints, weakness, depression, and increased susceptibility to infections. Scurvy is prevented by having an adequate intake of fruits and vegetables rich in vitamin C.

Figure 9.9 Bleeding Gums Associated with Scurvy

Bleeding gums in a patients mouth

Cardiovascular Disease

Vitamin C’s ability to prevent disease has been debated for many years. Overall, higher dietary intakes of vitamin C (via food intake, not supplements), are linked to decreased disease risk. A review of multiple studies published in the April 2009 issue of the Archives of Internal Medicine concludes there is moderate scientific evidence supporting the idea that higher dietary vitamin C intakes are correlated with reduced cardiovascular disease risk, but there is insufficient evidence to conclude that taking vitamin C supplements influences cardiovascular disease risk.Mente A, et al. A Systematic Review of the Evidence Supporting a Causal Link between Dietary Factors and Coronary Heart Disease. Arch Intern Med. 2009; 169(7), 659–69. http://archinte.ama-assn.org/cgi/content/full/169/7/659. Accessed October 5, 2017. Vitamin C levels in the body have been shown to correlate well with fruit and vegetable intake, and higher plasma vitamin C levels are linked to reduced risk of some chronic diseases. In a study involving over twenty thousand participants, people with the highest levels of circulating vitamin C had a 42 percent decreased risk for having a stroke.Myint PK, et al. Plasma Vitamin C Concentrations Predict Risk of Incident Stroke Over 10 Years in 20,649 Participants of the European Prospective Investigation into Cancer, Norfolk Prospective Population Study. Am J Clin Nutr. 2008; 87(1), 64–69. http://www.ajcn.org/content/87/1/64.long. Accessed September 22, 2017.

Cancer

There is some evidence that a higher vitamin C intake is linked to a reduced risk of cancers of the mouth, throat, esophagus, stomach, colon, and lung, but not all studies confirm this is true. As with the studies on cardiovascular disease, the reduced risk of cancer is the result of eating foods rich in vitamin C, such as fruits and vegetables, not from taking vitamin C supplements. In these studies, the specific protective effects of vitamin C cannot be separated from the many other beneficial chemicals in fruits and vegetables.

Immunity

Vitamin C does have several roles in the immune system, and many people increase vitamin C intake either from diet or supplements when they have a cold. Many others take vitamin C supplements routinely to prevent colds. Contrary to this popular practice, however, there is no good evidence that vitamin C prevents a cold. A review of more than fifty years of studies published in 2004 in the Cochrane Database of Systematic Reviews concluded that taking vitamin C routinely does not prevent colds in most people, but it does slightly reduce cold severity and duration. Moreover, taking megadoses (up to 4 grams per day) at the onset of a cold provides no benefits.Douglas RM, et al. Vitamin C for Preventing and Treating the Common Cold. Cochrane Database of Systematic Reviews. 2004; 4. http://www.ncbi.nlm.nih.gov/pubmed/15495002?dopt=Abstract. Accessed October 5, 2017.

Gout is a disease caused by elevated circulating levels of uric acid and is characterized by recurrent attacks of tender, hot, and painful joints. There is some evidence that a higher intake of vitamin C reduces the risk of gout.

Vitamin C Toxicity

High doses of vitamin C have been reported to cause numerous problems, but the only consistently shown side effects are gastrointestinal upset and diarrhea. To prevent these discomforts the IOM has set a UL for adults at 2,000 milligrams per day (greater than twenty times the RDA).

At very high doses in combination with iron, vitamin C has sometimes been found to increase oxidative stress, reaffirming that getting your antioxidants from foods is better than getting them from supplements, as that helps regulate your intake levels. There is some evidence that taking vitamin C supplements at high doses increases the likelihood of developing kidney stones, however, this effect is most often observed in people that already have multiple risk factors for kidney stones.

Dietary Reference Intakes for Vitamin C

The RDAs and ULs for different age groups for vitamin C are listed in Table 9.11 “Dietary Reference Intakes for Vitamin C”. They are considered adequate to prevent scurvy. Vitamin C’s effectiveness as a free radical scavenger motivated the Institute of Medicine (IOM) to increase the RDA for smokers by 35 milligrams, as tobacco smoke is an environmental and behavioral contributor to free radicals in the body.

Table 9.11 Dietary Reference Intakes for Vitamin C

Age Group RDA Males and Females mg/day UL
Infants (0–6 months) 40*
Infants (7–12 months) 50*
Children (1–3 years) 15 400
Children (4–8 years) 25 650
Children (9–13 years) 45 1200
Adolescents (14–18 years) 75 (males), 65 (females) 1800
Adults (> 19 years) 90 (males), 75 (females) 2000
*denotes Adequate Intake

Source: Dietary Supplement Fact Sheet: Vitamin C. National Institutes of Health, Office of Dietary Supplements. http://ods.od.nih.gov/factsheets/VitaminC-QuickFacts/. Updated June 24, 2011. Accessed October 5, 2017.

Dietary Sources of Vitamin C

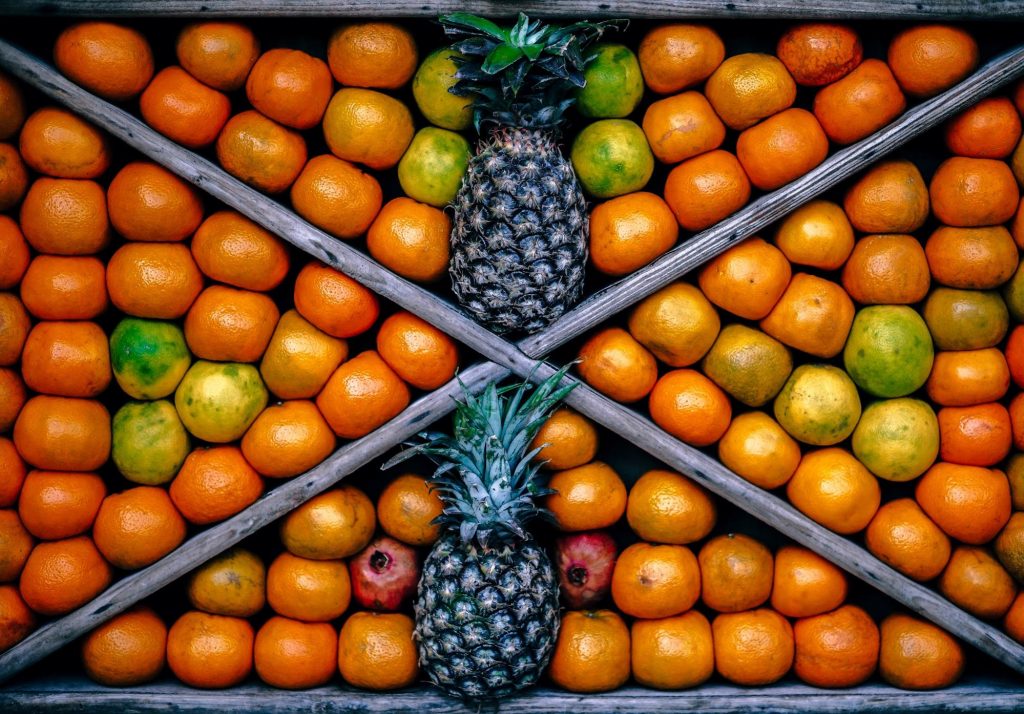
Citrus fruits are great sources of vitamin C and so are many vegetables. In fact, British sailors in the past were often referred to as “limeys” as they carried sacks of limes onto ships to prevent scurvy. Vitamin C is not found in significant amounts in animal-based foods.

Because vitamin C is water-soluble, it leaches away from foods considerably during cooking, freezing, thawing, and canning. Up to 50 percent of vitamin C can be boiled away. Therefore, to maximize vitamin C intake from foods, you should eat fruits and vegetables raw or lightly steamed. For the vitamin C content of various foods, see Table 9.12 “Vitamin C Content of Various Foods”.

Table 9.12 Vitamin C Content of Various Foods

Food Serving Vitamin C (mg) Percent Daily Value
Orange juice 6 oz. 93 155
Grapefruit juice 6 oz. 70 117
Orange 1 medium 70 117
Strawberries 1 c. 85 164
Tomato 1 medium 17 28
Sweet red pepper ½ c. raw 95 158
Broccoli ½ c. cooked 51 65
Romaine lettuce 2 c. 28 47
Cauliflower 1 c. boiled 55 86
Potato 1 medium, baked 17 28

Source:  Dietary Supplement Fact Sheet: Vitamin C. National Institutes of Health, Office of Dietary Supplements. http://ods.od.nih.gov/factsheets/VitaminC-QuickFacts/. Updated June 24, 2011. Accessed October 5, 2017.

Thiamin (B1 )

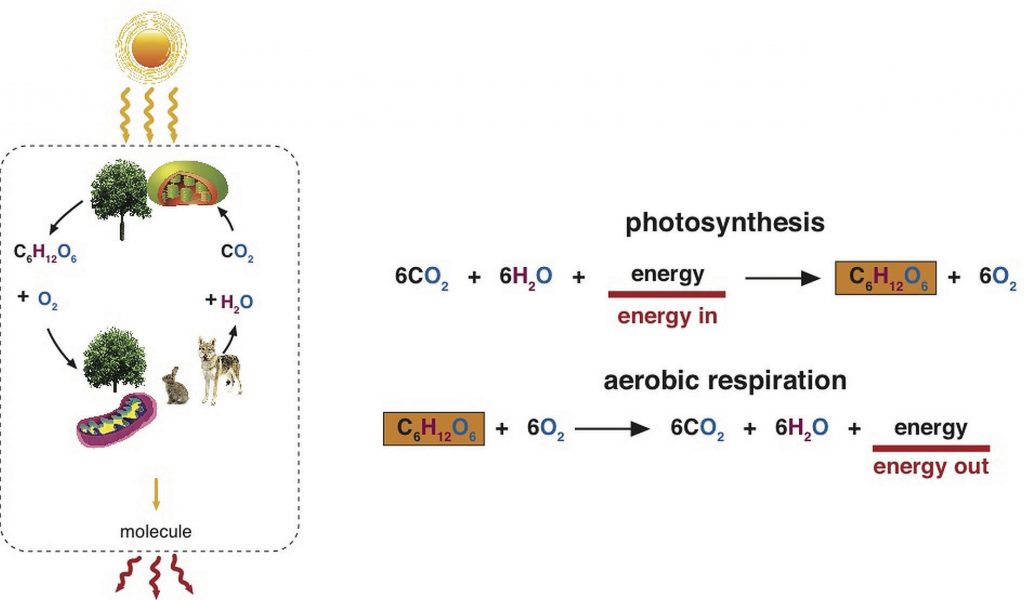
Thiamin is especially important in glucose metabolism. It acts as a cofactor for enzymes that break down glucose for energy production (Figure 9.7 “Enzyme Active Site for Cofactors” ). Thiamin plays a key role in nerve cells as the glucose that is catabolized by thiamin is needed for an energy source. Additionally, thiamin plays a role in the synthesis of neurotransmitters and is therefore required for RNA, DNA, and ATP synthesis.

The brain and heart are most affected by a deficiency in thiamin. Thiamin deficiency, also known as beriberi, can cause symptoms of fatigue, confusion, movement impairment, pain in the lower extremities, swelling, and heart failure. It is prevalent in societies whose main dietary staple is white rice. During the processing of white rice, the bran is removed, along with what were called in the early nineteenth century, “accessory factors,” that are vital for metabolism. Dutch physician Dr. Christiaan Eijkman cured chickens of beriberi by feeding them unpolished rice bran in 1897. By 1912, Sir Frederick Gowland Hopkins determined from his experiments with animals that the “accessory factors,” eventually renamed vitamins, are needed in the diet to support growth, since animals fed a diet of pure carbohydrates, proteins, fats, and minerals failed to grow.Frederick Gowland Hopkins and his Accessory Food Factors. Encyclopedia Brittanica Blog. http://www.britannica.com/blogs/2011/06/frederick-gowland-hopkins-accessory-food-factors/.Published June 20, 2011. Accessed October 1, 2011.Eijkman and Hopkins were awarded the Nobel Prize in Physiology (or Medicine) in 1929 for their discoveries in the emerging science of nutrition.

Another common thiamin deficiency known as Wernicke- Korsakoff syndrome can cause similar symptoms as beriberi such as confusion, loss of coordination, vision changes, hallucinations, and may progress to coma and death. This condition is specific to alcoholics as diets high in alcohol can cause thiamin deficiency. Other individuals at risk include individuals who also consume diets typically low in micronutrients such as those with eating disorders, elderly, and individuals who have gone through gastric bypass surgery.Fact Sheets for Health Professionals: Thiamin. National Institute of Health, Office of Dietary Supplements.  https://ods.od.nih.gov/factsheets/Thiamin-HealthProfessional/. Updated Feburary 11, 2016. Accessed October 22, 2017.

Figure 9.10 The Role of Thiamin

Diagram of Thiamin role

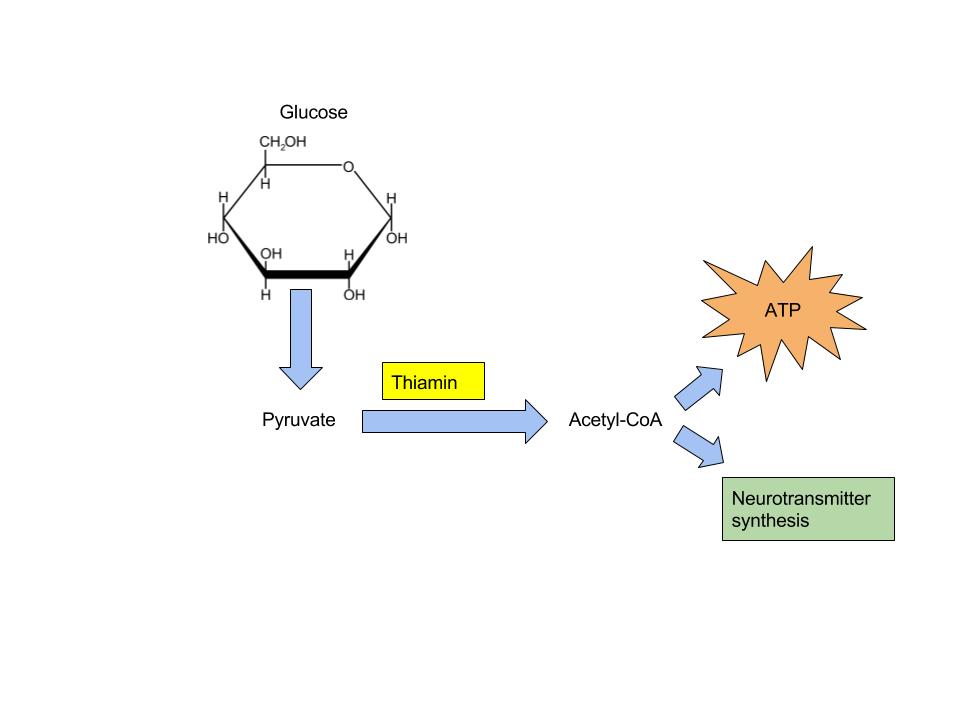
Figure 9.11 Beriberi, Thiamin Deficiency

Man effected by Thiamin deficiency

Image by Casimir Funk (1914) / No known copyright restrictions

Dietary Reference Intakes

The RDAs and ULs for different age groups for thiamin are listed in Table 9.13 “Dietary Reference Intakes for Thiamin”. There is no UL for thiamin because there has not been any reports on toxicity when excess amounts are consumed from food or supplements.

Table 9.13 Dietary Reference Intakes for Thiamin

Age Group RDA Males and Females mg/day
Infants (0–6 months) 0.2 *
Infants (7–12 months) 0.3
Children (1–3 years) 0.5
Children (4–8 years) 0.6
Children (9–13 years) 0.9
Adolescents (14–18 years) 1.2 (males), 1.0 (females)
Adults (> 19 years) 1.2 (males), 1.1 (females)
*denotes Adequate Intake

Health Professional Fact Sheet: Thiamin. National Institutes of Health, Office of Dietary Supplements.https://ods.od.nih.gov/factsheets/Thiamin-HealthProfessional/ . Updated February 11, 2016 . Accessed October 5, 2017.

Dietary Sources

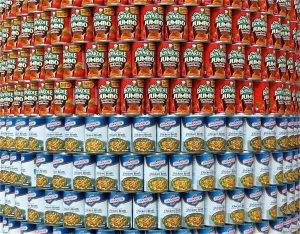
Whole grains, meat and fish are great sources of thiamin. The United States as well as many other countries, fortify their refined breads and cereals.  For the thiamin content of various foods, see Table 9.14 “Thiamin Content of Various Foods”.

Table 9.14 Thiamin Content of Various Foods

Food Serving Thiamin (mg) Percent Daily Value
Breakfast cereals, fortified 1 serving 1.5 100
White rice, enriched ½ c. 1.4 73
Pork chop, broiled 3 oz. 0.4 27
Black beans, boiled ½ c. 0.4 27
Tuna, cooked 3 oz. 0.2 13
Brown rice, cooked, not enriched ½ c. 0.1 7
Whole wheat bread 1 slice 0.1 7
2% Milk 8 oz. 0.1 7
Cheddar cheese 1 ½ oz 0 0
Apple, sliced 1 c. 0 0

Health Professional Fact Sheet: Thiamin. National Institutes of Health, Office of Dietary Supplements.https://ods.od.nih.gov/factsheets/Thiamin-HealthProfessional/ . Updated February 11, 2016 . Accessed October 5, 2017.

Riboflavin (B2)

Riboflavin is an essential component of flavoproteins, which are coenzymes involved in many metabolic pathways of carbohydrate, lipid, and protein metabolism. Flavoproteins aid in the transfer of electrons in the electron transport chain. Furthermore, the functions of other B-vitamin coenzymes, such as vitamin B6 and folate, are dependent on the actions of flavoproteins. The “flavin” portion of riboflavin gives a bright yellow color to riboflavin, an attribute that helped lead to its discovery as a vitamin. When riboflavin is taken in excess amounts (supplement form) the excess will be excreted through your kidneys and show up in your urine. Although the color may alarm you, it is harmless.  There are no adverse effects of high doses of riboflavin from foods or supplements that have been reported.

Riboflavin deficiency, sometimes referred to as ariboflavinosis, is often accompanied by other dietary deficiencies (most notably protein) and can be common in people that suffer from alcoholism. This deficiency will usually also occur in conjunction with deficiencies of other B vitamins because the majority of B vitamins have similar food sources. Its signs and symptoms include dry, scaly skin, cracking of the lips and at the corners of the mouth, sore throat, itchy eyes, and light sensitivity.

Dietary Reference Intakes

The RDAs for different age groups for riboflavin are listed in Table 9.15 “Dietary Reference Intakes for Riboflavin”. There is no UL for riboflavin because no toxicity has been reported when an excess amount has been consumed through foods or supplements.

Table 9.15 Dietary Reference Intakes for Riboflavin

Age Group RDA Males and Females mg/day
Infants (0–6 months) 0.3 *
Infants (7–12 months) 0.4*
Children (1–3 years) 0.5
Children (4–8 years) 0.6
Children (9–13 years) 0.9
Adolescents (14–18 years) 1.3 (males), 1.0 (females)
Adults (> 19 years) 1.3 (males), 1.1 (females)
*denotes Adequate Intake

Fact Sheet for Health Professionals, Riboflavin. National Institute of Health, Office of Dietary Supplements. https://ods.od.nih.gov/factsheets/Riboflavin-HealthProfessional/. Updated February 11, 2016. Accessed October 22, 2017.

Dietary Sources

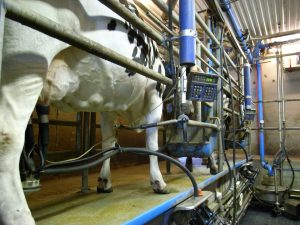
Riboflavin can be found in a variety of different foods but it is important to remember that it can be destroyed by sunlight.  Milk is one of the best sources of riboflavin in the diet and was once delivered and packaged in glass bottles. This packaging has changed to cloudy plastic containers or cardboard to help block the light from destroying the riboflavin in milk.  For the riboflavin content of various foods, see Table 9.16 Riboflavin Content of Various Foods”.

Table 9.16 Riboflavin Content of Various Foods

Food Serving Riboflavin (mg) Percent Daily Value
Beef liver 3 oz. 2.9 171
Breakfast cereals, fortified 1 serving 1.7 100
Instant oats, fortified 1 c. 1.1 65
Plain yogurt, fat free 1 c. 0.6 35
2% milk 8 oz. 0.5 29
Beef, tenderloin steak 3 oz. 0.4 24
Portabella mushrooms, sliced ½ c. 0.3 18
Almonds, dry roasted 1 oz. 0.3 18
Egg, scrambled 1 large 0.2 12
Quinoa 1 c. 0.2 12
Salmon, canned 3 oz. 0.2 12
Spinach, raw 1 c. 0.1 6
Brown rice ½ c. 0 0

Fact Sheet for Health Professionals, Riboflavin. National Institute of Health, Office of Dietary Supplements. https://ods.od.nih.gov/factsheets/Riboflavin-HealthProfessional/. Updated February 11, 2016. Accessed October 22, 2017.

Niacin (B3)

Niacin is a component of the coenzymes NADH and NADPH, which are involved in the catabolism and/or anabolism of carbohydrates, lipids, and proteins. NADH is the predominant electron carrier and transfers electrons to the electron-transport chain to make ATP. NADPH is also required for the anabolic pathways of fatty-acid and cholesterol synthesis. In contrast to other vitamins, niacin can be synthesized by humans from the amino acid tryptophan in an anabolic process requiring enzymes dependent on riboflavin, vitamin B6, and iron. Niacin is made from tryptophan only after tryptophan has met all of its other needs in the body. The contribution of tryptophan-derived niacin to niacin needs in the body varies widely and a few scientific studies have demonstrated that diets high in tryptophan have very little effect on niacin deficiency. Niacin deficiency is commonly known as pellagra and the symptoms include fatigue, decreased appetite, and indigestion.  These symptoms are then commonly followed by the four D’s: diarrhea, dermatitis, dementia, and sometimes death.

Figure 9.12  Conversion of Tryptophan to Niacin

Conversion of Niacin to vitamin B3

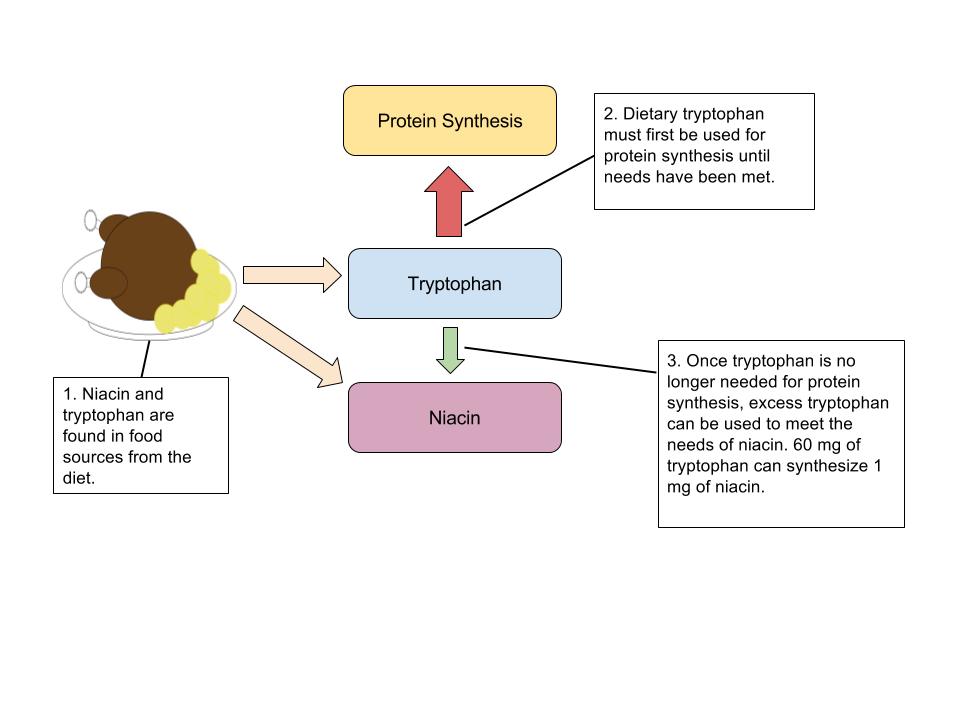
Figure 9.13 Niacin Deficiency, Pellagra

Dietary Reference Intakes

The RDAs and ULs for different age groups for Niacin are listed in Table 9.17 “Dietary Reference Intakes for Niacin “.  Because Niacin needs can be met from tryptophan, The RDA is expressed in niacin equivalents (NEs). The conversions of NE, Niacin, and tryptophan are: 1 mg NE= 60 mg tryptophan= 1 mg niacin

Table 9.17 Dietary Reference Intakes for Niacin

Age Group RDA Males and Females mg NE/day) UL
Infants (0–6 months) 2 * Not possible to establish
Infants (7–12 months) 4* Not possible to establish
Children (1–3 years) 6 10
Children (4–8 years) 8 15
Children (9–13 years) 12 20
Adolescents (14–18 years) 16 (males), 14 (females) 30
Adults (> 19 years) 16 (males), 14 (females) 35
*denotes Adequate Intake

Micronutrient Information Center: Niacin. Oregon State University, Linus Pauling Institute. http://lpi.oregonstate.edu/mic/vitamins/niacin. Updated in July 2013. Accessed October 22, 2017.

Dietary Sources

Niacin can be found in a variety of different foods such as yeast, meat, poultry, red fish, and cereal. In plants, especially mature grains, niacin can be bound to sugar molecules which can significantly decrease the niacin bioavailability. For the niacin content of various foods, see Table 9.18 “Niacin Content of Various Foods”.

Table 9.18 Niacin Content of Various Foods

Food Serving Niacin (mg) Percent Daily Value
Chicken 3 oz. 7.3 36.5
Tuna 3 oz. 8.6 43
Turkey 3 oz. 10.0 50
Salmon 3 oz. 8.5 42.5
Beef (90% lean) 3 oz. 4.4 22
Cereal (unfortified) 1 c. 5 25
Cereal (fortified) 1 c. 20 100
Peanuts 1 oz. 3.8 19
Whole wheat bread 1 slice 1.3 6.5
Coffee 8 oz. 0.5 2.5

Micronutrient Information Center: Niacin. Oregon State University, Linus Pauling Institute. http://lpi.oregonstate.edu/mic/vitamins/niacin. Updated in July 2013. Accessed October 22, 2017.

Pantothenic Acid (B5)

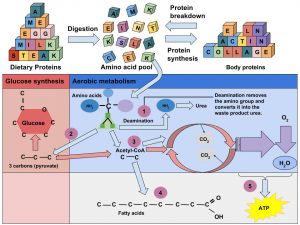
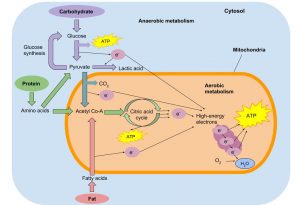
Figure 9.14 Pantothenic Acid’s Role in the Citric Acid Cycle

Citric acid cycle

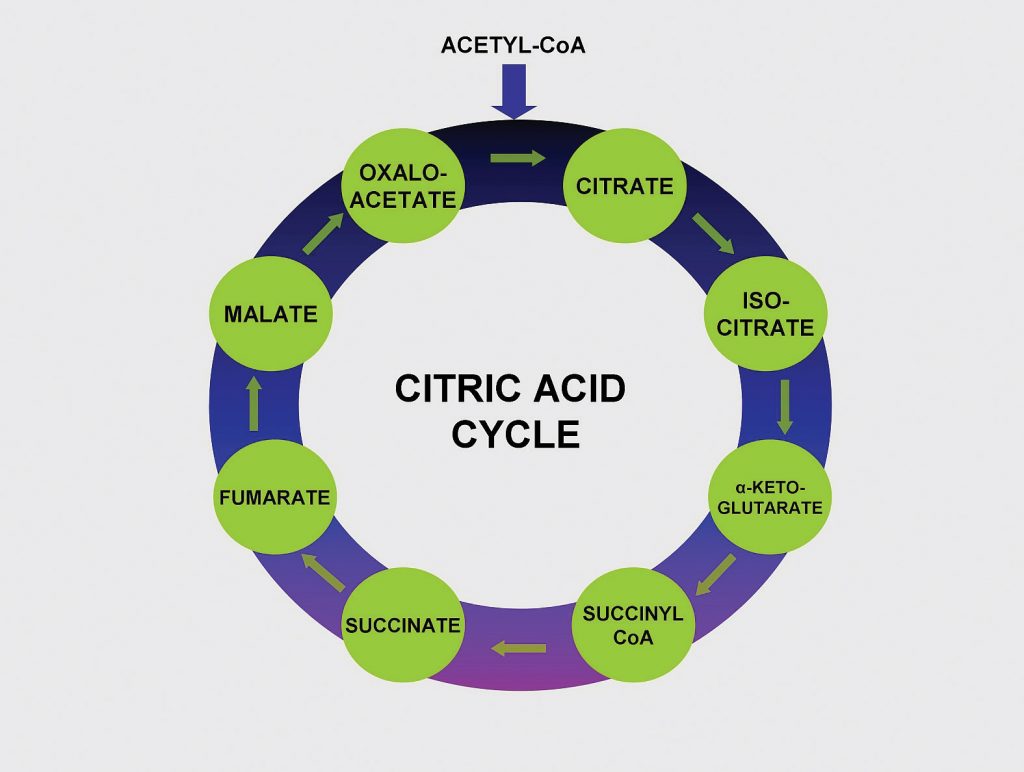
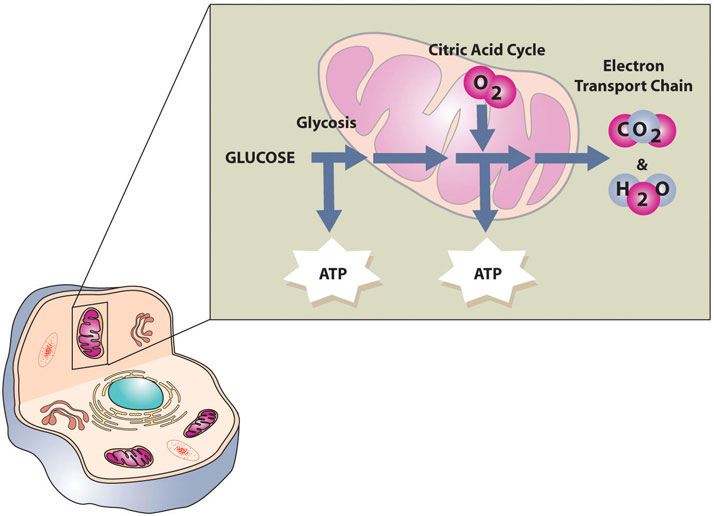
Pantothenic Acid (Vitamin B5) makes up coenzyme A, which carries the carbons of glucose, fatty acids, and amino acids into the citric acid cycle as Acetyl-CoA.

Pantothenic acid forms coenzyme A, which is the main carrier of carbon molecules in a cell. Acetyl-CoA is the carbon carrier of glucose, fatty acids, and amino acids into the citric acid cycle (Figure 9.14 “Pantothenic Acid’s Role in the Citric Acid Cycle”). Coenzyme A is also involved in the synthesis of lipids, cholesterol, and acetylcholine (a neurotransmitter). A Pantothenic Acid deficiency is exceptionally rare. Signs and symptoms include fatigue, irritability, numbness, muscle pain, and cramps. You may have seen pantothenic acid on many ingredients lists for skin and hair care products; however there is no good scientific evidence that pantothenic acid improves human skin or hair.

Dietary Reference Intakes

Because there is little information on the requirements for pantothenic acids, the Food and Nutrition Board (FNB) has developed Adequate Intakes (AI) based on the observed dietary intakes in healthy population groups. The AI for different age groups for pantothenic acid are listed in Table 9.19 “Dietary Reference Intakes for Pantothenic Acid “.

Table 9.19 Dietary Reference Intakes for Pantothenic Acid

Age Group AI Males and Females mg/day)
Infants (0–6 months) 1.7
Infants (7–12 months) 1.8
Children (1–3 years) 2
Children (4–8 years) 3
Children (9–13 years) 4
Adolescents (14–18 years) 5
Adults (> 19 years) 5

Micronutrient Information Center: Pantothenic Acid. Oregon State University, Linus Pauling Institute. http://lpi.oregonstate.edu/mic/vitamins/patothenic-acid . Updated in July 2013. Accessed October 22, 2017.

Dietary Sources

Pantothenic Acid is widely distributed in all types of food, which is why a deficiency in this nutrient is rare. Pantothenic Acid gets its name from the greek word “pantothen” which means “from everywhere”. For the pantothenic acid content of various foods, see Table 9.20 Pantothenic Acid Content of Various Foods”.

Table 9.20 Pantothenic Acid Content of Various Foods

Food Serving Pantothenic Acid (mg) Percent Daily Value
Sunflower seeds 1 oz. 2 20
Fish, trout 3 oz. 1.9 19
Yogurt, plain nonfat 8 oz. 1.6 16
Lobster 3 oz. 1.4 14
Avocado ½ fruit 1 10
Sweet potato 1 medium 1 10
Milk 8 fl oz. 0.87 8.7
Egg 1 large 0.7 7
Orange 1 whole 0.3 3
Whole wheat bread 1 slice 0. 21 2.1

Micronutrient Information Center: Pantothenic Acid. Oregon State University, Linus Pauling Institute. http://lpi.oregonstate.edu/mic/vitamins/patothenic-acid . Updated in July 2013. Accessed October 22, 2017.

Biotin

Biotin is required as a coenzyme in the citric acid cycle and in lipid metabolism. It is also required as an enzyme in the synthesis of glucose and some nonessential amino acids. A specific enzyme, biotinidase, is required to release biotin from protein so that it can be absorbed in the gut. There is some bacterial synthesis of biotin that occurs in the colon; however this is not a significant source of biotin. Biotin deficiency is rare, but can be caused by eating large amounts of egg whites over an extended period of time. This is because a protein in egg whites tightly binds to biotin making it unavailable for absorption. A rare genetic disease-causing malfunction of the biotinidase enzyme also results in biotin deficiency. Symptoms of biotin deficiency are similar to those of other B vitamins, but may also include hair loss when severe.

Dietary Reference Intakes

Because there is little information on the requirements for biotin, the FNB has developed Adequate Intakes (AI) based on the observed dietary intakes in healthy population groups. The AI for different age groups for biotin are listed in Table 9.21 “Dietary Reference Intakes for Biotin”.

Table 9.21 Dietary Reference Intakes for Biotin

Age Group AI Males and Females mcg/day)
Infants (0–6 months) 5
Infants (7–12 months) 6
Children (1–3 years) 8
Children (4–8 years) 12
Children (9–13 years) 20
Adolescents (14–18 years) 25
Adults (> 19 years) 30

Fact Sheet for Health Professionals: Biotin. National Institute of Health, Office of Dietary Supplements. https://ods.od.nih.gov/factsheets/Biotin-HealthProfessional/. Updated October 3, 2017. Accessed November 10, 2017.

Dietary Sources

Biotin can be found in foods such as eggs, fish, meat, seeds, nuts and certain vegetables. For the pantothenic acid content of various foods, see Table 9.22 Biotin Content of Various Foods”.

Table 9.22 Biotin Content of Various Foods

Food Serving Biotin (mcg) Percent Daily Value*
Eggs 1 large 10 33.3
Salmon, canned 3 oz. 5 16.6
Pork chop 3 oz. 3.8 12.6
Sunflower seeds ¼ c. 2.6 8.6
Sweet potato ½ c. 2.4 8
Almonds ¼ c. 1.5 5
Tuna, canned 3 oz. 0.6 2
Broccoli ½ c. 0.4 1.3
Banana ½ c. 0.2 0.6
* Current AI used to determine Percent Daily Value

Fact Sheet for Health Professionals: Biotin. National Institute of Health, Office of Dietary Supplements. https://ods.od.nih.gov/factsheets/Biotin-HealthProfessional/. Updated October 3, 2017. Accessed November 10, 2017.

Vitamin B6 (Pyridoxine)

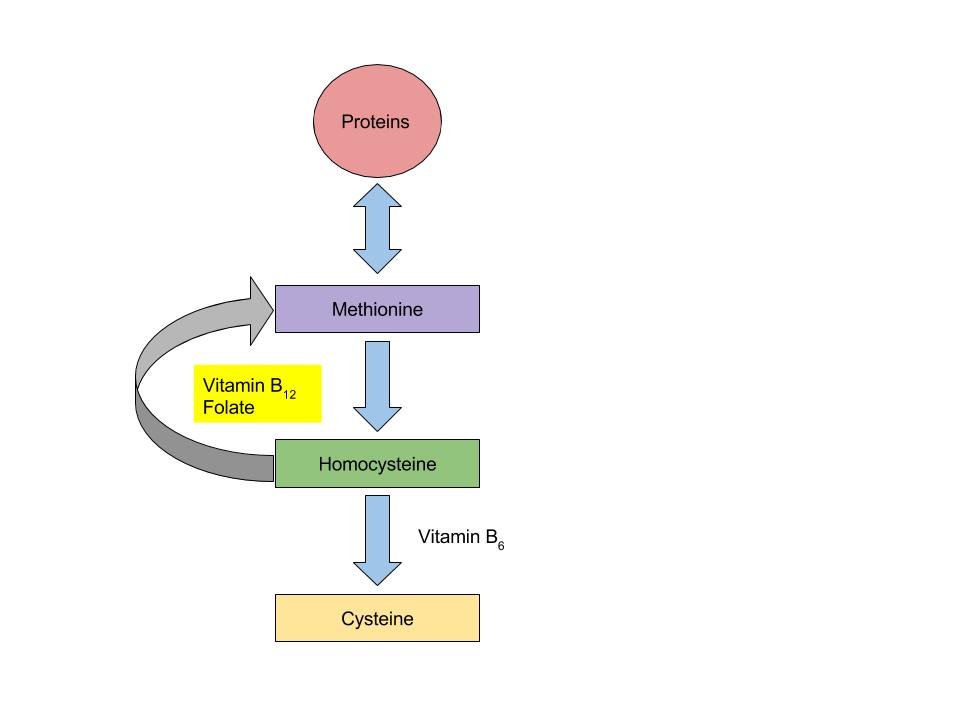
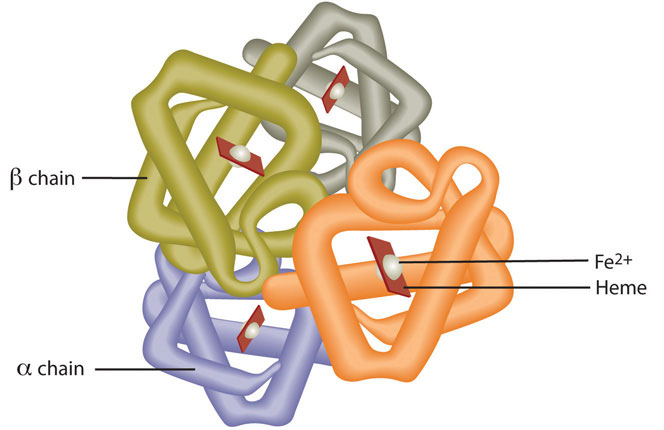
Vitamin B6 is the coenzyme involved in a wide variety of functions in the body. One major function is the nitrogen transfer between amino acids which plays a role in amino-acid synthesis and catabolism. Also, it functions to release glucose from glycogen in the catabolic pathway of glycogenolysis and is required by enzymes for the synthesis of multiple neurotransmitters and hemoglobin (Figure 9.15 “The Function of Vitamin B6 in Amino Acid Metabolism”).

Vitamin B6 is also a required coenzyme for the synthesis of hemoglobin. A deficiency in vitamin B6 can cause anemia, but it is of a different type than that caused by insufficient folate, cobalamin, or iron; although the symptoms are similar. The size of red blood cells is normal or somewhat smaller but the hemoglobin content is lower. This means each red blood cell has less capacity for carrying oxygen, resulting in muscle weakness, fatigue, and shortness of breath. Other deficiency symptoms of vitamin B6 can cause dermatitis, mouth sores, and confusion.

Figure 9.15 The Function of Vitamin B6 in Amino Acid Metabolism

The function of Vitamin B6 in Amino Acid Metabolism

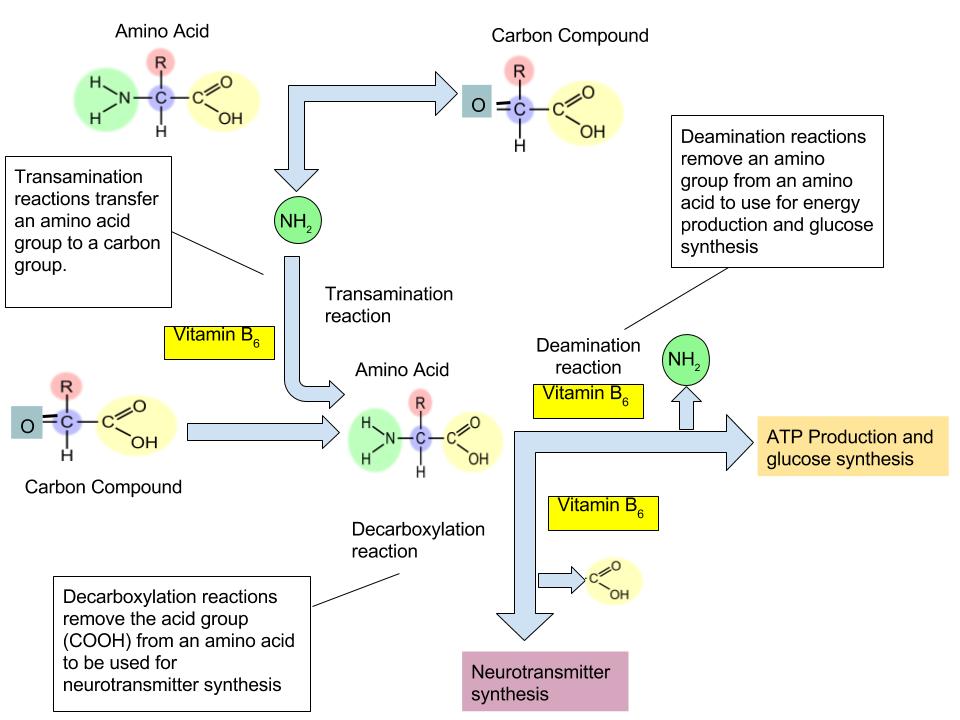
The vitamin B6 coenzyme is needed for a number of different reactions that are essential for amino acid synthesis, catabolism for energy, and the synthesis of glucose and neurotransmitters.


Figure 9.16 Vitamin B6 Functional Coenzyme Role

Vitamin B6 Functional Coenzyme Role

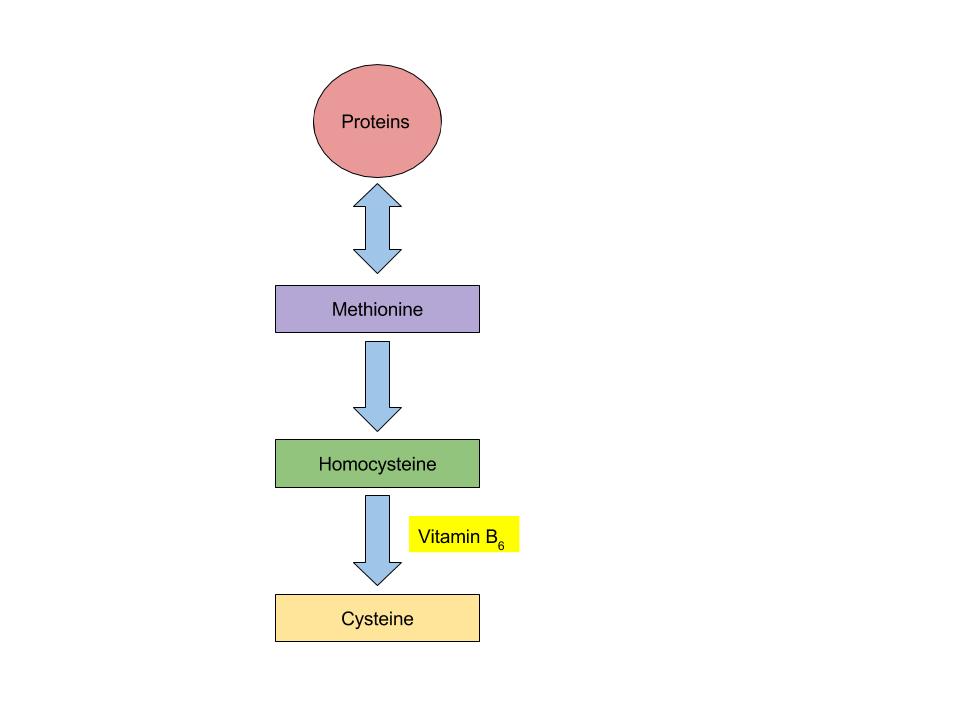
Vitamin B6 coenzyme is essential for the conversion of amino acid methionine into cysteine. With low levels of Vitamin B6, homocysteine will build up in the blood. High levels of homocysteine increases the risk for heart disease.


Vitamin B6 Toxicity

Currently, there are no adverse effects that have been associated with a high dietary intake of vitamin B6, but large supplemental doses can cause severe nerve impairment. To prevent this from occurring, the UL for adults is set at 100 mg/day.

Dietary Reference Intakes

The RDAs and ULs for different age groups for vitamin B6 are listed in Table 9.23 “Dietary Reference Intakes for Vitamin B6“.

Table 9.23 Dietary Reference Intakes for Vitamin B6

Age Group RDA Males and Females mg/day UL
Infants (0–6 months) 0.1* Not possible to determine
Infants (7–12 months) 0.3* Not possible to determine
Children (1–3 years) 0.5 30
Children (4–8 years) 0.6 40
Children (9–13 years) 1 60
Adolescents (14–18 years) 1.3 (males), 1.2 (females) 80
Adults (> 19 years) 1.3 100
*denotes Adequate Intake

Dietary Supplement Fact Sheet: Vitamin B6. National Institute of Health, Office of Dietary Supplements. https://ods.od.nih.gov/factsheets/VitaminB6-HealthProfessional/. Updates February 11, 2016. Accessed October 22, 2017.

Dietary Sources

Vitamin B6 can be found in a variety of foods. The richest sources include fish, beef liver and other organ meats, potatoes, and other starchy vegetables and fruits. For the Vitamin B6  content of various foods, see Table 9.24 Vitamin B6 Content of Various Foods”.

Table 9.24 Vitamin B6 Content of Various Foods

Food Serving Vitamin  B6 (mg) Percent Daily Value
Chickpeas 1 c. 1.1 55
Tuna, fresh 3 oz. 0.9 45
Salmon 3 oz. 0.6 30
Potatoes 1 c. 0.4 20
Banana 1 medium 0.4 20
Ground beef patty 3 oz. 0.3 10
White rice, enriched 1 c. 0.1 5
Spinach ½ c 0.1 5

Dietary Supplement Fact Sheet: Vitamin B6. National Institute of Health, Office of Dietary Supplements. https://ods.od.nih.gov/factsheets/VitaminB6-HealthProfessional/. Updates February 11, 2016. Accessed October 22, 2017.

Folate

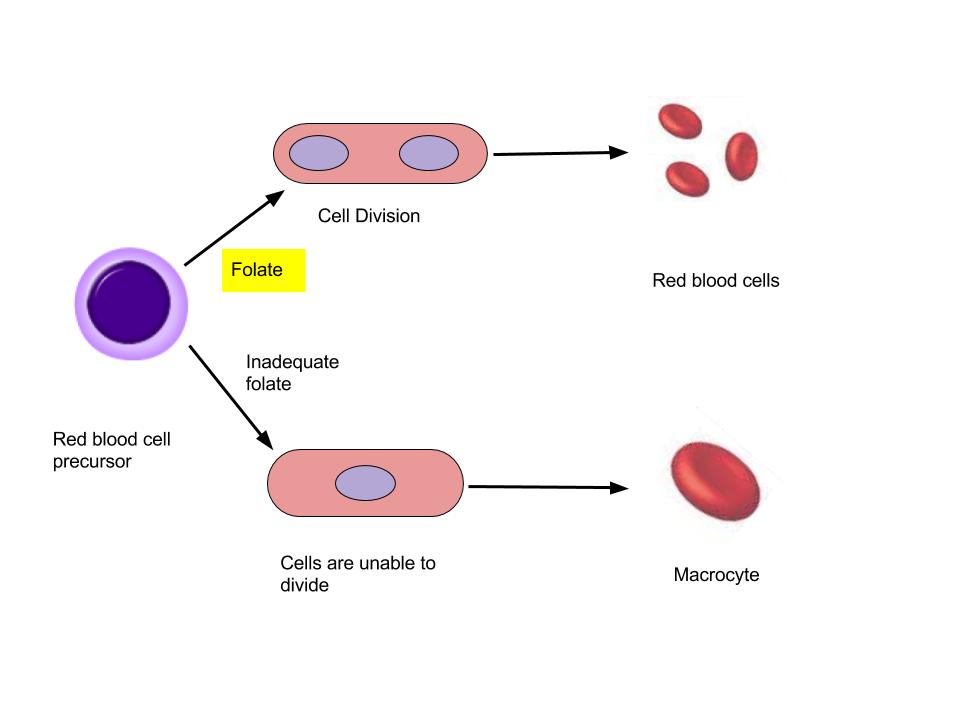
Folate is a required coenzyme for the synthesis of the amino acid methionine, and for making RNA and DNA. Therefore, rapidly dividing cells are most affected by folate deficiency. Red blood cells, white blood cells, and platelets are continuously being synthesized in the bone marrow from dividing stem cells. When folate is deficient, cells cannot divide normally A consequence of folate deficiency is macrocytic or megaloblastic anemia. Macrocytic and megaloblastic mean “big cell,” and anemia refers to fewer red blood cells or red blood cells containing less hemoglobin. Macrocytic anemia is characterized by larger and fewer red blood cells. It is caused by red blood cells being unable to produce DNA and RNA fast enough—cells grow but do not divide, making them large in size. (Figure 9.17 “Folate and the Formation of Macrocytic Anemia”)

Figure 9.17 Folate and the Formation of Macrocytic Anemia

Folate and the Formation of Macrocytic Anemia

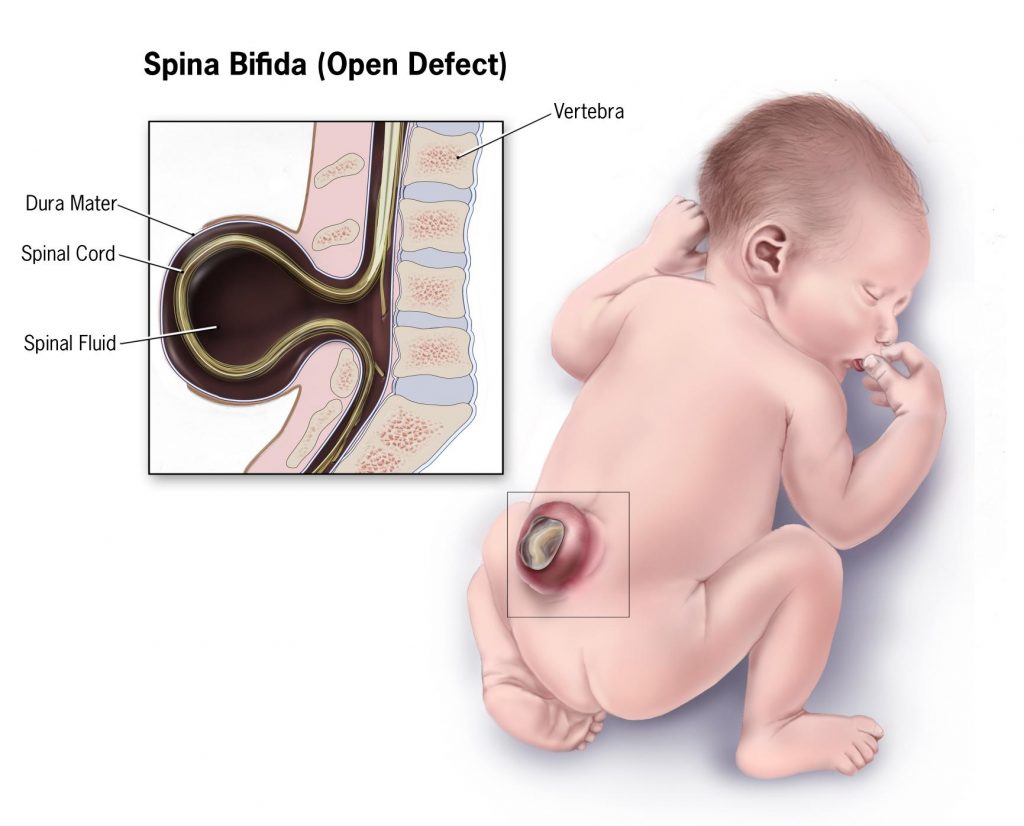
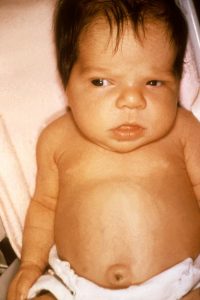
Folate is especially essential for the growth and specialization of cells of the central nervous system. Children whose mothers were folate-deficient during pregnancy have a higher risk of neural-tube birth defects. Folate deficiency is causally linked to the development of spina bifida, a neural-tube defect that occurs when the spine does not completely enclose the spinal cord. Spina bifida can lead to many physical and mental disabilities (Figure 9.18 “Spina Bifida in Infants” ). Observational studies show that the prevalence of neural-tube defects was decreased after the fortification of enriched cereal grain products with folate in 1996 in the United States (and 1998 in Canada) compared to before grain products were fortified with folate.

Additionally, results of clinical trials have demonstrated that neural-tube defects are significantly decreased in the offspring of mothers who began taking folate supplements one month prior to becoming pregnant and throughout the pregnancy. In response to the scientific evidence, the Food and Nutrition Board of the Institute of Medicine (IOM) raised the RDA for folate to 600 micrograms per day for pregnant women. Some were concerned that higher folate intakes may cause colon cancer, however scientific studies refute this hypothesis.

Figure 9.18 Spina Bifida in Infants

Spina Bifida in an infant

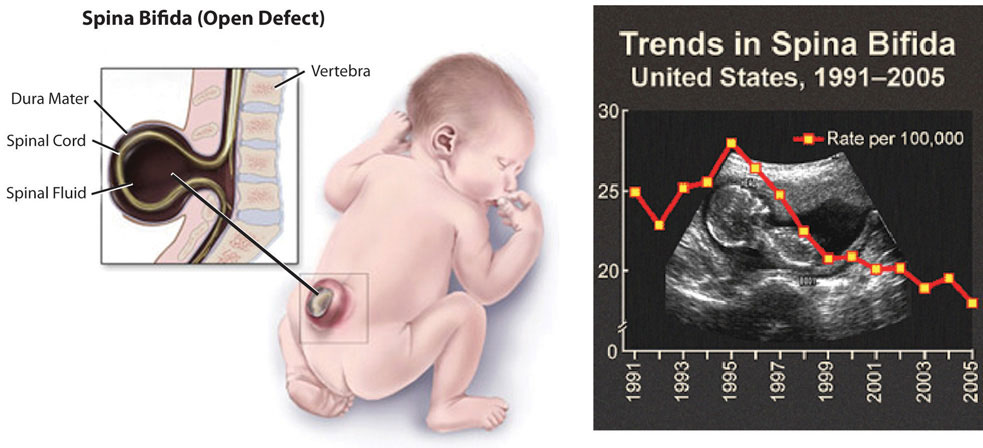
Spina bifida is a neural-tube defect that can have severe health consequences.

Dietary Reference Intakes

The RDAs and ULs for different age groups for folate are listed in Table 9.25 “Dietary Reference Intakes for Folate “. Folate is a compound that is found naturally in foods. Folic acid however is the chemical structure form that is used in dietary supplements as well as enriched foods such as grains. The FNB has developed dietary folate equivalents (DFE) to reflect the fact that folic acid is more bioavailable and easily absorbed than folate found in food. The conversions for the different forms are listed below.

1 mcg DFE = 1 mcg food folate

1mcg DFE = 0.6 mcg folic acid from fortified foods or dietary supplements consumed with foods

1 mcg DFE = 0.5 mcg folic acid from dietary supplements taken on an empty stomach

Table 9.25 Dietary Reference Intakes for Folate

Age Group RDA Males and Females mcg DFE/day UL
Infants (0–6 months) 65* Not possible to determine
Infants (7–12 months) 80* Not possible to determine
Children (1–3 years) 150 300
Children (4–8 years) 200 400
Children (9–13 years) 300 600
Adolescents (14–18 years) 400 800
Adults (> 19 years) 400 1000
*denotes Adequate Intake

Dietary Supplement Fact Sheet: Folate. National Institute of Health, Office of Dietary Supplements. https://ods.od.nih.gov/factsheets/Folate-HealthProfessional/. Updated April 20, 2016. Accessed October 22, 2017.

Dietary Sources

Folate is found naturally in a wide variety of food especially in dark leafy vegetables, fruits, and animal products. The U.S. Food and Drug Administration (FDA) began requiring manufacturers to fortify enriched breads, cereals, flours, and cornmeal to increase the consumption of folate in the American diet. For the folate content of various foods, see Table 9.26 “Folate Content of Various Foods”.

Table 9.26 Folate Content of Various Foods

Food Serving Folate (mcg DFE) Percent Daily Value
Beef Liver 3 oz. 215 54
Fortified breakfast cereals ¾ c. 400 100
Spinach ½ c. 131 33
White rice, enriched ½ c. 90 23
Asparagus 4 spears 85 20
White bread, enriched 1 slice 43 11
Broccoli 2 spears 45 10
Avocado ½ c. 59 15
Orange juice 6 oz. 35 9
Egg 1 large 22 6

Dietary Supplement Fact Sheet: Folate. National Institute of Health, Office of Dietary Supplements. https://ods.od.nih.gov/factsheets/Folate-HealthProfessional/. Updated April 20, 2016. Accessed October 22, 2017.

Vitamin B12 (Cobalamin)

Vitamin B12 contains cobalt, making it the only vitamin that contains a metal ion. Vitamin B12 is an essential part of coenzymes. It is necessary for fat and protein catabolism, for folate coenzyme function, and for hemoglobin synthesis. An enzyme requiring vitamin B12 is needed by a folate-dependent enzyme to synthesize DNA. Thus, a deficiency in vitamin B12 has similar consequences to health as folate deficiency. In children and adults vitamin B12 deficiency causes macrocytic anemia, and in babies born to cobalamin-deficient mothers there is an increased risk for neural-tube defects. In order for the human body to absorb vitamin B12, the stomach, pancreas, and small intestine must be functioning properly. Cells in the stomach secrete a protein called intrinsic factor that is necessary for vitamin B12 absorption, which occurs in the small intestine. Impairment of secretion of this protein either caused by an autoimmune disease or by chronic inflammation of the stomach (such as that occurring in some people with H.pylori infection), can lead to the disease pernicious anemia, a type of macrocytic anemia. Vitamin B12 malabsorption is most common in the elderly, who may have impaired functioning of digestive organs, a normal consequence of aging. Pernicious anemia is treated by large oral doses of vitamin B12 or by putting the vitamin under the tongue, where it is absorbed into the bloodstream without passing through the intestine. In patients that do not respond to oral or sublingual treatment vitamin B12 is given by injection.

Vitamin B12 Relationship with Folate and Vitamin B6

Figure 9.19 B Vitamins Coenzyme Roles

B Vitamins Coenzyme Roles

Vitamin B12 and folate play key roles in converting homocysteine to amino acid methionine.  As mentioned in Figure 9.19 “ Vitamin B6 Functional Coenzyme Role”, high levels of homocysteine in the blood increases the risk for heart disease. Low levels of vitamin B12, folate or vitamin B6 will increase homocysteine levels therefore increasing the risk of heart disease.

Figure 9.20 The Relationship Between Folate and Vitamin B12

The Relationship Between Folate and Vitamin B12

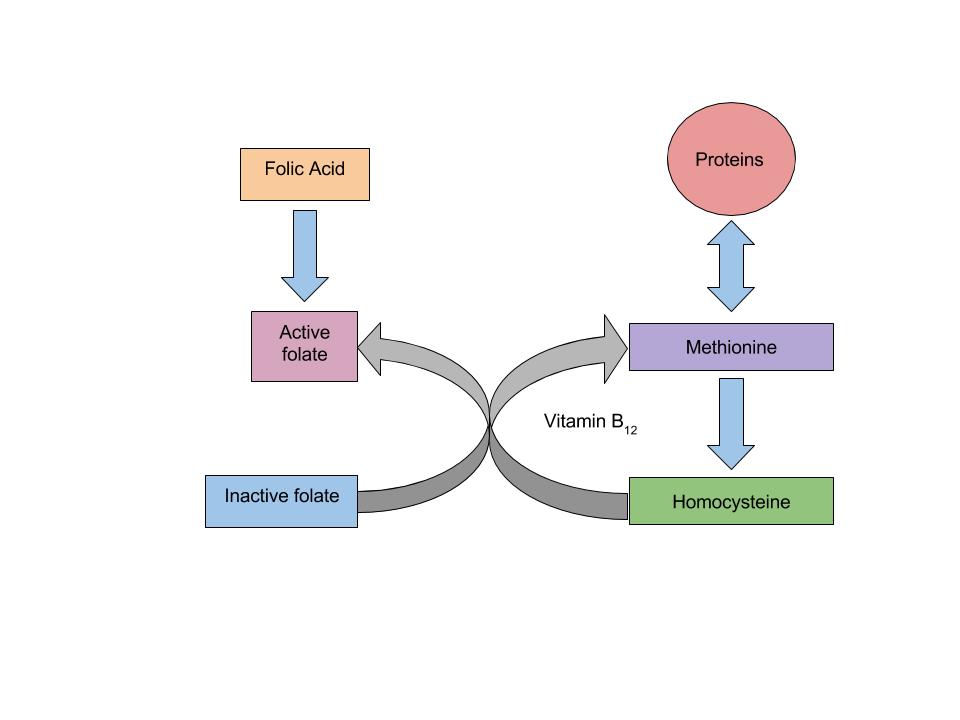
When there is a deficiency in vitamin B12 , inactive folate (from food) is unable to be converted to active folate and used in the body for the synthesis of DNA. Folic Acid however (that comes from supplements or fortified foods) is available to be used as active folate in the body without vitamin B12 .Therefore, if there is a deficiency in vitamin B12 macrocytic anemia may occur. With the fortification of foods incorporated into people’s diets, the risk of an individual developing macrocytic anemia is decreased.

Dietary Reference Intakes

The RDAs and ULs for different age groups for  Vitamin B12 are listed in Table 9.27 “Dietary Reference Intakes for Vitamin B12.

Table 9.27  Dietary Reference Intakes for Vitamin B12

Age Group RDA Males and Females mcg/day
Infants (0–6 months) 0.4*
Infants (7–12 months) 0.5*
Children (1–3 years) 0.9
Children (4–8 years) 1.2
Children (9–13 years) 1.8
Adolescents (14–18 years) 2.4
Adults (> 19 years) 2.4
*denotes Adequate Intake

Dietary Fact Sheet: Vitamin B12. National Institute of Health, Office of Dietary Supplements. https://ods.od.nih.gov/factsheets/VitaminB12-HealthProfessional/. Updated February 11, 2016. Accessed October 28, 2017.

Dietary Sources

Vitamin B12 is found naturally in animal products such as fish, meat, poultry, eggs, and milk products. Although vitamin B12 is not generally present in plant foods, fortified breakfast cereals are also a good source of vitamin B12. For the vitamin B12 content of various foods, see Table 9.28 “Vitamin B12 Content of Various Foods”.

Table 9.28 Vitamin B12 Content of Various Foods

Food Serving Vitamin B12 (mcg) Percent Daily Value
Clams 3 oz. 84.1 1,402
Salmon 3 oz. 4.8 80
Tuna, canned 3 oz. 2.5 42
Breakfast cereals, fortified 1 serving 1.5 25
Beef, top sirloin 3 oz. 1.4 23
Milk, lowfat 8 fl oz. 1.2 18
Yogurt, lowfat 8 oz. 1.1 18
Cheese, swiss 1 oz. 0.9 15
Egg 1 large 0.6 10

Dietary Fact Sheet: Vitamin B12. National Institute of Health, Office of Dietary Supplements. https://ods.od.nih.gov/factsheets/VitaminB12-HealthProfessional/. Updated February 11, 2016. Accessed October 28, 2017.

Choline

Choline is a water-soluble substance that is not classified as a vitamin because it can be synthesized by the body. However, the synthesis of choline is limited and therefore it is recognized as an essential nutrient.  Choline is need to perform functions such as the synthesis of neurotransmitter acetylcholine, the synthesis of phospholipids used to make cell membranes, lipid transport, and also homocysteine metabolism.  A deficiency in choline may lead to interfered brain development in the fetus during pregnancy, and in adults cause fatty liver and muscle damage.

Dietary Reference Intakes

There is insufficient data on choline so the FNB has developed AIs for all ages in order to prevent fatty liver disease. The AI and UL for different age groups for choline are listed in Table 9.29 “Dietary Reference Intakes for Choline”.

Table 9.29 Dietary Reference Intakes for Choline

Age Group AI Males and Females mg/day) UL
Infants (0–6 months) 125
Infants (7–12 months) 150
Children (1–3 years) 200 1000
Children (4–8 years) 250 1000
Children (9–13 years) 375 2000
Adolescents (14–18 years) 550 (males), 400 (females) 3000
Adults (> 19 years) 550 (males), 425 (females) 3500

Fact Sheet for Health Professionals: Choline. National Institute of Health, Office of Dietary Supplements. https://ods.od.nih.gov/factsheets/Choline-HealthProfessional/. Updated January 25, 2017. Accessed October 28, 2017.

Dietary Sources

Choline can be found in a variety of different foods.  The main dietary sources of choline in the United States consist of primarily animal based products. For the Choline content of various foods, see Table 9.30 “Choline Content of Various Foods”.

Table 9.30 Choline Content of Various Foods

Food Serving Choline (mg) Percent Daily Value
Egg 1 large 147 27
Soybeans ½ cup 107 19
Chicken breast 3 oz. 72 13
Mushrooms, shiitake ½ c. 58 11
Potatoes 1 large 57 10
Kidney beans ½ c. 45 8
Peanuts ¼ c. 24 4
Brown rice 1 c. 19 3

Fact Sheet for Health Professionals: Choline. National Institute of Health, Office of Dietary Supplements. https://ods.od.nih.gov/factsheets/Choline-HealthProfessional/. Updated January 25, 2017. Accessed October 28, 2017.

Summary of Water-Soluble Vitamins

Table 9.31 Water-Soluble vitamins

Vitamin Sources Recommended Intake for adults Major Functions Deficiency diseases and symptoms Groups at risk of deficiency Toxicity UL
Vitamin C (ascorbic acid) Orange juice, grapefruit juice, strawberries, tomato, sweet red pepper 75-90 mg/day Antioxidant, collagen synthesis, hormone and neurotransmitter synthesis Scurvy, bleeding gums, joint pain, poor wound healing, Smokers, alcoholics, elderly Kidney stones, GI distress, diarrhea 2000 mg/day
Thiamin (B1) Pork, enriched and whole grains, fish, legumes 1.1-1.2 mg/day Coenzyme: assists in glucose metabolism, RNA, DNA, and ATP synthesis Beriberi: fatigue, confusion, movement impairment, swelling, heart failure Alcoholics, older adults, eating disorders None reported ND
Riboflavin (B2) Beef liver, enriched breakfast cereals, yogurt, steak, mushrooms, almonds, eggs 1.1-1.3 mg/day Coenzyme: assists in glucose, fat and carbohydrate metabolism, electron carrier, other B vitamins are dependent on Ariboflavinosis: dry scaly skin, mouth inflammation and sores, sore throat, itchy eyes, light sensitivity None None reported ND
Niacin (B3) Meat, poultry,  fish, peanuts, enriched grains 14-16 NE/day Coenzyme: assists in glucose, fat, and protein metabolism, electron carrier Pellagra: diarrhea, dermatitis, dementia, death Alcoholics Nausea, rash, tingling extremities 35 mg/day from fortified foods and supplements
Pantothenic Acid (B5) Sunflower seeds, fish, dairy products, widespread in foods 5 mg/day Coenzyme: assists in glucose, fat, and protein metabolism, cholesterol and neurotransmitter synthesis Muscle numbness and pain, fatigue, irritability Alcoholics Fatigue, rash ND
B6(Pyridoxine) Meat, poultry, fish, legumes, nuts 1.3-1.7 mg/day Coenzyme; assists in amino-acid synthesis, glycogneolysis, neurotransmitter and hemoglobin synthesis Muscle weakness, dermatitis, mouth sores, fatigue, confusion Alcoholics Nerve damage 100 mg/day
Biotin Egg yolks, fish, pork, nuts and seeds 30 mcg/day Coenzyme; assists in glucose, fat, and protein metabolism, amino-acid synthesis Muscle weakness, dermatitis, fatigue, hair loss Those consuming raw egg whites None reported ND
Folate Leafy green vegetables, enriched grains, orange juice 400 mcg/day Coenzyme; amino acid synthesis, RNA, DNA, and red blood cell synthesis Diarrhea, mouth sores, confusion, anemia, neural-tube defects Pregnant women, alcoholics Masks B12 deficiency 1000 mcg/day from fortified foods and supplements
B12(cobalamin) Meats, poultry, fish 2.4 mcg/day Coenzyme; fat and protein catabolism, folate function, red-blood-cell synthesis Muscle weakness, sore tongue, anemia, nerve damage, neural-tube defects Vegans, elderly None reported ND
Choline Egg yolk, wheat, meat, fish, synthesis in the body 425-550 mg/day Synthesis of neurotransmitters and cell membranes, lipid transport Non-alcoholic fatty liver disease, muscle damage, interfered brain development in fetus None Liver damage, excessive sweating, hypotension 3500 mg/day

Do B-Vitamin Supplements Provide an Energy Boost?

Although some marketers claim taking a vitamin that contains one-thousand times the daily value of certain B vitamins boosts energy and performance, this is a myth that is not backed by science. The “feeling” of more energy from energy-boosting supplements stems from the high amount of added sugars, caffeine, and other herbal stimulants that accompany the high doses of B vitamins. As discussed, B vitamins are needed to support energy metabolism and growth, but taking in more than required does not supply you with more energy. A great analogy of this phenomenon is the gas in your car. Does it drive faster with a half-tank of gas or a full one? It does not matter; the car drives just as fast as long as it has gas. Similarly, depletion of B vitamins will cause problems in energy metabolism, but having more than is required to run metabolism does not speed it up. Buyers of B-vitamin supplements beware; B vitamins are not stored in the body and all excess will be flushed down the toilet along with the extra money spent.

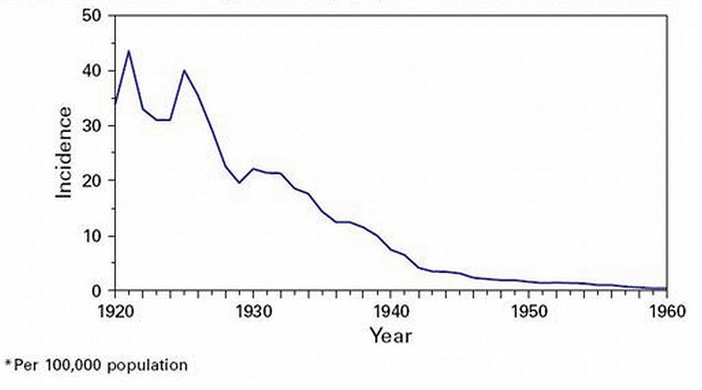
B vitamins are naturally present in numerous foods, and many other foods are enriched with them. In the United States, B-vitamin deficiencies are rare; however in the nineteenth century some vitamin-B deficiencies plagued many people in North America. Niacin deficiency, also known as pellagra, was prominent in poorer Americans whose main dietary staple was refined cornmeal. Its symptoms were severe and included diarrhea, dermatitis, dementia, and even death. Some of the health consequences of pellagra are the result of niacin being in insufficient supply to support the body’s metabolic functions.
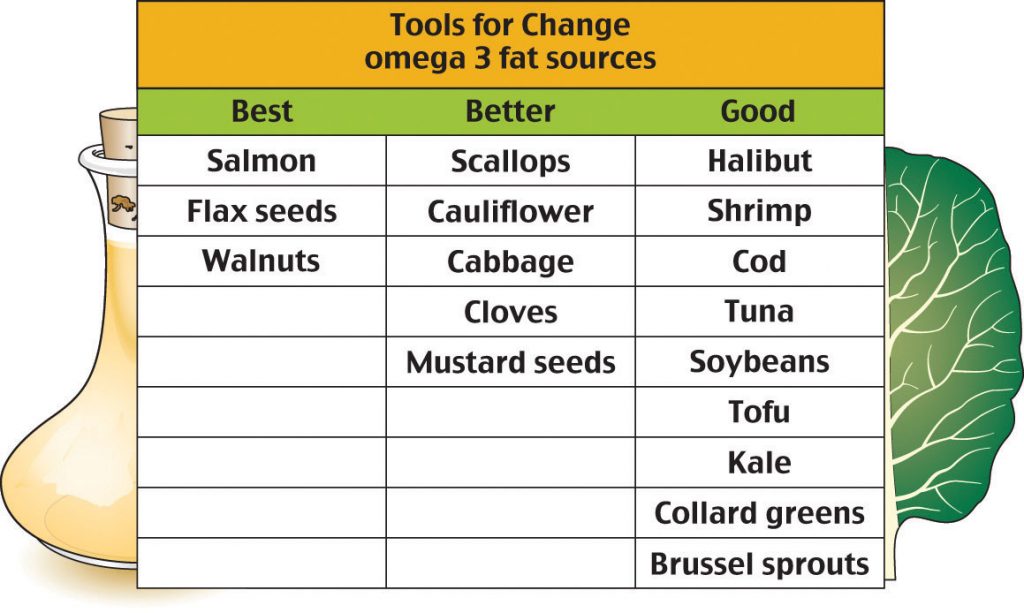
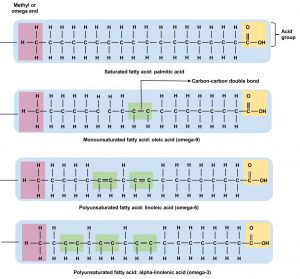
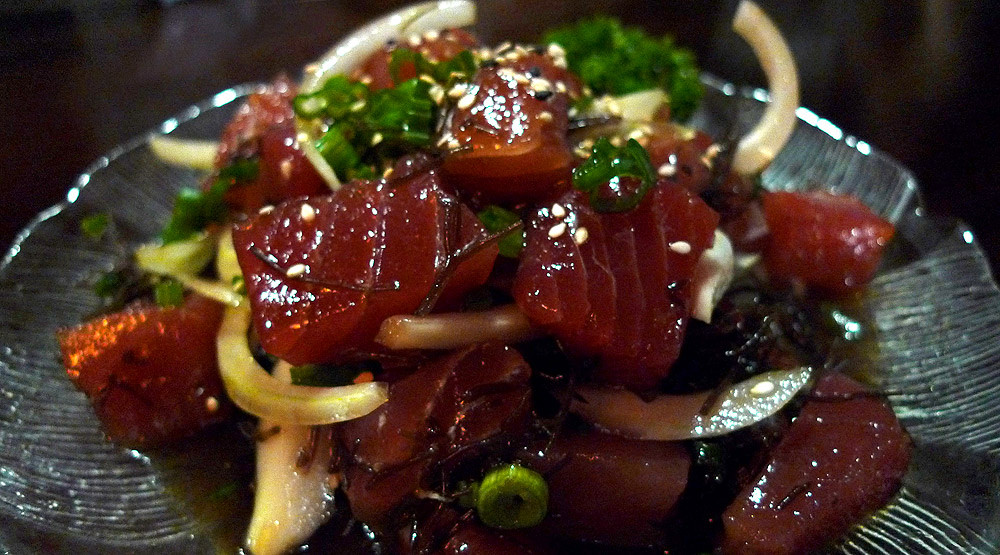
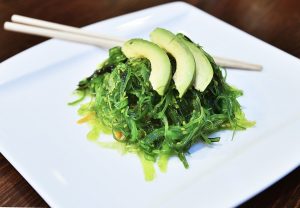
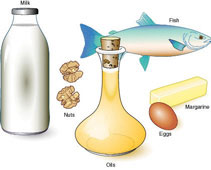
Antioxidants

The market is flooded with advertisements for “super antioxidant” supplements teeming with molecules that block free radical production, stimulate the immune system, prevent cancer, and reduce the signs of aging. Based on the antioxidant-supplement industry’s success, the general public appears to believe these health claims. However, these claims are not backed by scientific evidence; rather, there is some evidence suggesting supplements can actually cause harm. While scientists have found evidence supporting the consumption of antioxidant-rich foods as a method of reducing the risk of chronic disease, there is no “miracle cure”; no pill or supplement alone can provide the same benefits as a healthy diet. Remember, it is the combination of antioxidants and other nutrients in healthy foods that is beneficial. In this section, we will review how particular antioxidants function in the body, learn how they work together to protect the body against free radicals, and explore the best nutrient-rich dietary sources of antioxidants. One dietary source of antioxidants is vitamins. In our discussion of antioxidant vitamins, we will focus on vitamins E, C, and A.

Figure 9.21 Antioxidants Role

Antioxidant Chemicals Obtained from the Diet

There are many different antioxidants in food, including selenium, which is one of the major antioxidants. However, the antioxidants you may be the most familiar with are vitamins. The “big three” vitamin antioxidants are vitamins E, A, and C, although it may be that they are called the “big three” only because they are the most studied.

Table 9.32 Some Antioxidants Obtained from Diet and Their Related Functions

Antioxidant Functions Attributed to Antioxidant Capacity
Vitamin A Protects cellular membranes, prevents glutathione depletion, maintains free radical detoxifying enzyme systems, reduces inflammation
Vitamin E Protects cellular membranes, prevents glutathione depletion
Vitamin C Protects DNA, RNA, proteins, and lipids, aids in regenerating vitamin E
Carotenoids Free radical scavengers
Lipoic acid Free radical scavenger, aids in regeneration of vitamins C and E
Phenolic acids Free radical scavengers, protect cellular membranes

The Body’s Offense

While our bodies have acquired multiple defenses against free radicals, we also use free radicals to support its functions. For example, the immune system uses the cell-damaging properties of free radicals to kill pathogens. First, immune cells engulf an invader (such as a bacterium), then they expose it to free radicals such as hydrogen peroxide, which destroys its membrane. The invader is thus neutralized. Scientific studies also suggest hydrogen peroxide acts as a signaling molecule that calls immune cells to injury sites, meaning free radicals may aid with tissue repair when you get cut.

Free radicals are necessary for many other bodily functions as well. The thyroid gland synthesizes its own hydrogen peroxide, which is required for the production of thyroid hormone. Reactive oxygen species and reactive nitrogen species, which are free radicals containing nitrogen, have been found to interact with proteins in cells to produce signaling molecules. The free radical nitric oxide has been found to help dilate blood vessels and act as a chemical messenger in the brain. By acting as signaling molecules, free radicals are involved in the control of their own synthesis, stress responses, regulation of cell growth and death, and metabolism.

Sources of Free Radicals in the Environment

Substances and energy sources from the environment can add to or accelerate the production of free radicals within the body. Exposure to excessive sunlight, ozone, smoke, heavy metals, ionizing radiation, asbestos, and other toxic chemicals increase the amount of free radicals in the body. They do so by being free radicals themselves or by adding energy that provokes electrons to move between atoms. Excessive exposure to environmental sources of free radicals can contribute to disease by overwhelming the free radical detoxifying systems and those processes involved in repairing oxidative damage.

Oxidative Stress

Oxidative stress refers to an imbalance in any cell, tissue, or organ between the amount of free radicals and the capabilities of the detoxifying and repair systems. Sustained oxidative damage results only under conditions of oxidative stress—when the detoxifying and repair systems are insufficient. Free radical-induced damage, when left unrepaired, destroys lipids, proteins, RNA, and DNA, and can contribute to disease. Oxidative stress has been implicated as a contributing factor to cancer, atherosclerosis (hardening of arteries), arthritis, diabetes, kidney disease, Alzheimer’s disease, Parkinson’s disease, schizophrenia, bipolar disorder, emphysema, and cataracts.

Aging is a process that is genetically determined but modulated by factors in the environment. In the process of aging, tissue function declines. The idea that oxidative stress is the primary contributor to age-related tissue decline has been around for decades, and it is true that tissues accumulate free radical-induced damage as we age. Recent scientific evidence slightly modifies this theory by suggesting oxidative stress is not the initial trigger for age-related decline of tissues; it is suggested that the true culprit is progressive dysfunction of metabolic processes, which leads to increases in free radical production, thus influencing the stress response of tissues as they age.

Phytochemicals

Phytochemicals are chemicals in plants that may provide some health benefit. Carotenoids are one type of phytochemical. Phytochemicals also include indoles, lignans, phytoestrogens, stanols, saponins, terpenes, flavonoids, carotenoids, anthocyanidins, phenolic acids, and many more. They are found not only in fruits and vegetables, but also in grains, seeds, nuts, and legumes.

Many phytochemicals act as antioxidants, but they have several other functions, such as mimicking hormones, altering absorption of cholesterol, inhibiting inflammatory responses, and blocking the actions of certain enzymes.

Phytochemicals are present in small amounts in the food supply, and although thousands have been and are currently being scientifically studied, their health benefits remain largely unknown. Also largely unknown is their potential for toxicity, which could be substantial if taken in large amounts in the form of supplements. Moreover, phytochemicals often act in conjunction with each other and with micronutrients. Thus, supplementing with only a few may impair the functions of other phytochemicals or micronutrients. As with the antioxidant vitamins, it is the mixture and variety of phytochemicals in foods that are linked to health benefits.

X

Chapter 10. Major Minerals

Introduction

He puko`a kani `aina

A coral reef strengthens into land.


Choy Sum by pxhere.com / CCO

Learning Objectives

By the end of this chapter you will be able to:

  • Describe the functional role, intake recommendations and sources of major minerals

Similarly to vitamins, minerals are essential to human health and can be obtained in our diet from different types of food. Minerals are abundant in our everyday lives. From the soil in your front yard to the jewelry you wear on your body, we interact with minerals constantly. There are 20 essential minerals that must be consumed in our diets to remain healthy.  The amount of each mineral found in our bodies vary greatly and therefore, so does consumption of those minerals. When there is a deficiency in an essential mineral, health problems may arise.

Major minerals are classified as minerals that are required in the diet each day in amounts larger than 100 milligrams. These include sodium, potassium, chloride, calcium, phosphorus, magnesium, and sulfur. These major minerals can be found in various foods. For example, in Guam, the major mineral, calcium, is consumed in the diet not only through dairy, a common source of calcium, but also through through the mixed dishes, desserts and vegetables that they consume. Consuming a varied diet significantly improves an individual’s ability to meet their nutrient needs.  Pobocik RS, Trager A, Monson LM. Dietary Patterns and Food Choices of a Population Sample of Adults on Guam. Asia Pacific Journal of Clinical Nutrition. 2008; 17(1), 94-100. http://apjcn.nhri.org.tw/server/APJCN/17/1/94.pdf. Accessed February 16, 2018.  

Figure 10.1 The Major Minerals

Image by Allison Calabrese / CC BY 4.0

Bioavailability

Minerals are not as efficiently absorbed as most vitamins and so the bioavailability of minerals can be very low. Plant-based foods often contain factors, such as oxalate and phytate, that bind to minerals and inhibit their absorption. In general, minerals are better absorbed from animal-based foods. In most cases, if dietary intake of a particular mineral is increased, absorption will decrease. Some minerals influence the absorption of others. For instance, excess zinc in the diet can impair iron and copper absorption. Conversely, certain vitamins enhance mineral absorption. For example, vitamin C boosts iron absorption, and vitamin D boosts calcium and magnesium absorption. As is the case with vitamins, certain gastrointestinal disorders and diseases, such as Crohn’s disease and kidney disease, as well as the aging process, impair mineral absorption, putting people with malabsorption conditions and the elderly at higher risk for mineral deficiencies.

Calcium

Calcium’s Functional Roles

Calcium is the most abundant mineral in the body and greater than 99 percent of it is stored in bone tissue. Although only 1 percent of the calcium in the human body is found in the blood and soft tissues, it is here that it performs the most critical functions. Blood calcium levels are rigorously controlled so that if blood levels drop the body will rapidly respond by stimulating bone resorption, thereby releasing stored calcium into the blood.  Thus, bone tissue sacrifices its stored calcium to maintain blood calcium levels. This is why bone health is dependent on the intake of dietary calcium and also why blood levels of calcium do not always correspond to dietary intake.

Calcium plays a role in a number of different functions in the body like bone and tooth formation. The most well-known calcium function is to build and strengthen bones and teeth. Recall that when bone tissue first forms during the modeling or remodeling process, it is unhardened, protein-rich osteoid tissue. In the osteoblast-directed process of bone mineralization, calcium phosphates (salts) are deposited on the protein matrix. The calcium salts typically make up about 65 percent of bone tissue. When your diet is calcium deficient, the mineral content of bone decreases causing it to become brittle and weak. Thus, increased calcium intake helps to increase the mineralized content of bone tissue. Greater mineralized bone tissue corresponds to a greater BMD, and to greater bone strength. The remaining calcium plays a role in nerve impulse transmission by facilitating electrical impulse transmission from one nerve cell to another. Calcium in muscle cells is essential for muscle contraction because the flow of calcium ions are needed for the muscle proteins (actin and myosin) to interact. Calcium is also essential in blood clotting by activating clotting factors to fix damaged tissue.

In addition to calcium’s four primary functions calcium has several other minor functions that are also critical for maintaining normal physiology. For example, without calcium, the hormone insulin could not be released from cells in the pancreas and glycogen could not be broken down in muscle cells and used to provide energy for muscle contraction.

Maintaining Calcium Levels

Because calcium performs such vital functions in the body, blood calcium level is closely regulated by the hormones parathyroid hormone (PTH), calcitriol, and calcitonin. When blood calcium levels are low, PTH is secreted to increase blood calcium levels via three different mechanisms. First, PTH stimulates the release of calcium stored in the bone. Second, PTH acts on kidney cells to increase calcium reabsorption and decrease its excretion in the urine. Third, PTH stimulates enzymes in the kidney that activate vitamin D to calcitriol.  Calcitriol is the active hormone that acts on the intestinal cells and increases dietary calcium absorption. When blood calcium levels become too high, the hormone calcitonin is secreted by certain cells in the thyroid gland and PTH secretion stops.  At higher nonphysiological concentrations, calcitonin lowers blood calcium levels by increasing calcium excretion in the urine, preventing further absorption of calcium in the gut and by directly inhibiting bone resorption.

Figure 10.2 Maintaining Blood Calcium Levels

Blood Calcium Level diagram

Other Health Benefits of Calcium in the Body

Besides forming and maintaining strong bones and teeth, calcium has been shown to have other health benefits for the body, including:

Figure 10. 3 Calcium’s Effect on Aging

Calcium inadequacy is most prevalent in adolescent girls and the elderly. Proper dietary intake of calcium is critical for proper bone health.

Despite the wealth of evidence supporting the many health benefits of calcium (particularly bone health), the average American diet falls short of achieving the recommended dietary intakes of calcium. In fact, in females older than nine years of age, the average daily intake of calcium is only about 70 percent of the recommended intake. Here we will take a closer look at particular groups of people who may require extra calcium intake.

In addition, because vegans avoid dairy products, their overall consumption of calcium-rich foods may be less.

If you are lactose intolerant, have a milk allergy, are a vegan, or you simply do not like dairy products, remember that there are many plant-based foods that have a good amount of calcium and there are also some low-lactose and lactose-free dairy products on the market.

Calcium Supplements: Which One to Buy?

Many people choose to fulfill their daily calcium requirements by taking calcium supplements. Calcium supplements are sold primarily as calcium carbonate, calcium citrate, calcium lactate, and calcium phosphate, with elemental calcium contents of about 200 milligrams per pill. It is important to note that calcium carbonate requires an acidic environment in the stomach to be used effectively. Although this is not a problem for most people, it may be for those on medication to reduce stomach-acid production or for the elderly who may have a reduced ability to secrete acid in the stomach. For these people, calcium citrate may be a better choice. Otherwise, calcium carbonate is the cheapest. The body is capable of absorbing approximately 30 percent of the calcium from these forms.

Beware of Lead

There is public health concern about the lead content of some brands of calcium supplements, as supplements derived from natural sources such as oyster shell, bone meal, and dolomite (a type of rock containing calcium magnesium carbonate) are known to contain high amounts of lead. In one study conducted on twenty-two brands of calcium supplements, it was proven that eight of the brands exceeded the acceptable limit for lead content. This was found to be the case in supplements derived from oyster shell and refined calcium carbonate. The same study also found that brands claiming to be lead-free did, in fact, show very low lead levels. Because lead levels in supplements are not disclosed on labels, it is important to know that products not derived from oyster shell or other natural substances are generally low in lead content. In addition, it was also found that one brand did not disintegrate as is necessary for absorption, and one brand contained only 77 percent of the stated calcium content.Ross EA, Szabo NJ, Tebbett IR. Lead Content of Calcium Supplements. JAMA. 2000; 284, 1425–33.

Diet, Supplements, and Chelated Supplements

In general, calcium supplements perform to a lesser degree than dietary sources of calcium in providing many of the health benefits linked to higher calcium intake. This is partly attributed to the fact that dietary sources of calcium supply additional nutrients with health-promoting activities. It is reported that chelated forms of calcium supplements are easier to absorb as the chelation process protects the calcium from oxalates and phytates that may bind with the calcium in the intestines. However, these are more expensive supplements and only increase calcium absorption up to 10 percent. In people with low dietary intakes of calcium, calcium supplements have a negligible benefit on bone health in the absence of a vitamin D supplement. However, when calcium supplements are taken along with vitamin D, there are many benefits to bone health: peak bone mass is increased in early adulthood, BMD is maintained throughout adulthood, the risk of developing osteoporosis is reduced, and the incidence of fractures is decreased in those who already had osteoporosis. Calcium and vitamin D pills do not have to be taken at the same time for effectiveness. But remember that vitamin D has to be activated and in the bloodstream to promote calcium absorption. Thus, it is important to maintain an adequate intake of vitamin D.

The Calcium Debate

A recent study published in the British Medical Journal reported that people who take calcium supplements at doses equal to or greater than 500 milligrams per day in the absence of a vitamin D supplement had a 30 percent greater risk for having a heart attack.Bolland MJ. et al. Effect of Calcium Supplements on Risk of Myocardial Infarction and Cardiovascular Events: Meta-Analysis. Br Med J. 2010;  341(c3691).

Does this mean that calcium supplements are bad for you? If you look more closely at the study, you will find that 5.8 percent of people (143 people) who took calcium supplements had a heart attack, but so did 5.5 percent of the people (111) people who took the placebo. While this is one study, several other large studies have not shown that calcium supplementation increases the risk for cardiovascular disease. While the debate over this continues in the realm of science, we should focus on the things we do know:

  1. There is overwhelming evidence that diets sufficient in calcium prevent osteoporosis and cardiovascular disease.
  2. People with risk factors for osteoporosis are advised to take calcium supplements if they are unable to get enough calcium in their diet. The National Osteoporosis Foundation advises that adults age fifty and above consume 1,200 milligrams of calcium per day. This includes calcium both from dietary sources and supplements.
  3. Consuming more calcium than is recommended is not better for your health and can prove to be detrimental. Consuming too much calcium at any one time, be it from diet or supplements, impairs not only the absorption of calcium itself, but also the absorption of other essential minerals, such as iron and zinc. Since the GI tract can only handle about 500 milligrams of calcium at one time, it is recommended to have split doses of calcium supplements rather than taking a few all at once to get the RDA of calcium.

Dietary Reference Intake for Calcium

The recommended dietary allowances (RDA) for calcium are listed in Table 10.1 “Dietary Reference Intakes for Calcium”. The RDA is elevated to 1,300 milligrams per day during adolescence because this is the life stage with accelerated bone growth. Studies have shown that a higher intake of calcium during puberty increases the total amount of bone tissue that accumulates in a person. For women above age fifty and men older than seventy-one, the RDAs are also a bit higher for several reasons including that as we age, calcium absorption in the gut decreases, vitamin D3 activation is reduced, and maintaining adequate blood levels of calcium is important to prevent an acceleration of bone tissue loss (especially during menopause). Currently, the dietary intake of calcium for females above age nine is, on average, below the RDA for calcium. The Institute of Medicine (IOM) recommends that people do not consume over 2,500 milligrams per day of calcium as it may cause adverse effects in some people.

Table 10.1 Dietary Reference Intakes for Calcium

Age Group RDA (mg/day) UL (mg/day)
Infants (0–6 months) 200*
Infants (6–12 months) 260*
Children (1–3 years) 700 2,500
Children (4–8 years) 1,000 2,500
Children (9–13 years) 1,300 2,500
Adolescents (14–18 years) 1,300 2,500
Adults (19–50 years) 1,000 2,500
Adult females (50–71 years) 1,200 2,500
Adults, male & female (> 71 years) 1,200 2,500
* denotes Adequate Intake

Source: Ross AC, Manson JE, et al. The 2011 Report on Dietary Reference Intakes for Calcium and Vitamin D from the Institute of Medicine: What Clinicians Need to Know. J Clin Endocrinol Metab. 2011; 96(1), 53–8. http://www.ncbi.nlm.nih.gov/pubmed/21118827. Accessed October 10, 2017.

Dietary Sources of Calcium

In the typical American diet, calcium is obtained mostly from dairy products, primarily cheese. A slice of cheddar or Swiss cheese contains just over 200 milligrams of calcium. One cup of nonfat milk contains approximately 300 milligrams of calcium, which is about a third of the RDA for calcium for most adults. Foods fortified with calcium such as cereals, soy milk, and orange juice also provide one third or greater of the calcium RDA. Although the typical American diet relies mostly on dairy products for obtaining calcium, there are other good non-dairy sources of calcium.

Tools for Change

If you need to increase calcium intake, are a vegan, or have a food allergy to dairy products, it is helpful to know that there are some plant-based foods that are high in calcium. Tofu (made with calcium sulfate), turnip greens, mustard greens, and chinese cabbage are good sources. For a list of non-dairy sources you can find the calcium content for thousands of foods by visiting the USDA National Nutrient Database (http://www.nal.usda.gov/fnic/foodcomp/search/). When obtaining your calcium from a vegan diet, it is important to know that some plant-based foods significantly impair the absorption of calcium. These include spinach, Swiss chard, rhubarb, beets, cashews, and peanuts. With careful planning and good selections, you can ensure that you are getting enough calcium in your diet even if you do not drink milk or consume other dairy products.

Table 10.2 Calcium Content of Various Foods

Food Serving Calcium (mg) Percent Daily Value
Yogurt, low fat 8 oz. 415 42
Mozzarella 1.5 oz. 333 33
Sardines, canned with bones 3 oz. 325 33
Cheddar Cheese 1.5 oz. 307 31
Milk, nonfat 8 oz. 299 30
Soymilk, calcium fortified 8 oz. 299 30
Orange juice, calcium fortified 6 oz. 261 26
Tofu, firm, made with calcium sulfate ½ c. 253 25
Salmon, canned with bones 3 oz. 181 18
Turnip, boiled ½ c. 99 10
Kale, cooked 1 c. 94 9
Vanilla Ice Cream ½ c. 84 8
White bread 1 slice 73 7
Kale, raw 1 c. 24 2
Broccoli, raw ½ c. 21 2

Fact Sheet for Health Professionals: Calcium. National Institute of Health, Office of Dietary Supplements. https://ods.od.nih.gov/factsheets/Calcium-HealthProfessional/. Updated November 17, 2016. Accessed November 12, 2017.

Calcium Bioavailability

In the small intestine, calcium absorption primarily takes place in the duodenum (first section of the small intestine) when intakes are low, but calcium is also absorbed passively in the jejunum and ileum (second and third sections of the small intestine), especially when intakes are higher. The body doesn’t completely absorb all the calcium in food. Interestingly, the calcium in some vegetables such as kale, brussel sprouts, and bok choy is better absorbed by the body than are dairy products. About 30 percent of calcium is absorbed from milk and other dairy products.

The greatest positive influence on calcium absorption comes from having an adequate intake of vitamin D. People deficient in vitamin D absorb less than 15 percent of calcium from the foods they eat. The hormone estrogen is another factor that enhances calcium bioavailability. Thus, as a woman ages and goes through menopause, during which estrogen levels fall, the amount of calcium absorbed decreases and the risk for bone disease increases. Some fibers, such as inulin, found in jicama, onions, and garlic, also promote calcium intestinal uptake.

Chemicals that bind to calcium decrease its bioavailability. These negative effectors of calcium absorption include the oxalates in certain plants, the tannins in tea, phytates in nuts, seeds, and grains, and some fibers. Oxalates are found in high concentrations in spinach, parsley, cocoa, and beets. In general, the calcium bioavailability is inversely correlated to the oxalate content in foods. High-fiber, low-fat diets also decrease the amount of calcium absorbed, an effect likely related to how fiber and fat influence the amount of time food stays in the gut. Anything that causes diarrhea, including sickness, medications, and certain symptoms related to old age, decreases the transit time of calcium in the gut and therefore decreases calcium absorption. As we get older, stomach acidity sometimes decreases, diarrhea occurs more often, kidney function is impaired, and vitamin D absorption and activation is compromised, all of which contribute to a decrease in calcium bioavailability.

Phosphorus

Phosphorus’s Functional Role

Phosphorus is present in our bodies as part of a chemical group called a phosphate group. These phosphate groups are essential as a structural component of cell membranes (as phospholipids), DNA and RNA, energy production (ATP), and regulation of acid-base homeostasis. Phosphorus however is mostly associated with calcium as a part of the mineral structure of bones and teeth.  Blood phosphorus levels are not controlled as strictly as calcium so the PTH stimulates renal excretion of phosphate so that it does not accumulate to toxic levels.

Dietary Reference Intakes for Phosphorus

In comparison to calcium, most Americans are not at risk for having a phosphate deficiency. Phosphate is present in many foods popular in the American diet including meat, fish, dairy products, processed foods, and beverages. Phosphate is added to many foods because it acts as an emulsifying agent, prevents clumping, improves texture and taste, and extends shelf-life. The average intake of phosphorus in US adults ranges between 1,000 and 1,500 milligrams per day, well above the RDA of 700 milligrams per day. The UL set for phosphorous is 4,000 milligrams per day for adults and 3,000 milligrams per day for people over age seventy.

Table 10.3 Dietary Reference Intakes for Phosphorus

Age Group RDA (mg/day) UL (mg/day)
Infants (0–6 months) 100*
Infants (6–12 months) 275*
Children (1–3 years) 460 3,000
Children (4–8 years) 500 3,000
Children (9–13 years) 1,250 4,000
Adolescents (14–18 years) 1,250 4,000
Adults (19–70 years) 700 4,000
Adults (> 70 years) 700 3,000
* denotes Adequate Intake

Micronutrient Information Center: Phosphorus. Oregon State University, Linus Pauling Institute. http://lpi.oregonstate.edu/mic/minerals/phosphorus. Updated in July 2013. Accessed October 22, 2017.

Dietary Sources of Phosphorus

Table 10.4 Phosphorus Content of Various Foods

Foods Serving Phosphorus (mg) Percent Daily Value 1000
Salmon 3 oz. 315 32
Yogurt, nonfat 8 oz. 306 31
Turkey, light meat 3 oz. 217 22
Chicken, light meat 3 oz. 135 14
Beef 3 oz. 179 18
Lentils* ½ c. 178 18
Almonds* 1 oz. 136 14
Mozzarella 1 oz. 131 13
Peanuts* 1 oz. 108 11
Whole wheat bread 1 slice 68 7
Egg 1 large 86 9
Carbonated cola drink 12 oz. 41 4
Bread, enriched 1 slice 25 3

Micronutrient Information Center: Phosphorus. Oregon State University, Linus Pauling Institute. http://lpi.oregonstate.edu/mic/minerals/phosphorus. Updated in July 2013. Accessed October 22, 2017.

Sulfur

Sulfur is incorporated into protein structures in the body. Amino acids, methionine and cysteine contain sulfur which are essential for the antioxidant enzyme glutathione peroxidase. Some vitamins like thiamin and biotin also contain sulfur which are important in regulating acidity in the body. Sulfur is a major mineral with no recommended intake or deficiencies when protein needs are met. Sulfur is mostly consumed as a part of dietary proteins and sulfur containing vitamins.

Magnesium

Magnesium’s Functional Role

Approximately 60 percent of magnesium in the human body is stored in the skeleton, making up about 1 percent of mineralized bone tissue. Magnesium is not an integral part of the hard mineral crystals, but it does reside on the surface of the crystal and helps maximize bone structure. Observational studies link magnesium deficiency with an increased risk for osteoporosis. A magnesium-deficient diet is associated with decreased levels of parathyroid hormone and the activation of vitamin D, which may lead to an impairment of bone remodeling. A study in nine hundred elderly women and men did show that higher dietary intakes of magnesium correlated to an increased BMD in the hip.Tucker KL, Hannan MT, et al. Potassium, Magnesium, and Fruit and Vegetable Intakes Are Associated with Greater Bone Mineral Density in Elderly Men and Women. Am J ClinNutr. 1999; 69(4), 727–36. http://www.ajcn.org/cgi/pmidlookup?view=long&pmid=10197575. Accessed October 6, 2017. Only a few clinical trials have evaluated the effects of magnesium supplements on bone health and their results suggest some modest benefits on BMD.

In addition to participating in bone maintenance, magnesium has several other functions in the body. In every reaction involving the cellular energy molecule, ATP, magnesium is required. More than three hundred enzymatic reactions require magnesium. Magnesium plays a role in the synthesis of DNA and RNA, carbohydrates, and lipids, and is essential for nerve conduction and muscle contraction. Another health benefit of magnesium is that it may decrease blood pressure.

Many Americans do not get the recommended intake of magnesium from their diets. Some observational studies suggest mild magnesium deficiency is linked to increased risk for cardiovascular disease. Signs and symptoms of severe magnesium deficiency may include tremor, muscle spasms, loss of appetite, and nausea.

Dietary Reference Intake and Food Sources for Magnesium

The RDAs for magnesium for adults between ages nineteen and thirty are 400 milligrams per day for males and 310 milligrams per day for females. For adults above age thirty, the RDA increases slightly to 420 milligrams per day for males and 320 milligrams for females.

Table 10.5  Dietary Reference Intakes for Magnesium

Age Group RDA (mg/day) UL from non-food sources (mg/day)
Infants (0–6 months) 30*
Infants (6–12 months) 75*
Children (1–3 years) 80 65
Children (4–8 years) 130 110
Children (9–13 years) 240 350
Adolescents (14–18 years) 410 350
Adults (19–30 years) 400 350
Adults (> 30 years) 420 350
* denotes Adequate Intake

Source:  Dietary Supplement Fact Sheet: Magnesium. National Institutes of Health, Office of Dietary Supplements. http://ods.od.nih.gov/factsheets/Magnesium-HealthProfessional/. Updated July 13, 2009. Accessed November 12, 2017.

Dietary Sources of Magnesium

Magnesium is part of the green pigment, chlorophyll, which is vital for photosynthesis in plants; therefore green leafy vegetables are a good dietary source for magnesium. Magnesium is also found in high concentrations in fish, dairy products, meats, whole grains, and nuts. Additionally chocolate, coffee, and hard water contain a good amount of magnesium. Most people in America do not fulfill the RDA for magnesium in their diets. Typically, Western diets lean toward a low fish intake and the unbalanced consumption of refined grains versus whole grains.

Table 10.6 Magnesium Content of Various Foods

Food Serving Magnesium (mg) Percent Daily Value
Almonds 1 oz. 80 20
Cashews 1 oz. 74 19
Soymilk 1 c. 61 15
Black beans ½ c. 60 15
Edamame ½ c. 50 13
Bread 2 slices 46 12
Avocado 1 c. 44 11
Brown rice ½ c. 42 11
Yogurt 8 oz. 42 11
Oatmeal, instant 1 packet 36 9
Salmon 3 oz. 26 7
Chicken breasts 3 oz. 22 6
Apple 1 medium 9 2

Source:  Dietary Supplement Fact Sheet: Magnesium. National Institutes of Health, Office of Dietary Supplements. http://ods.od.nih.gov/factsheets/Magnesium-HealthProfessional/. Updated July 13, 2009. Accessed November 12, 2017.

Summary of Major Minerals

Table 10.7 A Summary of the  Major Minerals

Micronutrient Sources Recommended Intakes for adults Major functions Deficiency diseases and symptoms Groups at risk for deficiency Toxicity UL
Calcium Yogurt, cheese, sardines, milk, orange juice, turnip 1,000 mg/day Component of mineralized bone, provides structure and microarchitecture Increased risk of osteoporosis Postmenopausal women, those who are lactose intolerant, or vegan Kidney stones 2,500 mg
Phosphorus Salmon, yogurt, turkey, chicken, beef, lentils 700 mg/day Structural component of bones, cell membrane, DNA and RNA, and ATP Bone loss, weak bones Older adults, alcoholics None 3,000 mg
Magnesium Whole grains and legumes, almonds, cashews, hazelnuts, beets, collards, and kelp 420 mg/day Component of mineralized bone, ATP synthesis and utilization, carbohydrate, lipid, protein, RNA, and DNA synthesis Tremor, muscle spasms, loss of appetite, nausea Alcoholics, individuals with kidney and gastrointestinal disease Nausea, vomiting, low blood pressure 350 mg/day
Sulfur Protein foods None specified Structure of some vitamins and amino acids, acid-base balance None when protein needs are met None None ND
Sodium Processed foods, table salt, pork, chicken < 2,300 mg/day; ideally 1,500 mg/day Major positive extracellular ion, nerve transmission, muscle contraction, fluid balance Muscle cramps People consuming too much water, excessive sweating, those with vomiting or diarrhea High blood pressure 2,300 mg/day
Potassium Fruits, vegetables, legumes, whole grains, milk 4700 mg/day Major positive intracellular ion, nerve transmission, muscle contraction, fluid balance Irregular heartbeat, muscle cramps People consuming diets high in processed meats, those with vomiting or diarrhea Abnormal heartbeat ND
Chloride Table salt, processed foods <3600 mg/day; ideally 2300 mg/day Major negative extracellular ion, fluid balance Unlikely none None 3,600 mg/day

XI

Chapter 11. Trace Minerals

Introduction

Li‘ili‘i ka ‘ō. hiki, loloa ka lua.

Small is the crab, large is the hole

Wakame Salad Seaweed Food Cooking by maxpixel.com / CCO

Learning Objectives

By the end of this chapter you will be able to:

  • Describe the functional role, intake recommendations and sources of trace minerals

Trace minerals are classified as minerals required in the diet each day in smaller amounts, specifically 100 milligrams or less.  These include copper, zinc, selenium, iodine, chromium, fluoride, manganese, molybdenum, and others.  Although trace minerals are needed in smaller amounts it is important to remember that a deficiency in a trace mineral can be just as detrimental to your health as a major mineral deficiency. Iodine deficiency is a major concern in countries around the world such as Fiji.  In the 1990’s, almost 50% of the population had signs of iodine deficiency also known as goiter. To combat this national issue, the government of Fiji banned non-iodized salt and allowed only fortified iodized salt into the country in hopes of increasing the consumption of iodine in people’s diets.  With this law, and health promotion efforts encouraging the consumption of seafood, great progress has been made in decreasing the prevalence of iodine deficiency in Fiji.Micronutrient Deficiencies. Ministry of Health and Medical Services, Shaping Fiji’s Health. http://www.health.gov.fj/?page_id=1406. Published 2015. Accessed November 12, 2017.

Figure 11.1 The Trace Minerals

Image by Allison Calabrese / CC BY 4.0

Iron

Red blood cells contain the oxygen-carrier protein hemoglobin. It is composed of four globular peptides, each containing a heme complex. In the center of each heme, lies iron (Figure 11.2). Iron is needed for the production of other iron-containing proteins such as myoglobin.  Myoglobin is a protein found in the muscle tissues that enhances the amount of available oxygen for muscle contraction. Iron is also a key component of hundreds of metabolic enzymes. Many of the proteins of the electron-transport chain contain iron–sulfur clusters involved in the transfer of high-energy electrons and ultimately ATP synthesis. Iron is also involved in numerous metabolic reactions that take place mainly in the liver and detoxify harmful substances. Moreover, iron is required for DNA synthesis. The great majority of iron used in the body is that recycled from the continuous breakdown of red blood cells.

Figure 11.2 The Structure of Hemoglobin

Diagram of hemoglobin structure

Hemoglobin is composed of four peptides. Each contains a heme group with iron in the center.

The iron in hemoglobin binds to oxygen in the capillaries of the lungs and transports it to cells where the oxygen is released. If iron level is low hemoglobin is not synthesized in sufficient amounts and the oxygen-carrying capacity of red blood cells is reduced, resulting in anemia. When iron levels are low in the diet the small intestine more efficiently absorbs iron in an attempt to compensate for the low dietary intake, but this process cannot make up for the excessive loss of iron that occurs with chronic blood loss or low intake. When blood cells are decommissioned for use, the body recycles the iron back to the bone marrow where red blood cells are made. The body stores some iron in the bone marrow, liver, spleen, and skeletal muscle. A relatively small amount of iron is excreted when cells lining the small intestine and skin cells die and in blood loss, such as during menstrual bleeding. The lost iron must be replaced from dietary sources.

The bioavailability of iron is highly dependent on dietary sources. In animal-based foods about 60 percent of iron is bound to hemoglobin, and heme iron is more bioavailable than nonheme iron. The other 40 percent of iron in animal-based foods is nonheme, which is the only iron source in plant-based foods. Some plants contain chemicals (such as phytate, oxalates, tannins, and polyphenols) that inhibit iron absorption. Although, eating fruits and vegetables rich in vitamin C at the same time as iron-containing foods markedly increases iron absorption. A review in the American Journal of Clinical Nutrition reports that in developed countries iron bioavailability from mixed diets ranges between 14 and 18 percent, and that from vegetarian diets ranges between 5 and 12 percent.Centers for Disease Control and Prevention. “Iron and Iron Deficiency.” Accessed October 2, 2011. http://www.cdc.gov/nutrition/everyone/basics/vitamins/iron.html. Vegans are at higher risk for iron deficiency, but careful meal planning does prevent its development. Iron deficiency is the most common of all micronutrient deficiencies.

Table 11.1 Enhancers and Inhibitors of Iron Absorption

Enhancer Inhibitor
Meat Phosphate
Fish Calcium
Poultry Tea
Seafood Coffee
Stomach acid Colas
Soy protein
High doses of minerals (antacids)
Bran/fiber
Phytates
Oxalates
Polyphenols

Figure 11.3 Iron Absorption, Functions, and Loss

Iron absorption diagram


Iron Toxicity

The body excretes little iron and therefore the potential for accumulation in tissues and organs is considerable. Iron accumulation in certain tissues and organs can cause a host of health problems in children and adults including extreme fatigue, arthritis, joint pain, and severe liver and heart toxicity. In children, death has occurred from ingesting as little as 200 mg of iron and therefore it is critical to keep iron supplements out of children’s reach. The IOM has set tolerable upper intake levels of iron (Table 11.2 “Dietary Reference Intakes for Iron”). Mostly a hereditary disease, hemochromatosis is the result of a genetic mutation that leads to abnormal iron metabolism and an accumulation of iron in certain tissues such as the liver, pancreas, and heart. The signs and symptoms of hemochromatosis are similar to those of iron overload in tissues caused by high dietary intake of iron or other non-genetic metabolic abnormalities, but are often increased in severity.

Dietary Reference Intakes for Iron

Table 11.2 Dietary Reference Intakes for Iron

Age Group RDA (mg/day) UL (mg/day)
Infant (0–6 months) 0.27* 40
Infants (6–12 months) 11* 40
Children (1–3 years) 7 40
Children (4–8 years) 10 40
Children (9–13 years) 8 40
Adolescents (14–18 years) 11 (males), 15 (females) 45
Adults (19–50 years) 8 (males), 18 (females) 45
Adults (> 50 years) 8 45
* denotes Adequate Intake

Dietary Sources of Iron

Table 11.3 Iron Content of Various Foods

Food Serving Iron (mg) Percent Daily Value
Breakfast cereals, fortified 1 serving 18 100
Oysters 3 oz. 8 44
Dark chocolate 3 oz. 7 39
Beef liver 3 oz. 5 28
Lentils ½ c. 3 17
Spinach, boiled ½ c. 3 17
Tofu, firm ½ c. 3 17
Kidney beans ½ c. 2 11
Sardines 3 oz. 2 11

Iron-Deficiency Anemia

Iron-deficiency anemia is a condition that develops from having insufficient iron levels in the body resulting in fewer and smaller red blood cells containing lower amounts of hemoglobin. Regardless of the cause (be it from low dietary intake of iron or via excessive blood loss), iron-deficiency anemia has the following signs and symptoms, which are linked to the essential functions of iron in energy metabolism and blood health:
  • Fatigue
  • Weakness
  • Pale skin
  • Shortness of breath
  • Dizziness
  • Swollen, sore tongue
  • Abnormal heart rate

Iron-deficiency anemia is diagnosed from characteristic signs and symptoms and confirmed with simple blood tests that count red blood cells and determine hemoglobin and iron content in blood. Anemia is most often treated with iron supplements and increasing the consumption of foods that are higher in iron. Iron supplements have some adverse side effects including nausea, constipation, diarrhea, vomiting, and abdominal pain. Reducing the dose at first and then gradually increasing to the full dose often minimizes the side effects of iron supplements. Avoiding foods and beverages high in phytates and also tea (which contains tannic acid and polyphenols, both of which impair iron absorption), is important for people who have iron-deficiency anemia. Eating a dietary source of vitamin C at the same time as iron-containing foods improves absorption of nonheme iron in the gut. Additionally, unknown compounds that likely reside in muscle tissue of meat, poultry, and fish increase iron absorption from both heme and nonheme sources. See Table 17.2 “Enhancers and Inhibitors of Iron Absorption” for more enhancers and inhibitors for iron absorption.

Iron Deficiency: A Worldwide Nutritional Health Problem

The Centers for Disease Control and Prevention reports that iron deficiency is the most common nutritional deficiency worldwide.Iron and Iron Deficiency. Centers for Disease Control and Prevention. http://www.cdc.gov/nutrition/everyone/basics/vitamins/iron.html.Accessed October 2, 2011. The WHO estimates that 80 percent of people are iron deficient and 30 percent of the world population has iron-deficiency anemia.Anemia. The World Bank. http://web.worldbank.org/WBSITE/EXTERNAL/TOPICS/EXTHEALTHNUTRITIONANDPOPULATION/EXTPHAAG/0,,contentMDK:20588506~menuPK:1314803~pagePK:64229817~piPK:64229743 ~theSitePK:672263,00.html. Accessed October 2, 2011. The main causes of iron deficiency worldwide are parasitic worm infections in the gut causing excessive blood loss, and malaria, a parasitic disease causing the destruction of red blood cells. In the developed world, iron deficiency is more the result of dietary insufficiency and/or excessive blood loss occurring during menstruation or childbirth.

At-Risk Populations

Infants, children, adolescents, and women are the populations most at risk worldwide for iron-deficiency anemia by all causes. Infants, children, and even teens require more iron because iron is essential for growth. In these populations, iron deficiency (and eventually iron-deficiency anemia) can also cause the following signs and symptoms: poor growth, failure to thrive, and poor performance in school, as well as mental, motor, and behavioral disorders. Women who experience heavy menstrual bleeding or who are pregnant require more iron in the diet. One more high-risk group is the elderly. Both elderly men and women have a high incidence of anemia and the most common causes are dietary iron deficiency and chronic disease such as ulcer, inflammatory diseases, and cancer. Additionally, those who have recently suffered from traumatic blood loss, frequently donate blood, or take excessive antacids for heartburn need more iron in the diet.

Preventing Iron-Deficiency Anemia

In young children iron-deficiency anemia can cause significant motor, mental, and behavioral abnormalities that are long-lasting. In the United States, the high incidence of iron-deficiency anemia in infants and children was a major public-health problem prior to the early 1970s, but now the incidence has been greatly reduced. This achievement was accomplished by implementing the screening of infants for iron-deficiency anemia in the health sector as a common practice, advocating the fortification of infant formulas and cereals with iron, and distributing them in supplemental food programs, such as that within Women, Infants, and Children (WIC). Breastfeeding, iron supplementation, and delaying the introduction of cow’s milk for at least the first twelve months of life were also encouraged. These practices were implemented across the socioeconomic spectrum and by the 1980s iron-deficiency anemia in infants had significantly declined. Other solutions had to be introduced in young children, who no longer were fed breast milk or fortified formulas and were consuming cow’s milk. The following solutions were introduced to parents: provide a diet rich in sources of iron and vitamin C, limit cow’s milk consumption to less than twenty-four ounces per day, and a multivitamin containing iron.

In the third world, iron-deficiency anemia remains a significant public-health challenge. The World Bank claims that a million deaths occur every year from anemia and that the majority of those occur in Africa and Southeast Asia. The World Bank states five key interventions to combat anemia:Anemia. The World Bank. http://web.worldbank.org/WBSITE/EXTERNAL/TOPICS/EXTHEALTHNUTRITIONANDPOPULATION/EXTPHAAG/0,,contentMDK:20588506~menuPK:1314803~pagePK:64229817~piPK:64229743 ~theSitePK:672263,00.html. Accessed October 2, 2011.

  • Provide at-risk groups with iron supplements.
  • Fortify staple foods with iron and other micronutrients whose deficiencies are linked with anemia.
  • Prevent the spread of malaria and treat the hundreds of millions with the disease.
  • Provide insecticide-treated bed netting to prevent parasitic infections.
  • Treat parasitic-worm infestations in high-risk populations.

Also, there is ongoing investigation as to whether supplying iron cookware to at-risk populations is effective in preventing and treating iron-deficiency anemia.

Copper

Copper, like iron, assists in electron transfer in the electron-transport chain. Furthermore, copper is a cofactor of enzymes essential for iron absorption and transport. The other important function of copper is as an antioxidant. Symptoms of mild to moderate copper deficiency are rare. More severe copper deficiency can cause anemia from the lack of iron mobilization in the body for red blood cell synthesis. Other signs and symptoms include growth retardation in children and neurological problems, because copper is a cofactor for an enzyme that synthesizes myelin, which surrounds many nerves.

Zinc

Zinc is a cofactor for over two hundred enzymes in the human body and plays a direct role in RNA, DNA, and protein synthesis. Zinc also is a cofactor for enzymes involved in energy metabolism. As the result of its prominent roles in anabolic and energy metabolism, a zinc deficiency in infants and children blunts growth. The reliance of growth on adequate dietary zinc was discovered in the early 1960s in the Middle East where adolescent nutritional dwarfism was linked to diets containing high amounts of phytate. Cereal grains and some vegetables contain chemicals, one being phytate, which blocks the absorption of zinc and other minerals in the gut. It is estimated that half of the world’s population has a zinc-deficient diet.Prasad, Ananda. “Zinc deficiency.” BMJ 2003 February 22; 326(7386): 409–410. doi: 10.1136/bmj.326.7386.409. Accessed October 2, 2011. http://www.ncbi.nlm.nih.gov/pmc/articles/PMC1125304/?tool=pmcentrez.

This is largely a consequence of the lack of red meat and seafood in the diet and reliance on cereal grains as the main dietary staple. In adults, severe zinc deficiency can cause hair loss, diarrhea, skin sores, loss of appetite, and weight loss. Zinc is a required cofactor for an enzyme that synthesizes the heme portion of hemoglobin and severely deficient zinc diets can result in anemia.

Dietary Reference Intakes for Zinc

Table 11.4 Dietary Reference Intakes for Zinc

Age Group RDA (mg/day) UL (mg/day)
Infant (0–6 months) 2* 4
Infants (6–12 months) 3 5
Children (1–3 years) 3 7
Children (4–8 years) 5 12
Children (9–13 years) 8 23
Adolescents (14–18 years) 11 (males), 9 (females) 34
Adults (19 + years) 11 (males), 8 (females) 40
* denotes Adequate Intake

Fact Sheet for Health Professionals: Zinc. National Institute of Health, Office of Dietary Supplements. https://ods.od.nih.gov/factsheets/Zinc-HealthProfessional/. Updated February 11, 2016. Accessed November 10, 2017.

Dietary Sources of Zinc

Table 11.5 Zinc Content of Various Foods

Food Serving Zinc (mg) Percent Daily Value
Oysters 3 oz. 74 493
Beef, chuck roast 3 oz. 7 47
Crab 3 oz. 6.5 43
Lobster 3 oz. 3.4 23
Pork loin 3 oz. 2.9 19
Baked beans ½ c. 2.9 19
Yogurt, low fat 8 oz. 1.7 11
Oatmeal, instant 1 packet 1.1 7
Almonds 1 oz. 0.9 6

Fact Sheet for Health Professionals: Zinc. National Institute of Health, Office of Dietary Supplements. https://ods.od.nih.gov/factsheets/Zinc-HealthProfessional/. Updated February 11, 2016. Accessed November 10, 2017.

Selenium

Selenium is a cofactor of enzymes that release active thyroid hormone in cells and therefore low levels can cause similar signs and symptoms as iodine deficiency. The other important function of selenium is as an antioxidant.

Selenium Functions and Health Benefits

Around twenty-five known proteins require selenium to function. Some are enzymes involved in detoxifying free radicals and include glutathione peroxidases and thioredoxin reductase. As an integral functioning part of these enzymes, selenium aids in the regeneration of glutathione and oxidized vitamin C. Selenium as part of glutathione peroxidase also protects lipids from free radicals, and, in doing so, spares vitamin E. This is just one example of how antioxidants work together to protect the body against free-radical induced damage. Other functions of selenium-containing proteins include protecting endothelial cells that line tissues, converting the inactive thyroid hormone to the active form in cells, and mediating inflammatory and immune system responses.

Observational studies have demonstrated that selenium deficiency is linked to an increased risk of cancer. A review of forty-nine observational studies published in the May 2011 issue of the Cochrane Database of Systematic Reviews concluded that higher selenium exposure reduces overall cancer incidence by about 34 percent in men and 10 percent in women, but notes these studies had several limitations, including data quality, bias, and large differences among different studies.Dennert G, Zwahlen M, et al. Selenium for Preventing Cancer. Cochrane Database of Systematic Reviews. 2011; 5. http://www.ncbi.nlm.nih.gov/pubmed/21563143. Accessed November 22, 2017. Additionally, this review states that there is no convincing evidence from six clinical trials that selenium supplements reduce cancer risk.

Because of its role as a lipid protector, selenium has been suspected to prevent cardiovascular disease. In some observational studies, low levels of selenium are associated with a decreased risk of cardiovascular disease. However, other studies have not always confirmed this association and clinical trials are lacking.

Figure 11.4 Selenium’s Role in Detoxifying Free Radicals

Image by Allison Calabrese / CC BY 4.0

Dietary Reference Intakes for Selenium

The IOM has set the RDAs for selenium based on the amount required to maximize the activity of glutathione peroxidases found in blood plasma. The RDAs for different age groups are listed in Table 11.6 “Dietary Reference Intakes for Selenium”.

Table 11.6 Dietary Reference Intakes for Selenium

Age Group RDA Males and Females mcg/day UL
Infants (0–6 months) 15* 45
Infants (7–12 months) 20* 65
Children (1–3 years) 20 90
Children (4–8 years) 30 150
Children (9–13 years) 40 280
Adolescents (14–18 years) 55 400
Adults (> 19 years) 55 400
*denotes Adequate Intake

Selenium at doses several thousand times the RDA can cause acute toxicity, and when ingested in gram quantities can be fatal. Chronic exposure to foods grown in soils containing high levels of selenium (significantly above the UL) can cause brittle hair and nails, gastrointestinal discomfort, skin rashes, halitosis, fatigue, and irritability. The IOM has set the UL for selenium for adults at 400 micrograms per day.

Dietary Sources of Selenium

Organ meats, muscle meats, and seafood have the highest selenium content. Plants do not require selenium, so the selenium content in fruits and vegetables is usually low. Animals fed grains from selenium-rich soils do contain some selenium. Grains and some nuts contain selenium when grown in selenium-containing soils. See Table 11.7  “Selenium Contents of Various Foods” for the selenium content of various foods.

Table 11.7 Selenium Contents of Various Foods

Food Serving Selenium (mcg) Percent Daily Value
Brazil nuts 1 oz. 544 777
Shrimp 3 oz. 34 49
Crab meat 3 oz. 41 59
Ricotta cheese 1 c. 41 59
Salmon 3 oz. 40 57
Pork 3 oz. 35 50
Ground beef 3 oz. 18 26
Round steak 3 oz. 28.5 41
Beef liver 3 oz. 28 40
Chicken 3 oz. 13 19
Whole-wheat bread 2 slices 23 33
Couscous 1 c. 43 61
Barley, cooked 1 c. 13.5 19
Milk, low-fat 1 c. 8 11
Walnuts, black 1 oz. 5 7

Source: US Department of Agriculture, Agricultural Research Service. 2010. USDA National Nutrient Database for Standard Reference, Release 23. http://www.ars.usda.gov/ba/bhnrc/ndl.

Iodine

Recall the discovery of iodine and its use as a means of preventing goiter, a gross enlargement of the thyroid gland in the neck. Iodine is essential for the synthesis of thyroid hormone, which regulates basal metabolism, growth, and development. Low iodine levels and consequently hypothyroidism has many signs and symptoms including fatigue, sensitivity to cold, constipation, weight gain, depression, and dry, itchy skin and paleness. The development of goiter may often be the most visible sign of chronic iodine deficiency, but the consequences of low levels of thyroid hormone can be severe during infancy, childhood, and adolescence as it affects all stages of growth and development. Thyroid hormone plays a major role in brain development and growth and fetuses and infants with severe iodine deficiency develop a condition known as cretinism, in which physical and neurological impairment can be severe. The World Health Organization (WHO) estimates iodine deficiency affects over two billion people worldwide and it is the number-one cause of preventable brain damage worldwide.World Health Organization. “Iodine Status Worldwide.” Accessed October 2, 2011. http://whqlibdoc.who.int/publications/2004/9241592001.pdf.

Figure 11.5 Deaths Due to Iodine Deficiency Worldwide in 2012

Image by Chris55 / CC BY 4.0  

Figure 11.6 Iodine Deficiency: Goiter

Dietary Reference Intakes for Iodine

Table 11.8 Dietary Reference Intakes for Iodine

Age Group RDA Males and Females mcg/day UL
Infants (0–6 months) 110*
Infants (7–12 months) 130*
Children (1–3 years) 90 200
Children (4–8 years) 120 300
Children (9–13 years) 150 600
Adolescents (14–18 years) 150 900
Adults (> 19 years) 150 1,100
*denotes Adequate Intake

Health Professional Fact Sheet: Iodine. National Institute of Health, Office of Dietary Supplements. https://ods.od.nih.gov/factsheets/Iodine-HealthProfessional/. Updated June 24, 2011. Accessed November 10, 2017.

Dietary Sources of Iodine

The mineral content of foods is greatly affected by the soil from which it grew, and thus geographic location is the primary determinant of the mineral content of foods. For instance, iodine comes mostly from seawater so the greater the distance from the sea the lesser the iodine content in the soil.

Table 11.9 Iodine Content of Various Foods

Food Serving Iodine (mcg) Percent Daily Value
Seaweed 1 g. 16 to 2,984 11 to 1,989
Cod fish 3 oz. 99 66
Yogurt, low fat 8 oz. 75 50
Iodized salt 1.5 g. 71 47
Milk, reduced fat 8 oz. 56 37
Ice cream, chocolate ½ c. 30 20
Egg 1 large 24 16
Tuna, canned 3 oz. 17 11
Prunes, dried 5 prunes 13 9
Banana 1 medium 3 2

Health Professional Fact Sheet: Iodine. National Institute of Health, Office of Dietary Supplements. https://ods.od.nih.gov/factsheets/Iodine-HealthProfessional/. Updated June 24, 2011. Accessed November 10, 2017.

Chromium

The functioning of chromium in the body is less understood than that of most other minerals. It enhances the actions of insulin so plays a role in carbohydrate, fat, and protein metabolism. Currently, the results of scientific studies evaluating the usefulness of chromium supplementation in preventing and treating Type 2 diabetes are largely inconclusive. More research is needed to better determine if chromium is helpful in treating certain chronic diseases and, if so, at what doses. Dietary sources of chromium include nuts, whole grains, and yeast. The recommended intake for chromium is 35 mcg per day for adult males and 25 mcg per day for adult females. There is insufficient evidence to establish an UL for chromium.

Manganese

Manganese is a cofactor for enzymes that are required for carbohydrate and cholesterol metabolism, bone formation, and the synthesis of urea. The recommended intake for manganese is 2.3 mg per day for adult males and 1.8 mg per day for adult females.  Manganese deficiency is uncommon. The best food sources for manganese are whole grains, nuts, legumes, and green vegetables.

Molybdenum

Molybdenum also acts as a cofactor that is required for the metabolism of sulfur-containing amino acids, nitrogen-containing compounds found in DNA and RNA, and various other functions. The recommended intake for molybdenum is 46 mcg per day for both adult males and females. The food sources of molybdenum is varies depending on the content in the soil in the specific region.

Fluoride

Fluoride’s Functional Role

Fluoride is known mostly as the mineral that combats tooth decay. It assists in tooth and bone development and maintenance. Fluoride combats tooth decay via three mechanisms:

  1. Blocking acid formation by bacteria
  2. Preventing demineralization of teeth
  3. Enhancing remineralization of destroyed enamel

Fluoride was first added to drinking water in 1945 in Grand Rapids, Michigan; now over 60 percent of the US population consumes fluoridated drinking water. The Centers for Disease Control and Prevention (CDC) has reported that fluoridation of water prevents, on average, 27 percent of cavities in children and between 20 and 40 percent of cavities in adults. The CDC considers water fluoridation one of the ten great public health achievements in the twentieth century10 Great Public Health Achievements in the 20th Century. Centers for Disease Control, Morbidity and Mortality Weekly Report. 1999; 48(12), 241–43. http://www.cdc.gov/about/history/tengpha.htm. Accessed November 22, 2017..

The optimal fluoride concentration in water to prevent tooth decay ranges between 0.7–1.2 milligrams per liter. Exposure to fluoride at three to five times this concentration before the growth of permanent teeth can cause fluorosis, which is the mottling and discoloring of the teeth.

Figure 11.7 A Severe Case of Fluorosis

Teeth with discoloration due to Bellingham fluorosis

Bellingham fluorosis by Editmore / Public Domain

Fluoride’s benefits to mineralized tissues of the teeth are well substantiated, but the effects of fluoride on bone are not as well known. Fluoride is currently being researched as a potential treatment for osteoporosis. The data are inconsistent on whether consuming fluoridated water reduces the incidence of osteoporosis and fracture risk. Fluoride does stimulate osteoblast bone building activity, and fluoride therapy in patients with osteoporosis has been shown to increase BMD. In general, it appears that at low doses, fluoride treatment increases BMD in people with osteoporosis and is more effective in increasing bone quality when the intakes of calcium and vitamin D are adequate. The Food and Drug Administration has not approved fluoride for the treatment of osteoporosis mainly because its benefits are not sufficiently known and it has several side effects including frequent stomach upset and joint pain. The doses of fluoride used to treat osteoporosis are much greater than that in fluoridated water.

Dietary Reference Intake

The IOM has given Adequate Intakes (AI) for fluoride, but has not yet developed RDAs. The AIs are based on the doses of fluoride shown to reduce the incidence of cavities, but not cause dental fluorosis. From infancy to adolescence, the AIs for fluoride increase from 0.01 milligrams per day for ages less than six months to 2 milligrams per day for those between the ages of fourteen and eighteen. In adulthood, the AI for males is 4 milligrams per day and for females is 3 milligrams per day. The UL for young children is set at 1.3 and 2.2 milligrams per day for girls and boys, respectively. For adults, the UL is set at 10 milligrams per day.

Table 11.10 Dietary Reference Intakes for Fluoride

Age Group AI (mg/day) UL (mg/day)
Infants (0–6 months) 0.01 0.7
Infants (6–12 months) 0.50 0.9
Children (1–3 years) 0.70 1.3
Children (4–8 years) 1.00 2.2
Children (9–13 years) 2.00 10.0
Adolescents (14–18 years) 3.00 10.0
Adult Males (> 19 years) 4.00 10.0
Adult Females (> 19 years) 3.00 10.0

Source: Institute of Medicine. Dietary Reference Intakes for Calcium, Phosphorus, Magnesium, Vitamin D, and Fluoride. January 1, 1997. http://www.iom.edu/Reports/1997/Dietary-Reference-Intakes-for-Calcium-Phosphorus-Magnesium-Vitamin-D-and-Fluoride.aspx..

Dietary Sources of Fluoride

Greater than 70 percent of a person’s fluoride comes from drinking fluoridated water when they live in a community that fluoridates the drinking water. Other beverages with a high amount of fluoride include teas and grape juice. Solid foods do not contain a large amount of fluoride. Fluoride content in foods depends on whether it was grown in soils and water that contained fluoride or cooked with fluoridated water. Canned meats and fish that contain bones do contain some fluoride.
Table 11.11 Fluoride Content of Various Foods
Food Serving Fluoride (mg) Percent Daily Value*
Fruit Juice 3.5 fl oz. 0.02-2.1 0.7-70
Crab, canned 3.5 oz. 0.21 7
Rice, cooked 3.5 oz. 0.04 1.3
Fish, cooked 3.5 oz. 0.02 0.7
Chicken 3.5 oz. 0.015 0.5
* Current AI used to determine Percent Daily Value

Micronutrient Information Center: Fluoride. Oregon State University, Linus Pauling Institute. lpi.oregonstate.edu/mic/minerals/fluoride . Updated in April 29, 2015. Accessed October 22, 2017.

Summary of Trace Minerals

Table 11.12 Summary of the Trace Minerals

Micronutrient Sources Recommended Intakes for adults Major Functions Deficiency diseases and symptoms Groups at risk for deficiency Toxicity UL
Iron Red meat, egg yolks, dark leafy vegetables, dried fruit, iron-fortified foods 8-18 mg/day Assists in energy production, DNA synthesis required for red blood cell function Anemia: fatigue, paleness, faster heart rate Infants and preschool children, adolescents, women, pregnant women, athletes, vegetarians Liver damage, increased risk of diabetes and cancer 45 mg/day
Copper Nuts, seeds, whole grains, seafood 900 mcg/day Assists in energy production, iron metabolism Anemia: fatigue, paleness, faster heart rate Those who consume excessive zinc supplements Vomiting, abdominal pain, diarrhea, liver damage 10 mg/day
Zinc oysters, wheat germ, pumpkin seeds, squash,, beans, sesame seeds, tahini, beef, lamb 8-11 mg/day Assists in energy production, protein, RNA and DNA synthesis; required for hemoglobin synthesis Growth retardation in children, hair loss, diarrhea, skin sores, loss of appetite, weight loss Vegetarians, older adults Depressed immune function 40 mg/day
Selenium Meat, seafood, eggs, nuts 55 mcg/day Essential for thyroid hormone activity Fatigue, muscle pain, weakness, Keshan disease Populations where the soil is low in selenium Nausea, diarrhea, vomiting, fatigue 400  mcg/day
Iodine Iodized salt, seaweed, dairy products 150 mcg/day Making thyroid hormone, metabolism, growth and development Goiter, cretinism, other signs and symptoms include fatigue, depression, weight gain, itchy skin, low heart-rate Populations where the soil is low in iodine, and iodized salt is not used Enlarged thyroid 1110 mcg/day
Chromium 25-35 mcg/day Assists insulin in carbohydrate, lipid and protein metabolism abnormal glucose metabolism Malnourished children None ND
Fluoride Fluoridated water, foods prepared in fluoridated water, seafood 3-4 mg/day Component of mineralized bone, provides structure and microarchitecture, stimulates new bone growth Increased risk of dental caries Populations with non fluoridated water Fluorosis mottled teeth, kidney damage 10 mg/day
Manganese Legumes, nuts, leafy green vegetables 1.8-2.3 mg/day Glucose synthesis, amino-acid catabolism Impaired growth, skeletal abnormalities, abnormal glucose metabolism None Nerve damage 11 mg/day
Molybdenum Milk, grains, legumes 45 mcg/day Cofactor for a number of enzymes Unknown None Arthritis, joint inflammation 2 mg/day

XII

Chapter 12. Nutrition Applications

Introduction

Pū‘ali kalo i ka we ‘ole

Taro, for lack of water, grows misshapen.


North Shore Taro by Richard Doyle / CC BY-NC 3.0

Learning Objectives

By the end of this chapter you will be able to:

  • Describe the purpose and function of nutrition recommendations
  • Describe steps towards building healthy eating patterns
  • Interpret the Nutrition Facts labels found on food items
  • Describe the purpose and use of the MyPlate Planner, the Secretariat of the Pacific Community (SPC) Guidelines and the Pacific Food Guide

Developing a healthful diet can be rewarding, but be mindful that all of the principles presented must be followed to derive maximal health benefits. For example, many Pacific Islanders have been unable to maintain their traditional diets for various environmental, social and demographic reasons. This has resulted in diets high in a variety of high-calorie, nutrient-poor foods. Frequent inadequate and/or excessive nutrient intake can lead to many health issues in a community such as obesity, diabetes, heart disease and cancer. Therefore, it is important to employ moderation and portion control by using all of the principles together to afford you lasting health benefitsPacific Food Summit: Factsheet. World Health Organization. http://www.wpro.who.int/mediacentre/factsheets/fs14042010/en/. Published April 13, 2010. Accessed November 28, 2017..

Understanding Daily Reference Intakes

Dietary Reference Intakes (DRI) are the recommendation levels for specific nutrients and consist of a number of different types of recommendations. This DRI system is used in both the United States and Canada.

Daily Reference Intakes: A Brief Overview

“Dietary Reference Intakes” (DRI) is an umbrella term for four reference values:

The DRIs are not minimum or maximum nutritional requirements and are not intended to fit everybody. They are to be used as guides only for the majority of the healthy populationDeng S, West BJ, Jensen CJ. A Quantitative Comparison of Phytochemical Components in Global Noni Fruits and Their Commercial Products. Food Chemistry. 2010; 122(1), 267–70. http://www.sciencedirect.com/science/article/pii/S0308814610001111. Accessed December 4, 2017..
DRIs are important not only to help the average person determine whether their intake of a particular nutrient is adequate, they are also used by health-care professionals and policy makers to determine nutritional recommendations for special groups of people who may need help reaching nutritional goals. This includes people who are participating in programs such as the Special Supplemental Food Program for Women, Infants, and Children. The DRI is not appropriate for people who are ill or malnourished, even if they were healthy previously.

Determining Dietary Reference Intakes

Each DRI value is derived in a different way. See below for an explanation of how each is determined:

  1. Estimated Average Requirements. The EAR for a nutrient is determined by a committee of nutrition experts who review the scientific literature to determine a value that meets the requirements of 50 percent of people in their target group within a given life stage and for a particular sex. The requirements of half of the group will fall below the EAR and the other half will be above it. It is important to note that, for each nutrient, a specific bodily function is chosen as the criterion on which to base the EAR. For example, the EAR for calcium is set using a criterion of maximizing bone health. Thus, the EAR for calcium is set at a point that will meet the needs, with respect to bone health, of half of the population. EAR values become the scientific foundation upon which RDA values are set.
  2. Recommended Daily Allowances. Once the EAR of a nutrient has been established, the RDA can be mathematically determined. While the EAR is set at a point that meets the needs of half the population, RDA values are set to meet the needs of the vast majority (97 to 98 percent) of the target healthy population. It is important to note that RDAs are not the same thing as individual nutritional requirements. The actual nutrient needs of a given individual will be different than the RDA. However, since we know that 97 to 98 percent of the population’s needs are met by the RDA, we can assume that if a person is consuming the RDA of a given nutrient, they are most likely meeting their nutritional need for that nutrient. The important thing to remember is that the RDA is meant as a recommendation and meeting the RDA means it is very likely that you are meeting your actual requirement for that nutrient.

Understanding the Difference

There is a distinct difference between a requirement and a recommendation. For instance, the DRI for vitamin D is a recommended 600 international units each day. However, in order to find out your true personal requirements for vitamin D, a blood test is necessary. The blood test will provide an accurate reading from which a medical professional can gauge your required daily vitamin D amounts. This may be considerably more or less than the DRI, depending on what your level actually is.

  1. Adequate Intake. AIs are created for nutrients when there is insufficient consistent scientific evidence to set an EAR for the entire population. As with RDAs, AIs can be used as nutrient-intake goals for a given nutrient. For example, there has not been sufficient scientific research into the particular nutritional requirements for infants. Consequently, all of the DRI values for infants are AIs derived from nutrient values in human breast milk. For older babies and children, AI values are derived from human milk coupled with data on adults. The AI is meant for a healthy target group and is not meant to be sufficient for certain at-risk groups, such as premature infants.
  2. Tolerable Upper Intake Levels. The UL was established to help distinguish healthful and harmful nutrient intakes. Developed in part as a response to the growing usage of dietary supplements, ULs indicate the highest level of continuous intake of a particular nutrient that may be taken without causing health problems. When a nutrient does not have any known issue if taken in excessive doses, it is not assigned a UL. However, even when a nutrient does not have a UL it is not necessarily safe to consume in large amounts.

Figure 12.1 DRI Graph

This graph illustrates the risks of nutrient inadequacy and nutrient excess as we move from a low intake of a nutrient to a high intake. Starting on the left side of the graph, you can see that when you have a very low intake of a nutrient, your risk of nutrient deficiency is high. As your nutrient intake increases, the chances that you will be deficient in that nutrient decrease. The point at which 50 percent of the population meets their nutrient need is the EAR, and the point at which 97 to 98 percent of the population meets their needs is the RDA. The UL is the highest level at which you can consume a nutrient without it being too much—as nutrient intake increases beyond the UL, the risk of health problems resulting from that nutrient increases.

Source: Dietary Reference Intakes Tables and Application. The National Academies of Science, Engineering, and Medicine.  Health and Medicine Division. http://nationalacademies.org/HMD/Activities/Nutrition/SummaryDRIs/DRI-Tables.aspx. Accessed November 22, 2017.

The Acceptable Macronutrient Distribution Range (AMDR) is the calculated range of how much energy from carbohydrates, fats, and protein is recommended for a healthy diet adequate of the essential nutrients and is associated with a reduced risk of chronic disease. The ranges listed in Table 12.1 “Acceptable Macronutrient Distribution Ranges (AMDR) For Various Age Groups” allows individuals to personalize their diets taking into consideration that different subgroups in a population often require different requirements. The DRI committee recommends using the midpoint of the AMDRs as an approach to focus on moderationDietary Reference Intakes Tables and Application. The National Academies of Science, Engineering, and Medicine.  Health and Medicine Division. http://nationalacademies.org/HMD/Activities/Nutrition/SummaryDRIs/DRI-Tables.aspx. Accessed November 22, 2017. .

Table 12.1 Acceptable Macronutrient Distribution Ranges (AMDR) For Various Age Groups

Age Group Protein (%) Carbohydrates (%) Fat (%)
Children (1–3) 5–20 45–65 30–40
Children and Adolescents (4–18) 10–30 45–65 25–35
Adults (>19) 10–35 45–65 20–35

Source: Food and Nutrition Board of the Institute of Medicine. Dietary Reference Intakes for Energy, Carbohydrate, Fiber, Fat, Fatty Acids, Cholesterol, Protein, and Amino Acids. http://www.nationalacademies.org/hmd/~/media/Files/Activity%20Files/Nutrition/DRI-Tables/8_Macronutrient%20Summary.pdf?la=en. Published 2002. Accessed November 22, 2017.


Tips for Using the Dietary Reference Intakes to Plan Your Diet

You can use the DRIs to help assess and plan your diet. Keep in mind when evaluating your nutritional intake that the values established have been devised with an ample safety margin and should be used as guidance for optimal intakes. Also, the values are meant to assess and plan average intake over time; that is, you don’t need to meet these recommendations every single day—meeting them on average over several days is sufficient.

Discovering Nutrition Facts

The Labels on Your Food

Understanding the significance of dietary guidelines and how to use DRIs in planning your nutrient intakes can make you better equipped to select the right foods the next time you go to the supermarket.

In the United States, the Nutrition Labeling and Education Act passed in 1990 and came into effect in 1994. In Canada, mandatory labeling came into effect in 2005. As a result, all packaged foods sold in the United States and Canada must have nutrition labels that accurately reflect the contents of the food products. There are several mandated nutrients and some optional ones that manufacturers or packagers include.

In May, 2016 a new Nutrition Facts label for packaged foods was announced. This label reflects new scientific information and will make it easier for consumers to make informed food choices. Some of the changes made to the label include:

Reading the Label

The first part of the Nutrition Facts panel gives you information on the serving size and how many servings are in the container. For example, a label on a box of crackers might tell you that twenty crackers equals one serving and that the whole box contains 10 servings. All other values listed thereafter, from the calories to the dietary fiber, are based on this one serving. On the panel, the serving size is followed by the number of calories and then a list of selected nutrients. You will also see “Percent Daily Value” on the far right-hand side. This helps you determine if the food is a good source of a particular nutrient or not. The Daily Value (DV) represents the recommended amount of a given nutrient based on the RDI of that nutrient in a 2,000-kilocalorie diet. The percentage of Daily Value (percent DV) represents the proportion of the total daily recommended amount that you will get from one serving of the food. For example, in the older food label in Figure 12.2 “Reading the Older Nutrition Label,” the percent DV of calcium for one serving of macaroni-and-cheese is 20 percent, which means that one serving of macaroni and cheese provides 20 percent of the daily recommended calcium intake. Since the DV for calcium is 1,000 milligrams, the food producer determined the percent DV for calcium by taking the calcium content in milligrams in each serving, and dividing it by 1,000 milligrams, and then multiplying it by 100 to get it into percentage format. Whether you consume 2,000 calories per day or not you can still use the percent DV as a target reference.

Generally, a percent DV of 5 is considered low and a percent DV of 20 is considered high. This means, as a general rule, for fat, saturated fat, trans fat, cholesterol, or sodium, look for foods with a low percent DV. Alternatively, when concentrating on essential mineral or vitamin intake, look for a high percent DV. To figure out your fat allowance remaining for the day after consuming one serving of macaroni-and-cheese, look at the percent DV for fat, which is 18 percent, and subtract it from 100 percent. To know this amount in grams of fat, read the footnote of the food label to find that the recommended maximum amount of fat grams to consume per day for a 2,000 kilocalories per day diet is 65 grams. Eighteen percent of sixty-five equals about 12 grams. This means that 53 grams of fat are remaining in your fat allowance. Remember, to have a healthy diet the recommendation is to eat less than this amount of fat grams per day, especially if you want to lose weight.

Table 12.2 DVs Based on a Caloric Intake of 2,000 Calories (For Adults and Children Four or More Years of Age)

Food Component Component DV
Total Fat 65 grams (g)
Saturated Fat 20 g
Cholesterol 300 milligrams (mg)
Sodium 2,400 mg
Potassium 3,500 mg
Total Carbohydrate 300 g
Dietary Fiber 25 g
Protein 50 g
Vitamin A 5,000 International Units (IU)
Vitamin C 60 mg
Calcium 1,000 mg
Iron 18 mg
Vitamin D 400 IU
Vitamin E 30 IU
Vitamin K 80 micrograms µg
Thiamin 1.5 mg
Riboflavin 1.7 mg
Niacin 20 mg
Vitamin B6 2 mg
Folate 400 µg
Vitamin B12 6 µg
Biotin 300 µg
Pantothenic acid 10 mg
Phosphorus 1,000 mg
Iodine 150 µg
Magnesium 400 mg
Zinc 15 mg
Selenium 70 µg
Copper 2 mg
Manganese 2 mg
Chromium 120 µg
Molybdenum 75 µg
Chloride 3,400 mg

Source: FDA, https://www.fda.gov/food/guidanceregulation/guidancedocumentsregulatoryinformation/labelingnutrition/ucm064928.htm

Figure 12.2 Reading the Older Nutrition Label

A sample label for macaroni and cheese.

Source: How to Understand and Use the Nutrition Facts Panel. FDA. http://www.fda.gov/food/labelingnutrition/consumerinformation/ucm078889.htm#dvs. Updated February 15, 2012. Accessed November 22, 2017.

Of course, this is a lot of information to put on a label and some products are too small to accommodate it all. In the case of small packages, such as small containers of yogurt, candy, or fruit bars, permission has been granted to use an abbreviated version of the Nutrition Facts panel. To learn additional details about all of the information contained within the Nutrition Facts panel, see the following website: http://www.fda.gov/Food/ResourcesForYou/Consumers/NFLPM/ucm274593.htm

Original vs. New Format – Infographics to Help Understand the Changes

Figure 12.3 The Original vs. New Nutrition Facts Label

Two Nutrition Fact labels side by side

Figure 12.4 The New Nutrition Facts Label

The new nutrition facts label with explanations

Figure 12.5 Food Serving Sizes

Image demonstrating changes in serving size

Source: https://www.fda.gov/Food/GuidanceRegulation/GuidanceDocumentsRegulatoryInformation/LabelingNutrition/ucm385663.htm

There are other types of information that are required by law to appear somewhere on the consumer packaging. They includeFood Labeling. US Food and Drug Administration. https://www.fda.gov/Food/GuidanceRegulation/GuidanceDocumentsRegulatoryInformation/LabelingNutrition/ucm385663.htm#highlights. Updated November 11, 2017. Accessed November 22, 2017.:

The Nutrition Facts panel provides a wealth of information about the nutritional content of the product. The information also allows shoppers to compare products. Because the serving sizes are included on the label, you can see how much of each nutrient is in each serving to make the comparisons. Knowing how to read the label is important because of the way some foods are presented. For example, a bag of peanuts at the grocery store may seem like a healthy snack to eat on the way to class. But have a look at that label. Does it contain one serving, or multiple servings? Unless you are buying the individual serving packages, chances are the bag you picked up is at least eight servings, if not more.

According to the 2010 health and diet survey released by the FDA, 54 percent of first-time buyers of a product will check the food label and will use this information to evaluate fat, calorie, vitamin, and sodium contentConsumer Research on Labeling, Nutrition, Diet and Health. US Food and Drug Administration. https://www.fda.gov/food/foodscienceresearch/consumerbehaviorresearch/ucm275987.ht. Updated November 17, 2017.. The survey also notes that more Americans are using food labels and are showing an increased awareness of the connection between diet and health. Having reliable food labels is a top priority of the FDA, which has a new initiative to prepare guidelines for the food industry to construct “front of package” labeling that will make it even easier for Americans to choose healthy foods. Stay tuned for the newest on food labeling by visiting the FDA website: http://www.fda.gov/Food/LabelingNutrition/default.htm.

Claims on Labels

In addition to mandating nutrients and ingredients that must appear on food labels, any nutrient content claims must meet certain requirements. For example, a manufacturer cannot claim that a food is fat-free or low-fat if it is not, in reality, fat-free or low-fat. Low-fat indicates that the product has three or fewer grams of fat; low salt indicates there are fewer than 140 milligrams of sodium, and low-cholesterol indicates there are fewer than 20 milligrams of cholesterol and two grams of saturated fatNutrient Content Claims. US Food and Drug Administration. https://www.fda.gov/food/ingredientspackaginglabeling/labelingnutrition/ucm2006880.htm. Updated December 9, 2014. Accessed December 10, 2017.. See Table 12.3 “Common Label Terms Defined” for some examples.

Table 12.3 Common Label Terms Defined

Term Explanation
Lean Fewer than a set amount of grams of fat for that particular cut of meat
High Contains more than 20% of the nutrient’s DV
Good source Contains 10 to 19% of nutrient’s DV
Light/lite Contains ⅓ fewer calories or 50% less fat; if more than half of calories come from fat, then fat content must be reduced by 50% or more
Organic Contains 95% organic ingredients

Source: Food Labeling Guide. US Food and Drug Administration. http://www.fda.gov. Updated February 10, 2012. Accessed November 28, 2017.

Health Claims

Often we hear news of a particular nutrient or food product that contributes to our health or may prevent disease. A health claim is a statement that links a particular food with a reduced risk of developing disease. As such, health claims such as “reduces heart disease,” must be evaluated by the FDA before it may appear on packaging. Prior to the passage of the NLEA products that made such claims were categorized as drugs and not food. All health claims must be substantiated by scientific evidence in order for it to be approved and put on a food label. To avoid having companies making false claims, laws also regulate how health claims are presented on food packaging. In addition to the claim being backed up by scientific evidence, it may never claim to cure or treat the disease. For a detailed list of approved health claims, visit: https://www.fda.gov/food/ingredientspackaginglabeling/labelingnutrition/ucm2006877.htm

Qualified Health Claims

While health claims must be backed up by hard scientific evidence, qualified health claims have supportive evidence, which is not as definitive as with health claims. The evidence may suggest that the food or nutrient is beneficial. Wording for this type of claim may look like this: “Supportive but not conclusive research shows that consumption of EPA and DHA omega-3 fatty acids may reduce the risk of coronary artery disease. One serving of [name of food] provides [X] grams of EPA and DHA omega-3 fatty acids. [See nutrition information for total fat, saturated fat, and cholesterol content.]
FDA Announces Qualified Health Claims for Omega-3 Fatty Acids. US Food and Drug Administration.https://www.fda.gov/food/ingredientspackaginglabeling/labelingnutrition/ucm072936.htm. Published September 8, 2004. Accessed November 28,2017.

Structure/Function Claims

Some companies claim that certain foods and nutrients have benefits for health even though no scientific evidence exists. In these cases, food labels are permitted to claim that you may benefit from the food because it may boost your immune system, for example. There may not be claims of diagnosis, cures, treatment, or disease prevention, and there must be a disclaimer that the FDA has not evaluated the claimClaims That Can Be Made for Conventional Foods and Dietary Supplements. US Food and Drug Administration. https://www.fda.gov/food/ingredientspackaginglabeling/labelingnutrition/ucm111447.htm. Updated September 2003. Accessed November 28,2017..

Allergy Warnings

Food manufacturers are required by the FDA to list on their packages if the product contains any of the eight most common ingredients that cause food allergies. These eight common allergens are as follows: milk, eggs, peanuts, tree nuts, fish, shellfish, soy, and wheat. (More information on these allergens will be discussed in Chapter 9 “Energy Balance and Body Weight”.) The FDA does not require warnings that cross contamination may occur during packaging, however most manufacturers include this advisory as a courtesy. For instance, you may notice a label that states, “This product is manufactured in a factory that also processes peanuts.” If you have food allergies, it is best to avoid products that may have been contaminated with the allergen.

When Enough Is Enough

Estimating Portion Size

Have you ever heard the expression, “Your eyes were bigger than your stomach?” This means that you thought you wanted a lot more food than you could actually eat. Amounts of food can be deceiving to the eye, especially if you have nothing to compare them to. It is very easy to heap a pile of mashed potatoes on your plate, particularly if it is a big plate, and not realize that you have just helped yourself to three portions instead of one.

The food industry makes following the 2015 Dietary Guidelines a challenge. In many restaurants and eating establishments, portion sizes have increased, use of SoFAS has increased, and consequently the typical meal contains more calories than it used to. In addition, our sedentary lives make it difficult to expend enough calories during normal daily activities. In fact, more than one-third of adults are not physically active at all.

Figure 12.6 A Comparison of Serving Sizes

Serving size changes demonstrated by the sizes of two donuts

Source: https://www.nhlbi.nih.gov/health/educational/wecan/portion/documents/PD1.pdf

As food sizes and servings increase it is important to limit the portions of food consumed on a regular basis. Dietitians have come up with some good hints to help people tell how large a portion of food they really have. Some suggest using common items such as a deck of cards while others advocate using your hand as a measuring ruleControlling Portion Sizes. American Cancer Society. http://www.cancer.org/Healthy/EatHealthyGetActive/TakeControlofYourWeight/controlling-portion-sizes. Updated January 12, 2012. Accessed November 30, 2017..

Table 12.4 Determining Food Portions

Food Product Amount Object Comparison Hand Comparison
Pasta, rice ½ c. Tennis ball Cupped hand
Fresh vegetables 1 c. Baseball
Cooked vegetables ½ c. Cupped hand
Meat, poultry, fish 3 oz. Deck of cards Palm of your hand
Milk or other beverages 1 c. Fist
Salad dressing 1 Tbsp. Thumb
Oil 1 tsp. Thumb tip

Everyday Connections

If you wait many hours between meals, there is a good chance you will overeat. To refrain from overeating try consuming small meals at frequent intervals throughout the day as opposed to two or three large meals. Eat until you are satisfied, not until you feel “stuffed.” Eating slowly and savoring your food allows you to both enjoy what you eat and have time to realize that you are full before you get overfull. Your stomach is about the size of your fist but it expands if you eat excessive amounts of food at one sitting. Eating smaller meals will diminish the size of your appetite over time so you will feel satisfied with smaller amounts of food.


Building Healthy Eating Patterns

Helping People Make Healthy Choices

It is not just ourselves, the food industry, and federal government that shape our choices of food and physical activity, but also our sex, genetics, disabilities, income, religion, culture, education, lifestyle, age, and environment. All of these factors must be addressed by organizations and individuals that seek to make changes in dietary habits. The socioeconomic model incorporates all of these factors and is used by health-promoting organizations, such as the USDA and the HHS to determine multiple avenues through which to promote healthy eating patterns, to increase levels of physical activity, and to reduce the risk of chronic disease for all Americans. Lower economic prosperity influences diet specifically by lowering food quality, decreasing food choices, and decreasing access to enough food. The USDA reports that an estimated 12.3 percent or 15.6 million Americans were food insecure, meaning they had insufficient funds to feed all family members at least some time during the year in 2016Food Security in the U.S. United States Department of Agriculture, Economic Research Service. https://www.ers.usda.gov/topics/food-nutrition-assistance/food-security-in-the-us/interactive-charts-and-highlights/. Updated September 6, 2017. Accessed November 22, 2017..

Figure 12.7 Social-Ecological Model

Diagram of the rings of the social ecological model

Recommendations for Optimal Health

For many years, the US government has been encouraging Americans to develop healthful dietary habits. In 1992 the Food Pyramid was introduced, and in 2005 it was updated. This was the symbol of healthy eating patterns for all Americans. However, some felt it was difficult to understand, so in 2011, the pyramid was replaced with MyPlate.

The MyPlate program uses a tailored approach to give people the needed information to help design a healthy diet. The plate is divided according to the amount of food and nutrients you should consume for each meal. Each food group is identified with a different color, showing the food variety that all plates must have. Aside from educating people about the type of food that is best to support optimal health, the new food plan offers the advice that it is okay to enjoy food, just eat a diverse diet and in moderationChoose MyPlate. US Department of Agriculture. http://www.choosemyplate.gov/. Accessed July 22, 2012..

Everyday Connections

Interested in another reliable source for nutrition and health information? The “Got Nutrients?” website highlights the importance of meeting essential nutrient needs in order to maintain optimum health. This website, geared for those interested in nutrition, fitness, and health, posts short daily nutrition and health messages. Each short “Daily Tip” includes links to both a popular article and to a related scientific resource. For more information about “Got Nutrients?” visit, http://www.gotnutrients.net. To receive the “Daily Tips” by email, visit http://www.gotnutrients.net/email_alerts/subscribe.cfm


MyPlate Planner

Estimating portions can be done using the MyPlate Planner. Recall that the MyPlate symbol is divided according to how much of each food group should be included with each meal. Note the MyPlate

Planner Methods of Use:

Building a Healthy Plate: Choose Nutrient-Dense Foods

image

Click on the different food groups listed to view their food gallery:

Planning a healthy diet using the MyPlate approach is not difficult. According to the icon, half of your plate should have fruits and vegetables, one-quarter should have whole grains, and one-quarter should have protein. Dairy products should be low-fat or non-fat. The ideal diet gives you the most nutrients within the fewest calories. This means choosing nutrient-rich foods.

Fill half of your plate with red, orange, and dark green vegetables and fruits, such as kale, bok choy, kalo (taro), tomatoes, sweet potatoes, broccoli, apples, mango, papaya , guavas, blueberries, and strawberries in main and side dishes. Vary your choices to get the benefit of as many different vegetables and fruits as you can. You may choose to drink fruit juice as a replacement for eating fruit. (As long as the juice is 100 percent fruit juice and only half your fruit intake is replaced with juice, this is an acceptable exchange.) For snacks, eat fruits, vegetables, or unsalted nuts.

Fill a quarter of your plate with whole grains such as 100 percent whole-grain cereals, breads, crackers, rice, and pasta. Half of your daily grain intake should be whole grains. Read the ingredients list on food labels carefully to determine if a food is comprised of whole grains.

Select a variety of protein foods to improve nutrient intake and promote health benefits. Each week, be sure to include a nice array of protein sources in your diet, such as nuts, seeds, beans, legumes, poultry, soy, and seafood. The recommended consumption amount for seafood for adults is two 4-ounce servings per week. When choosing meat, select lean cuts. Be conscious to prepare meats using little or no added saturated fat, such as butter.

If you enjoy drinking milk or eating milk products, such as cheese and yogurt, choose low-fat or nonfat products. Low-fat and nonfat products contain the same amount of calcium and other essential nutrients as whole-milk products, but with much less fat and calories. Calcium, an important mineral for your body, is also available in lactose-free and fortified soy beverage and rice beverage products. You can also get calcium in vegetables and other fortified foods and beverages.

Oils are essential for your diet as they contain valuable essential fatty acids, but the type you choose and the amount you consume is important. Be sure the oil is plant-based rather than based on animal fat. You can also get oils from many types of fish, as well as avocados, and unsalted nuts and seeds. Although oils are essential for health they do contain about 120 calories per tablespoon. It is vital to balance oil consumption with total caloric intake. The Nutrition Facts label provides the information to help you make healthful decisions.

In short, substituting vegetables and fruits in place of foods high in added sugars, saturated fats, and sodium is a good way to make a nutrient-poor diet healthy again. Vegetables are full of nutrients and antioxidants that help promote good health and reduce the risk for developing chronic diseases such as stroke, heart disease, high blood pressure, Type 2 diabetes, and certain types of cancer. Starting with these small shifts in your diet as mentioned above will boost your overall health profile.

Discretionary Calories

When following a balanced, healthful diet with many nutrient-dense foods, you may consume enough of your daily nutrients before you reach your daily calorie limit. The remaining calories are discretionary (to be used according to your best judgment). To find out your discretionary calorie allowance, add up all the calories you consumed to achieve the recommended nutrient intakes and then subtract this number from your recommended daily caloric allowance. For example, someone who has a recommended 2,000-calorie per day diet may eat enough nutrient-dense foods to meet requirements after consuming only 1,814 calories. The remaining 186 calories are discretionary. See Table 12.5 “Sample Menu Plan Containing 2,000 Calories”. These calories may be obtained from eating an additional piece of fruit, adding another teaspoon of olive oil on a salad or butter on a piece of bread, adding sugar or honey to cereal, or consuming an alcoholic beverageUS Department of Agriculture. MyPyramid Education Framework. Accessed July 22, 2012..

The amount of discretionary calories increases with physical activity level and decreases with age. For most physically active adults, the discretionary calorie allowance is, at most, 15 percent of the recommended caloric intake. By consuming nutrient-dense foods, you afford yourself a discretionary calorie allowance.

Table 12.5 Sample Menu Plan Containing 2,000 Calories

Meal Calories Total Meal/Snack Calories
Breakfast
1 scrambled egg 92
   with sliced mushrooms and spinach 7
½ whole-wheat muffin 67
1 tsp. margarine-like spread 15
1 orange 65
8 oz. low-sodium tomato juice 53 299
Snack
6 oz. fat-free flavored yogurt 100
   with ½ c. raspberries 32 132
Lunch
1 sandwich on pumpernickel bread 160
   with smoked turkey deli meat, 30
   4 slices tomato 14
   2 lettuce leaves 3
   1 tsp. mustard 3
1 oz. baked potato chips 110
½ c. blueberries, with 1 tsp. sugar 57
8 oz. fat-free milk 90 467
Snack
1 banana 105
7 reduced-fat high-fiber crackers 120 225
Dinner
1 c. Greek salad (tomatoes, cucumbers, feta) 150
   with 5 Greek olives, 45
   with 1.5 tsp. olive oil 60
3 oz. grilled chicken breast 150
½ c. steamed asparagus 20
   with 1 tsp. olive oil, 40
   with 1 tsp. sesame seeds 18
½ c. cooked wild rice 83
   with ½ c. chopped kale 18
1 whole-wheat dinner roll 4
   with 1 tsp. almond butter 33 691
(Total calories from all meals and snacks = 1,814)
Discretionary calorie allowance: 186

(Total calories from all meals and snacks = 1,814)
Discretionary calorie allowance: 186

Healthy Eating Index

To assess whether the American diet is conforming to the Dietary Guidelines, the Center for Nutrition Policy and Promotion (CNPP), a division of the USDA, uses a standardized tool called the Healthy Eating Index (HEI)Healthy Eating Index. US Department of Agriculture. http://www.cnpp.usda.gov/healthyeatingindex.htm. Updated March 14, 2012. Accessed November 22, 2017..

The first HEI was developed in 1995 and revised in 2006. This tool is a simple scoring system of dietary components. The data for scoring diets is taken from national surveys of particular population subgroups, such as children from low-income families or Americans over the age of sixty-five. Diets are broken down into several food categories including milk, whole fruits, dark green and orange vegetables, whole grains, and saturated fat, and then a score is given based on the amount consumed. For example, a score of ten is given if a 2,000-kilocalorie diet includes greater than 2.6 cups of milk per day. If less than 10 percent of total calories in a diet are from saturated fat, a score of eight is given. All of the scores are added up from the different food categories and the diets are given a HEI score. Using this standardized diet-assessment tool at different times, every ten years for instance, the CNPP can determine if the eating habits of certain groups of the American population are getting better or worse. The HEI tool provides the federal government with information to make policy changes to better the diets of American people. For more information on the HEI, visit this website: http://www.cnpp.usda.gov/healthyeatingindex.htm.

The Whole Nutrient Package versus Disease

A healthy diet incorporating seven or more servings of fruits and vegetables has been shown in many scientific studies to reduce cardiovascular disease and overall deaths attributable to cancer. The WHO states that insufficient fruit and vegetable intake is linked to approximately 14 percent of gastrointestinal cancer deaths, about 11 percent of heart attack deaths, and 9 percent of stroke deaths globallyGlobal Strategies on Diet, Physical Activity, and Health. World Health Organization. http://www.who.int/dietphysicalactivity/fruit/en/index.html. Accessed September 30, 2011..

The WHO estimates that, overall, 2.7 million deaths could be avoided annually by increasing fruit and vegetable intake. These preventable deaths place an economic, social, and mental burden on society. This is why, in 2003, the WHO and the Food and Agricultural Organization of the United Nations launched a campaign to promote fruit and vegetable intake worldwide.

Antioxidant Variety in Food Provides Health Benefits

Not only has the several-billion-dollar supplement industry inundated us with FDA-unapproved health claims, but science is continuously advancing and providing us with a multitude of promising health benefits from particular fruits, vegetables, teas, herbs, and spices. For instance, blueberries protect against cardiovascular disease, an apple or pear a day reduces stroke risk by over 52 percent, eating more carrots significantly reduces the risk of bladder cancer, drinking tea reduces cholesterol and helps glucose homeostasis, and cinnamon blocks infection and reduces the risk of some cancers. However, recall that science also tells us that no one nutrient alone is shown to provide these effects.

What micronutrient and phytochemical sources are best at protecting against chronic disease? All of them, together. Just as there is no wonder supplement or drug, there is no superior fruit, vegetable, spice, herb, or tea that protects against all diseases. A review in the July–August 2010 issue of Oxidative Medicine and Cellular Longevity concludes that the plant-food benefits to health are attributed to two main factors—that nutrients and phytochemicals are present at low concentrations in general, and that the complex mixtures of nutrients and phytochemicals provides additive and synergistic effectsBouayed, J. and T. Bohn. Exogenous Antioxidants—Double-Edged Swords in Cellular Redox State: Health Beneficial Effects at Physiologic Doses versus Deleterious Effects at High Doses. Oxidative Medicine and Cellular Longevity. 2010; 3(4), 228–37. http://www.ncbi.nlm.nih.gov/pmc/articles/PMC2952083/?tool=pubmed. Accessed November 22, 2017.. In short, don’t overdo it with supplements and make sure you incorporate a wide variety of nutrients in your diet.

Eating a variety of fruits and vegetables rich in antioxidants and phytochemicals promotes health. Consider these diets:
Mediterranean diet. Fresh fruit and vegetables are abundant in this diet, and the cultural identity of the diet involves multiple herbs and spices. Moreover, olive oil is the main source of fat. Fish and poultry are consumed in low amounts and red meat is consumed in very low amounts. An analysis of twelve studies involving over one million subjects published in the September 2008 issue of the British Medical Journal reports that people who followed the Mediterranean diet had a 9 percent decrease in overall deaths, a 9 percent decrease in cardiovascular death, a 6 percent decrease in cancer deaths, and a 13 percent reduced incidence of Parkinson’s disease and Alzheimer’s diseaseSofi F, et al.Adherence to Mediterranean Diet and Health Status: Meta-Analysis. Br Med J. 2008; 337, a1344. http://www.ncbi.nlm.nih.gov/pmc/articles/PMC2533524/. Accessed November 22, 2017.. The authors of this study concluded that the Mediterranean diet is useful as a primary prevention against some major chronic diseases.

Dietary Approaches to Stop Hypertension (DASH diet). Recall from Chapter 7 “Nutrients Important to Fluid and Electrolyte Balance” that the DASH diet is an eating plan that is low in saturated fat, cholesterol, and total fat. Fruits, vegetables, low-fat dairy foods, whole-grain foods, fish, poultry, and nuts are emphasized while red meats, sweets, and sugar-containing beverages are mostly avoided. Results from a follow-up study published in the December 2009 issue of the Journal of Human Hypertension suggest the low-sodium DASH diet reduces oxidative stress, which may have contributed to the improved blood vessel function observed in salt-sensitive people (between 10 to 20 percent of the population)Al-Solaiman Y, et al. Low-Sodium DASH Reduces Oxidative Stress and Improves Vascular Function in Salt-Sensitive Humans. J Hum Hypertens. 2008; 12, 826–35. http://www.ncbi.nlm.nih.gov/pmc/articles/PMC2783838/?tool=pubmed. Accessed November 22, 2017..

Diets high in fruits and vegetables. An analysis of The Nurses’ Health Study and the Health Professionals’ Follow-up Study reported that for every increased serving of fruits or vegetables per day, especially green leafy vegetables and vitamin C-rich fruits, there was a 4 percent lower risk for heart diseaseJoshipura KJ, et al. The Effect of Fruit and Vegetable Intake on Risk for Coronary Heart Disease. Ann Intern Med. 2001; 134(12), 1106–14. http://www.ncbi.nlm.nih.gov/pubmed/11412050. Accessed November 12, 2017..

Americans Typically Eat Fewer than the Recommended Servings of High Quality Food-Group Foods

An article in the January 2009 issue of the Medscape Journal of Medicine reports that fewer than one in ten Americans consumes the recommended amount of fruits and vegetables, which is between five and thirteen servings per dayKimmons J, et al. Fruit and Vegetable Intake among Adolescents and Adults in the United States: Percentage Meeting Individualized Recommendations. Medscape Journal of Medicine. 2009; 11(1), 26. http://www.ncbi.nlm.nih.gov/pmc/articles/PMC2654704/?tool=pubmed. Accessed November 22, 2017.. According to this study, the largest single contributor to fruit intake was orange juice, and potatoes were the dominant vegetable.

The USDA recommends that you fill half your plate with fruits and vegetables. The number of servings of fruits and vegetables that a person should consume every day is dependent on age, sex, and level of physical activity. For example, a forty-year-old male who exercises for sixty minutes per day should consume 2 cups of fruit and 3½ cups of vegetables, while a fifteen-year-old female who exercises for thirty minutes per day should consume 1½ cups of fruit and 2½ cups of vegetables. (One cup of a fruit or vegetable is equal to one banana, one small apple, twelve baby carrots, one orange, or one large sweet potato.) To find out the amount of fruits and vegetables the Centers for Disease Control and Prevention (CDC) recommends, see Note 8.25 “Interactive 8.4”.

Improving Fruit and Vegetable Intake at Home and in Your Community

Eating more fruits and vegetables can make you think better, too. According to a study published in 2009 in the Journal of Alzheimer’s Disease, no matter your age, eating more fruits and vegetables improves your brain functionPolidori MC, et al. High Fruit and Vegetable Intake Is Positively Correlated with Antioxidant Status and Cognitive Performance in Healthy Subjects. Journal of Alzheimer’s Disease. 2009; 17(4), 921–7. http://www.ncbi.nlm.nih.gov/pubmed/19542607. Accessed November 22, 2017.. Check out Note 8.26 “Interactive 8.5” for thirteen fun ways to increase your fruit and vegetable intake.

The CDC has developed seven strategies to increase American’s intake of fruits and vegetablesThe CDC Guide to Fruit and Vegetable Strategies to Increase Access, Availability, and Consumption. Centers for Disease Control and Prevention. http://www.cdph.ca.gov/SiteCollectionDocuments/StratstoIncreaseFruitVegConsumption.pdf. Updated March 2010. Accessed November 22, 2017..

  1. Support local and state governments in the implementation of a Food Policy Council, which develops policies and programs that increase the availability of affordable fruits and vegetables.
  2. In the food system, increase the availability and affordability of high-quality fruits and vegetables in underserved populations.
  3. Promote farm-to-where-you-are programs, which is the delivery of regionally grown farm produce to community institutions, farmers markets, and individuals.
  4. Encourage worksites, medical centers, universities, and other community and business establishments to serve more fruits and vegetables in cafeterias and onsite eateries.
  5. Support schools in developing healthy food messages to students by incorporating activities such as gardening into curricula.
  6. Encourage the development and support of community and home gardens.
  7. Have emergency food programs, including food banks and food rescue programs, increase their supply of fruits and vegetables.

The seven strategies developed by the CDC are based on the idea that improving access to and availability of fruits and vegetables will lead to an increase in their consumption.

Pacific Based Dietary Guidelines

To reflect the unique food environment and practices of the Pacific, the Secretariat of the Pacific Community (SPC) Public Health division developed Dietary Guidelines for healthy eating to promote and protect the health and future of Pacific Island peoplesFactsheet no. 16 – Healthy Eating. Secretariat of the Pacific Community. https://www.spc.int/hpl/index2.php?option=com_docman&task=doc_view&gid=58&Itemid=51. Published 2002. Accessed December 2, 2017.. With such a diverse food supply, it can be difficult to place some pacific foods into the USDA 5 food group system. For example, ‘ulu, otherwise known as breadfruit, is a fruit but also has many similar properties and functions like whole grains as well due to its high carbohydrate and fiber content.
Therefore, guidelines for healthy eating include a series of leaflets and fact sheets that focus on traditional Pacific foods, food security, and health issues in the Pacific region. Healthy eating guidelines for adults and children are divided into 3 main food groupsFactsheet no. 9 – Feeding babies and young children. Secretariat of the Pacific Community. http://www.spc.int/hpl/index2.php?option=com_docman&task=doc_view&gid=51&Itemid=51. Published 2002. Accessed December 2, 2017..

Table 12.6 The Different Categories from the Pacific

Energy Nutrient-dense foods Protective Foods Body-building Foods
Types of Foods Foods that are both high in calories and high in nutrients Fruits and vegetables Protein-rich foods
Description The recommendation is that these foods should be included in all meals contributing to about half of the food you consume each day. The foods in this group are high in vitamins and minerals. These foods are recommended to be  included in all meals and snacks contributing about one third of the food consumed each day. The foods in this group are high in protein and is recommended to be eaten twice a day in small amounts.

The recommendation is that these foods should be included in all meals contributing to about half of the food you consume each day. The foods in this group are high in vitamins and minerals. These foods are recommended to be included in all meals and snacks contributing about one third of the food consumed each day. The foods in this group are high in protein and is recommended to be eaten twice a day in small amounts. Examples of each of the foods from the Pacific that fit into these categories are shown in the image below.

Figure 12.8 Healthy Eating in the Pacific

The overall key messages to the SPC Dietary Guidelines are to consume a variety of foods each day from the 3 food groups. However, food should be consumed in moderation as too much of any one food can be unhealthy. Foods should be consumed in recommended amounts. In addition, every effort should be made to consuming foods that are locally sourced. See the image below for a depiction of the key messages of the SPC Dietary Guidelines.

Figure 12.9 The Pacific Guide to Healthy Eating

To learn more about the SPC visit http://www.spc.int/about-us/

Bridging MyPlate with the Pacific

Although the diversity and expansiveness of the Pacific region makes this a monumental task, a food guide that reflects the traditional foods of the Pacific in relation to the US Dietary Guidelines, more specifically MyPlate, was needed. The Pacific Food Guide was developed by the Children’s Healthy Living Program (CHL) for Remote and Underserved Minorities of the Pacific Region. CHL is a partnership among the remote Pacific jurisdictions of Alaska, American Samoa, CNMI, RMI, the Republic of Palau, FSM, Guam, and Hawai‘i to study child obesity among Pacific children, ages 2-8 years. The program is sponsored by the United States Department of Agriculture (USDA), Agriculture and Food Research Initiative Grant no 2011-68001-30335. To learn more about CHL visit http://www.chl-pacific.org/. The Pacific Food Guide is freely available at
http://manoa.hawaii.edu/ctahr/pacificfoodguide/index./about-the-guide/

Developed to assist with teaching introductory nutrition at the University of Hawai‘i at Mānoa, the Pacific Food Guide allows readers to explore the traditional foods of the Pacific in relation to both dietary guideline systems (USDA and SPC). Since foods of the Pacific cross over multiple categories of both the MyPlate and SPC Dietary Guidelines foods are organized into 3 neutral categories:

The Pacific Food Guide allows users to identify with the origin of specific Pacific foods and see how these foods fit into both dietary guidelines using a unique set of pins (see image below). By grouping foods into its origin it allows for readers who may not be familiar with either/neither dietary guidelines to use the Guide.

These pins label foods according to the USDA MyPlate guidelines and food groups.

These pins label foods according to the SPC food groups for healthy eating in the Pacific.

Note: There may be a few foods that do not fall in either of the 3 food groups, which the SPC regards as not essential or needed in significant amounts to achieve healthy eating. The recommendations for these miscellaneous food items are to “Eat Less” of, but not necessarily to avoid completely as they may have cultural and traditional value. Such food items will have this pin.

To learn more about how to use the Pacific Food Guide visit http://manoa.hawaii.edu/ctahr/pacificfoodguide/index.php/nutritional-guidelines/how-to-use-the-guide/

Understanding the Bigger Picture of Dietary Guidelines

The first US dietary recommendations were set by the National Academy of Sciences in 1941. The recommended dietary allowances (RDA) were first established out of concern that America’s overseas World War II troops were not consuming enough daily nutrients to maintain good health. The first Food and Nutrition Board was created in 1941, and in the same year set recommendations for the adequate intakes of caloric energy and eight essential nutrients. These were disseminated to officials responsible for food relief for armed forces and civilians supporting the war effort. Since 1980, the dietary guidelines have been reevaluated and updated every five years by the advisory committees of the US Department of Agriculture (USDA) and the US Department of Health and Human Services (HHS). The guidelines are continually revised to keep up with new scientific evidence-based conclusions on the importance of nutritional adequacy and physical activity to overall health.

While dietary recommendations set prior to 1980 focused only on preventing nutrient inadequacy, the current dietary guidelines have the additional goals of promoting health, reducing chronic disease, and decreasing the prevalence of overweight and obesity.

Establishing Human Nutrient Requirements for Worldwide Application

The Department of Nutrition for Health and Development, in collaboration with FAO, continually reviews new research and information from around the world on human nutrient requirements and recommended nutrient intakes. This is a vast and never-ending task, given the large number of essential human nutrients. These nutrients include protein, energy, carbohydrates, fats and lipids, a range of vitamins, and a host of minerals and trace elements.

Many countries rely on WHO and FAO to establish and disseminate this information, which they adopt as part of their national dietary allowances. Others use it as a base for their standards. The establishment of human nutrient requirements is the common foundation for all countries to develop food-based dietary guidelines for their populations.

Establishing requirements means that the public health and clinical significance of intake levels – both deficiency and excess – and associated disease patterns for each nutrient, need to be thoroughly reviewed for all age groups. Every ten to fifteen years, enough research is completed and new evidence accumulated to warrant WHO and FAO undertaking a revision of at least the major nutrient requirements and recommended intakes.
http://www.who.int/nutrition/topics/nutrecomm/en/

Why Are Guidelines Needed?

Instituting nation-wide standard policies provides consistency across organizations and allows health-care workers, nutrition educators, school boards, and eldercare facilities to improve nutrition and subsequently the health of their respective populations. At the same time, the goal of the Dietary Guidelines is to provide informative guidelines that will help any interested person in obtaining optimal nutritional balance and health. The seventh edition of the Dietary Guidelines was released in 2010 and focused mainly on combating the obesity epidemic. USDA secretary Tom Vilsack says, “The bottom line is that most Americans need to trim their waistlines to reduce the risk of developing diet-related chronic disease. Improving our eating habits is not only good for every individual and family, but also for our country.” The 2015 Dietary Guidelines focus on eating patterns, which may be predictive of overall health status and disease risk. The Dietary Guidelines were formulated by the Food and Nutrition Board of the Institute of Medicine (IOM), which has recently changed their name to the National Academy of Medicine (NAM). These guidelines are from the review of thousands of scientific journal articles by a consensus panel consisting of more than two thousand nutrition experts with the overall mission of improving the health of the nationJohnson TD. Online Only: New Dietary Guidelines Call for Less Salt, Fewer Calories, More Exercise. Nation’s Health. March 2011; 41(2), E6. http://thenationshealth.aphapublications.org/content/41/2/E6.full. Accessed November 22, 2017. Key Recommendations: Components of Healthy Living Patterns. Dietary Guidelines 2015-2020. https://health.gov/dietaryguidelines/2015/guidelines/chapter-1/key-recommendations/. Published 2015. Accessed November 22, 2017..

Major Themes of the 2015 Dietary Guidelines

Consume a healthy eating pattern that accounts for all foods and beverages within an appropriate calorie level. A healthy eating pattern includesKey Recommendations: Components of Healthy Living Patterns. Dietary Guidelines 2015-2020. https://health.gov/dietaryguidelines/2015/guidelines/chapter-1/key-recommendations/. Published 2015. Accessed November 22, 2017.:

A healthy eating pattern limits:

Previously, the recommendation for cholesterol was less than 300 mg/day of cholesterol for the general public, and less than 200 mg/day for those with cardiovascular disease risk. The 2015 Dietary Guidelines recommends consuming as little dietary cholesterol as possible rather than quantifying it because someone consuming a diet according to the recommendations would consume around 100-300 mg daily and because dietary cholesterol does not impact blood cholesterol levels as much as previously believedKey Recommendations: Components of Healthy Living Patterns. Dietary Guidelines 2015-2020. https://health.gov/dietaryguidelines/2015/guidelines/chapter-1/key-recommendations/. Published 2015. Accessed November 22, 2017.. The reason for consuming as little cholesterol as possible is because many (but not all) foods that have cholesterol also have saturated fat.

Key Recommendations that are quantitative are provided for several components of the diet that should be limited. These components are of particular public health concern in the United States, and the specified limits can help individuals achieve healthy eating patterns within calorie limits:

If alcohol is consumed, it should be consumed in moderation—up to one drink per day for women and up to two drinks per day for men—and only by adults of legal drinking ageKey Recommendations: Components of Healthy Living Patterns. Dietary Guidelines 2015-2020. https://health.gov/dietaryguidelines/2015/guidelines/chapter-1/key-recommendations/. Published 2015. Accessed November 22, 2017..

High consumptions of certain foods, such as those high in saturated or trans fat, sodium, added sugars, and refined grains may contribute to the increased incidence of chronic disease. Additionally, excessive consumption of these foods replaces the intake of more nutrient-dense foods.

The average person consumes 3,400 milligrams of sodium per day, mostly in the form of table salt. The Dietary Guidelines recommend that Americans reduce their daily sodium intake to less than 2,300 milligrams. If you are over the age of fifty-one, are African American, or have cardiovascular risk factors, such as high blood pressure or diabetes, sodium intake should be reduced even further to 1,500 milligrams. The Dietary Guidelines also recommend that less than 10 percent of calories come from saturated fat, and that fat calories should be obtained by eating foods high in unsaturated fatty acids. The Dietary Guidelines stress the importance of limiting the consumption of foods with refined grains and added sugars, and introduce the new term, SoFAS, which is an acronym for solid fats and added sugars, both of which should be consumed in moderation in a healthy dietNelson, J. and K. Zeratsky. Dietary Guidelines Connect SoFAS and Weight Gain. Mayo Clinic, Nutrition-Wise (blog). http://www.mayoclinic.com/health/dietary-guidelines/MY01417. Published August 25, 2010. Accessed November 22, 2017..

Foods and Nutrients to Increase

The typical American diet lacks sufficient amounts of vegetables, fruits, whole grains, and high-calcium foods, causing concern for deficiencies in certain nutrients important for maintaining health. The Dietary Guidelines provide the following suggestions on food choices to achieve a healthier diet:

Instead of… Replace with…
Sweetened fruit yogurt Plain fat-free yogurt with fresh fruit
Whole milk Low-fat or fat-free milk
Cheese Low-fat or reduced-fat cheese
Bacon or sausage Canadian bacon or lean ham
Sweetened cereals Minimally sweetened cereals with fresh fruit
Apple or berry pie Fresh apple or berries
Deep-fried French fries Oven-baked French fries or sweet potato baked fries
Fried vegetables Steamed or roasted vegetables
Sugary sweetened soft drinks Seltzer mixed with 100 percent fruit juice
Recipes that call for sugar Experiment with reducing amount of sugar and adding spices (cinnamon, nutmeg, etc…)

Source: Food Groups. US Department of Agriculture. http://www.choosemyplate.gov/food-groups/. Updated April 19, 2017. Accessed November 22, 2017.

XIII

Chapter 13. Lifespan Nutrition From Pregnancy to the Toddler Years

Introduction

I maika‘i ke kalo i ka ‘ohā

The goodness of the taro is judged by the young plant it produces


Learning Objectives

By the end of this chapter you will be able to:

  • Describe the physiological basis for nutrient requirements from pregnancy through the toddler years.

The Human Life Cycle

Human bodies change significantly over time, and food is the fuel for those changes. For example, for Native Hawaiians, expecting mothers were encouraged to eat greens like the lu‘au (young taro leaves) and palula (young sweet potato leaves) to encourage a healthy, strong baby.  These beliefs and customs practiced in the early stages of life were done in hopes of building a firm foundation and setting up lifelong healthPukai MK, Handy ESC. The Polynesian Family System in Ka-‘u. Rutland, Vermont: Charles E. Tuttle Company; 1958. .

People of all ages need the same basic nutrients—essential amino acids, carbohydrates, essential fatty acids, and twenty-eight vitamins and minerals—to sustain life and health. However, the amounts of nutrients needed differ. Throughout the human life cycle, the body constantly changes and goes through different periods known as stages. This chapter will focus on pregnancy, infancy and the toddler years. Chapter 14 will focus on childhood through adolescence and Chapter 15 will focus on the stages of adulthood. The major stages of the human life cycle are defined as follows:

Figure 13.1 Ultrasound image of a four-month-old fetus.

We begin with pregnancy, a developmental marathon that lasts about forty weeks. It begins with the first trimester (weeks one to week twelve), extends into the second trimester (weeks thirteen to week twenty-seven), and ends with the third trimester (week twenty-eight to birth). At conception, a sperm cell fertilizes an egg cell, creating a zygote. The zygote rapidly divides into multiple cells to become an embryo and implants itself in the uterine wall, where it develops into a fetus. Some of the major changes that occur include the branching of nerve cells to form primitive neural pathways at eight weeks. At the twenty-week mark, physicians typically perform an ultrasound to acquire information about the fetus and check for abnormalities. By this time, it is possible to know the sex of the baby. At twenty-eight weeks, the unborn baby begins to add body fat in preparation for life outside of the wombPolan EU, Taylor DR. Journey Across the LifeSpan: Human Development and Health Promotion. Philadelphia: F.A. Davis Company; 2003, 81–82. .

Throughout this entire process, a pregnant woman’s nutritional choices affect not only fetal development, but also her own health and the future health of her newborn.

Pregnancy

Woman breastfeeding an infant

It is crucial to consume healthy foods at every phase of life, beginning in the womb. Good nutrition is vital for any pregnancy and not only helps an expectant mother remain healthy, but also impacts the development of the fetus and ensures that the baby thrives in infancy and beyond. During pregnancy, a woman’s needs increase for certain nutrients more than for others. If these nutritional needs are not met, infants could suffer from low birth weight (a birth weight less than 5.5 pounds, which is 2,500 grams), among other developmental problems. Therefore, it is crucial to make careful dietary choices.

The Early Days of Pregnancy

For medical purposes, pregnancy is measured from the first day of a woman’s last menstrual period until childbirth, and typically lasts about forty weeks. Major changes begin to occur in the earliest days, often weeks before a woman even knows that she is pregnant. During this period, adequate nutrition supports cell division, tissue differentiation, and organ development. As each week passes, new milestones are reached. Therefore, women who are trying to conceive should make proper dietary choices to ensure the delivery of a healthy baby. Fathers-to-be should also consider their eating habits. A sedentary lifestyle and a diet low in fresh fruits and vegetables may affect male fertility. Men who drink too much alcohol may also damage the quantity and quality of their spermHealthy Sperm: Improving Your Fertility. Mayo Clinic. 1998–2012 Mayo Foundation for Medical Education and Research. http://www.mayoclinic.com/health/fertility/MC00023. Accessed February 21, 2012..

For both men and women, adopting healthy habits also boosts general well-being and makes it possible to meet the demands of parenting.

Tools for Change

A pregnancy may happen unexpectedly. Therefore, it is important for all women of childbearing age to get 400 micrograms of folate per day prior to pregnancy and 600 micrograms per day during pregnancy. Folate, which is also known as folic acid, is crucial for the production of DNA and RNA and the synthesis of cells. A deficiency can cause megaloblastic anemia, or the development of abnormal red blood cells, in pregnant women. It can also have a profound affect on the unborn baby. Typically, folate intake has the greatest impact during the first eight weeks of pregnancy, when the neural tube closes. The neural tube develops into the fetus’s brain, and adequate folate reduces the risk of brain abnormalities or neural tube defects, which occur in one in a thousand pregnancies in North America each year. This vital nutrient also supports the spinal cord and its protective coverings. Inadequate folic acid can result in birth defects, such as spina bifida, which is the failure of the spinal column to close. The name “folate” is derived from the Latin word foliumfor leaf, and leafy green vegetables such as spinach and kale are excellent sources of it. Folate is also found in legumes, liver, and oranges. Additionally, since 1998, food manufacturers have been required to add folate to cereals and other grain productsFolic Acid. MedlinePlus, a service of the National Institutes of Health. 1995–2012 http://www.nlm.nih.gov/medlineplus/druginfo/natural/1017.html. Updated August 7, 2011. Accessed November 22, 2017..

Weight Gain during Pregnancy

During pregnancy, a mother’s body changes in many ways. One of the most notable and significant changes is weight gain. If a pregnant woman does not gain enough weight, her unborn baby will be at risk. Poor weight gain, especially in the third trimester, could result not only in low birth weight, but also infant mortality and intellectual disabilities. Therefore, it is vital for a pregnant woman to maintain a healthy weight, and her weight prior to pregnancy has a major effect. Infant birth weight is one of the best indicators of a baby’s future health. Pregnant women of normal weight should gain between 25 and 35 pounds in total through the entire pregnancy. The precise amount that a mother should gain usually depends on her beginning body mass index (BMI). See Table 13.1 “Body Mass Index and Pregnancy” for The Institute of Medicine (IOM) recommendations.

Table 13.1 Body Mass Index and PregnancyWeight Gain during Pregnancy: Reexamining the Guidelines. Institute of Medicine. https://www.nap.edu/resource/12584/Report-Brief---Weight-Gain-During-Pregnancy.pdf

Prepregnancy BMI Weight Category Recommended Weight Gain
Below 18.5 Underweight 28–40 lbs.
18.5–24.9 Normal 25–35 lbs.
25.0–29.9 Overweight 15–25 lbs.
Above 30.0 Obese (all classes) 11–20 lbs.

Starting weight below or above the normal range can lead to different complications. Pregnant women with a prepregnancy BMI below twenty are at a higher risk of a preterm delivery and an underweight infant. Pregnant women with a prepregnancy BMI above thirty have an increased risk of the need for a cesarean section during delivery. Therefore, it is optimal to have a BMI in the normal range prior to pregnancy.

Generally, women gain 2 to 5 pounds in the first trimester. After that, it is best not to gain more than one pound per week. Some of the new weight is due to the growth of the fetus, while some is due to changes in the mother’s body that support the pregnancy. Weight gain often breaks down in the following manner as shown in Figure 13.2 6 to 8 pounds of fetus, 1 to 2 pounds for the placenta (which supplies nutrients to the fetus and removes waste products), 2 to 3 pounds for the amniotic sac (which contains fluids that surround and cushion the fetus), 1 to 2 pounds in the breasts, 1 to 2 pounds in the uterus, 3 to 4 pounds of maternal blood, 3 to 4 pounds maternal fluids, and 8 to 10 pounds of extra maternal fat stores that will be needed for breastfeeding and delivery. Women who are pregnant with more than one fetus are advised to gain even more weight to ensure the health of their unborn babies.

Figure 13.2 Areas of weight gain for pregnant women

Figure of woman with labels of areas of weight gain

The weight an expectant mother gains during pregnancy is almost all lean tissue, including the placenta and fetus. Weight gain is not the only major change. A pregnant woman also will find that her breasts enlarge and that she has a tendency to retain waterWeight Gain during Pregnancy. Utah Department of Health, Baby Your Baby. http://www.babyyourbaby.org/pregnancy/during. Published 2012. Accessed November 22, 2017..

The pace of weight gain is also important. If a woman puts on weight too slowly, her physician may recommend nutritional counseling. If she gains weight too quickly, especially in the third trimester, it may be the result of edema, or swelling due to excess fluid accumulation. Rapid weight gain may also result from increased calorie consumption or a lack of exercise.

Weight Loss after Pregnancy

During labor, new mothers lose some of the weight they gained during pregnancy with the delivery of their child. In the following weeks, they continue to shed weight as they lose accumulated fluids and their blood volume returns to normal. Some studies have hypothesized that breastfeeding also helps a new mother lose some of the extra weight, although research is ongoingStuebe AM,  Rich-Edwards JW. The Reset Hypothesis: Lactation and Maternal Metabolism. , Am J Perinatol. 2009; 26(1), 81–88..

New mothers who gain a healthy amount of weight and participate in regular physical activity during their pregnancies also have an easier time shedding weight post-pregnancy. However, women who gain more weight than needed for a pregnancy typically retain that excess weight as body fat. If those few pounds increase a new mother’s BMI by a unit or more, that could lead to complications such as hypertension or Type 2 diabetes in future pregnancies or later in life.

Nutritional Requirements

As a mother’s body changes, so do her nutritional needs. Pregnant women must consume more calories and nutrients in the second and third trimesters than other adult women. However, the average recommended daily caloric intake can vary depending on activity level and the mother’s normal weight. Also, pregnant women should choose a high-quality, diverse diet, consume fresh foods, and prepare nutrient-rich meals. Steaming is the best way to cook vegetables. Vitamins are destroyed by overcooking, whereas uncooked vegetables and fruits have the highest vitamin content. It is also standard for pregnant women to take prenatal supplements to ensure adequate intake of the needed micronutrients.

Energy and Macronutrients

During the first trimester, a pregnant woman has the same energy requirements as normal and should consume the same number of calories as usual. However, as the pregnancy progresses, a woman must increase her caloric intake. According to the IOM, she should consume an additional 340 calories per day during the second trimester, and an additional 450 calories per day during the third trimester. This is partly due to an increase in metabolism, which rises during pregnancy and contributes to increased energy needs. A woman can easily meet these increased needs by consuming more nutrient-dense foods.

The recommended daily allowance, or RDA, of carbohydrates during pregnancy is about 175 to 265 grams per day to fuel fetal brain development. The best food sources for pregnant women include whole-grain breads and cereals, brown rice, root vegetables, legumes, and fruits. These and other unrefined carbohydrates provide nutrients, phytochemicals, antioxidants, and the extra 3 mg/day of fiber that is recommended during pregnancy. These foods also help to build the placenta and supply energy for the growth of the unborn baby.

During pregnancy, extra protein is needed for the synthesis of new maternal and fetal tissues. Protein builds muscle and other tissues, enzymes, antibodies, and hormones in both the mother and the unborn baby. Additional protein also supports increased blood volume and the production of amniotic fluid. The RDA of protein during pregnancy is 71 grams per day, which is 25 grams above the normal recommendation. Protein should be derived from healthy sources, such as lean red meat, white-meat poultry, legumes, nuts, seeds, eggs, and fish. Low-fat milk and other dairy products also provide protein, along with calcium and other nutrients.

There are no specific recommendations for fats in pregnancy, apart from following normal dietary guidelines. Although this is the case, it is recommended to increase the amount of essential fatty acids linoleic acid and ∝-linolenic acid because they are incorporated into the placenta and fetal tissues.  Fats should make up 25 to 35 percent of daily calories, and those calories should come from healthy fats, such as avocados. It is not recommended for pregnant women to be on a very low-fat diet, since it would be hard to meet the needs of essential fatty acids and fat-soluble vitamins. Fatty acids are important during pregnancy because they support the baby’s brain and eye development.

Fluids

Fluid intake must also be monitored. According to the IOM, pregnant women should drink 2.3 liters (about 10 cups) of liquids per day to provide enough fluid for blood production. It is also important to drink liquids during physical activity or when it is hot and humid outside, to replace fluids lost to perspiration. The combination of a high-fiber diet and lots of liquids also helps to eliminate waste.
Pregnancy: Body Changes and Discomforts. US Department of Health and Human Services, Office on Women’s Health. http://www.womenshealth.gov/pregnancy/you-are-pregnant/body-changes -discomforts.cfm. Updated September 27, 2010. Accessed December 2, 2017.

Vitamins and Minerals

The daily requirements for nonpregnant women change with the onset of a pregnancy. Taking a daily prenatal supplement or multivitamin helps to meet many nutritional needs. However, most of these requirements should be fulfilled with a healthy diet. The following table compares the normal levels of required vitamins and minerals to the levels needed during pregnancy. For pregnant women, the RDA of nearly all vitamins and minerals increases.

Table 13.2 Recommended Nutrient Intakes during Pregnancy

Nutrient Nonpregnant Women Pregnant Women
Vitamin A (mcg) 700.0 770.0
Vitamin B6 (mg) 1.5 1.9
Vitamin B12 (mcg) 2.4 2.6
Vitamin C (mg) 75.0 85.0
Vitamin D (mcg) 5.0 5.0
Vitamin E (mg) 15.0 15.0
Calcium (mg) 1,000.0 1,000.0
Folate (mcg) 400.0 600
Iron (mg) 18.0 27.0
Magnesium (mg) 320.0 360.0
Niacin (B3) (mg) 14.0 18.0
Phosphorus 700.0 700.0
Riboflavin (B2) (mg) 1.1 1.4
Thiamine (B1) (mg) 1.1 1.4
Zinc (mg) 8.0 11.0

Source: Nutrition during Pregnancy: Part I: Weight Gain, Part II: Nutrient Supplements. Institute of Medicine. http://iom.edu/Reports/1990/Nutrition-During-Pregnancy-Part-I-Weight-Gain-Part-II-Nutrient-Supplements.aspx. Published January 1, 1990. Accessed November 22, 2017.

The micronutrients involved with building the skeleton—vitamin D, calcium, phosphorus, and magnesium—are crucial during pregnancy to support fetal bone development. Although the levels are the same as those for nonpregnant women, many women do not typically consume adequate amounts and should make an extra effort to meet those needs.

There is an increased need for all B vitamins during pregnancy. Adequate vitamin B6 supports the metabolism of amino acids, while more vitamin B12 is needed for the synthesis of red blood cells and DNA. Additional zinc is crucial for cell development and protein synthesis. The need for vitamin A also increases, and extra iron intake is important because of the increase in blood supply during pregnancy and to support the fetus and placenta. Iron is the one micronutrient that is almost impossible to obtain in adequate amounts from food sources only. Therefore, even if a pregnant woman consumes a healthy diet, there still is a need to take an iron supplement, in the form of ferrous salts. Also remember that folate needs increase during pregnancy to 600 micrograms per day to prevent neural tube defects. This micronutrient is crucial for fetal development because it helps produce the extra blood a woman’s body requires during pregnancy.

For most other minerals, recommended intakes are similar to those for nonpregnant women, although it is crucial for pregnant women to make sure to meet the RDAs to reduce the risk of birth defects. In addition, pregnant mothers should avoid exceeding any recommendations. Taking megadose supplements can lead to excessive amounts of certain micronutrients, such as vitamin A and zinc, which may produce toxic effects that can also result in birth defects.

Guide to Eating during Pregnancy

While pregnant women have an increased need for energy, vitamins, and minerals, energy increases are proportionally less than other macronutrient and micronutrient increases. So, nutrient-dense foods, which are higher in proportion of macronutrients and micronutrients relative to calories, are essential to a healthy diet. Examples of nutrient-dense foods include fruits, vegetables, whole grains, peas, beans, reduced-fat dairy, and lean meats. Pregnant women should be able to meet almost all of their increased needs via a healthy diet. However, expectant mothers should take a prenatal supplement to ensure an adequate intake of iron and folate. Here are some additional dietary guidelines for pregnant womenStaying Healthy and Safe. US Department of Health and Human Services, Office on Women’s Health. Last updated March 5, 2009. https://www.womenshealth.gov/pregnancy/youre-pregnant-now-what/staying-healthy-and-safe. Updated February 1, 2017. Accessed November 30, 2017.:

Foods to Avoid

A number of substances can harm a growing fetus. Therefore, it is vital for women to avoid them throughout a pregnancy. Some are so detrimental that a woman should avoid them even if she suspects that she might be pregnant. For example, consumption of alcoholic beverages results in a range of abnormalities that fall under the umbrella of fetal alcohol spectrum disorders. They include learning and attention deficits, heart defects, and abnormal facial features (See Figure 13.3). Alcohol enters the unborn baby via the umbilical cord and can slow fetal growth, damage the brain, or even result in miscarriage. The effects of alcohol are most severe in the first trimester, when the organs are developing. As a result, there is no safe amount of alcohol that a pregnant woman can consume. Although pregnant women in the past may have participated in behavior that was not known to be risky at the time, such as drinking alcohol or smoking cigarettes, today we know that it is best to avoid those substances completely to protect the health of the unborn baby.

Figure 13.3 Craniofacial features associated with fetal alcohol syndrome

Pregnant women should also limit caffeine intake, which is found not only in coffee, but also tea, colas, cocoa, chocolate, and some over-the-counter painkillers. Some studies suggest that very high amounts of caffeine have been linked to babies born with low birth weights. The American Journal of Obstetrics and Gynecology released a report, which found that women who consume 200 milligrams or more of caffeine a day (which is the amount in 10 ounces of coffee or 25 ounces of tea) increase the risk of miscarriageWeng X, Odouli R, Li DK. Maternal caffeine consumption during pregnancy and the risk of miscarriage: a prospective cohort study. Am J Obstet Gynecol 2008;198, 279.e1-279.e8..

Consuming large quantities of caffeine affects the pregnant mother as well, leading to irritability, anxiety, and insomnia. Most experts agree that small amounts of caffeine each day are safe (about one 8-ounce cup of coffee a day or less)American Medical Association. Complete Guide to Prevention and Wellness. Hoboken, NJ: John Wiley & Sons, Inc.; 2008, 495.. However, that amount should not be exceeded.

Foodborne Illness

For both mother and child, foodborne illness can cause major health problems. For example, the foodborne illness caused by the bacteria Listeria monocytogenes can cause spontaneous abortion and fetal or newborn meningitis. According to the CDC, pregnant women are twenty times more likely to become infected with this disease, which is known as listeriosis, than nonpregnant, healthy adults. Symptoms include headaches, muscle aches, nausea, vomiting, and fever. If the infection spreads to the nervous system, it can result in a stiff neck, convulsions, or a feeling of disorientationListeria and Pregnancy. American Pregnancy Association. http://www.americanpregnancy.org/pregnancycomplications/listeria.html. Updated March 10, 2017. Accessed November 29, 2017..

Foods more likely to contain the bacteria that should be avoided are unpasteurized dairy products, especially soft cheeses, and also smoked seafood, hot dogs, paté, cold cuts, and uncooked meats. To avoid consuming contaminated foods, women who are pregnant or breastfeeding should take the following measures:

It is always important to avoid consuming contaminated food to prevent food poisoning. This is especially true during pregnancy. Heavy metal contaminants, particularly mercury, lead, and cadmium, pose risks to pregnant mothers. As a result, vegetables should be washed thoroughly or have their skins removed to avoid heavy metals.

Pregnant women can eat fish, ideally 8 to 12 ounces of different types each week. Expectant mothers are able to eat cooked shellfish such as shrimp, farm-raised fish such as salmon, and a maximum of 6 ounces of albacore, or white, tuna. However, they should avoid fish with high methylmercury levels, such as shark, swordfish, tilefish, and king mackerel. Pregnant women should also avoid consuming raw shellfish to avoid foodborne illness. The Environmental Defense Fund eco-rates fish to provide guidelines to consumers about the safest and most environmentally friendly choices. You can find ratings for fish and seafood at http://www.edf.org.

Physical Activity during Pregnancy

For most pregnant women, physical activity is a must and is recommended in the 2015 Dietary Guidelines for Americans. Regular exercise of moderate intensity, about thirty minutes per day most days of the week, keeps the heart and lungs healthy. It also helps to improve sleep and boosts mood and energy levels. In addition, women who exercise during pregnancy report fewer discomforts and may have an easier time losing excess weight after childbirth. Brisk walking, swimming, or an aerobics class geared toward expectant mothers are all great ways to get exercise during a pregnancy. Healthy women who already participate in vigorous activities, such as running, can continue doing so during pregnancy provided they discuss an exercise plan with their physicians.

However, pregnant women should avoid pastimes that could cause injury, such as soccer, football, and other contact sports, or activities that could lead to falls, such as horseback riding and downhill skiing. It may be best for pregnant women not to participate in certain sports, such as tennis, that require you to jump or change direction quickly. Scuba diving should also be avoided because it might result in the fetus developing decompression sickness. This potentially fatal condition results from a rapid decrease in pressure when a diver ascends too quicklyShould I Exercise During My Pregnancy?. National Institutes of Health, and Friends of the National Library of Medicine. NIH Medline Plus. 2008; 3(1), 26. http://www.nlm.nih.gov/medlineplus/magazine/issues/winter08/articles/winter08pg26.html. Accessed December 2, 2017..

Food Cravings and Aversions

Food aversions and cravings do not have a major impact unless food choices are extremely limited. The most common food aversions are milk, meats, pork, and liver. For most women, it is not harmful to indulge in the occasional craving, such as the desire for pickles and ice cream. However, a medical disorder known as pica is willingly consuming foods with little or no nutritive value, such as dirt, clay, and laundry starch. In some places this is a culturally accepted practice. However, it can be harmful if these substances take the place of nutritious foods or contain toxins.

Complications during Pregnancy

Expectant mothers may face different complications during the course of their pregnancy. They include certain medical conditions that could greatly impact a pregnancy if left untreated, such as gestational hypertension and gestational diabetes, which have diet and nutrition implications.
Gestational hypertension is a condition of high blood pressure during the second half of pregnancy.

First-time mothers are at a greater risk, along with women who have mothers or sisters who had gestational hypertension, women carrying multiple fetuses, women with a prior history of high blood pressure or kidney disease, and women who are overweight or obese when they become pregnant. Hypertension can prevent the placenta from getting enough blood, which would result in the baby getting less oxygen and nutrients. This can result in low birth weight, although most women with gestational hypertension can still deliver a healthy baby if the condition is detected and treated early.

Some risk factors can be controlled, such as diet, while others cannot, such as family history. If left untreated, gestational hypertension can lead to a serious complication called preeclampsia, which is sometimes referred to as toxemia. This disorder is marked by elevated blood pressure and protein in the urine and is associated with swelling. To prevent preeclampsia, the WHO recommends increasing calcium intake for women consuming diets low in that micronutrient, administering a low dosage of aspirin (75 milligrams), and increasing prenatal checkupsWHO Recommendations for Prevention and Treatment of Pre-eclampsia and Eclampsia.World Health Organization. http://whqlibdoc.who.int/publications/2011/9789241548335_eng.pdf. Published 2011. Accessed June 8, 2012..

About 4 percent of pregnant women suffer from a condition known as gestational diabetes, which is abnormal glucose tolerance during pregnancy. The body becomes resistant to the hormone insulin, which enables cells to transport glucose from the blood. Gestational diabetes is usually diagnosed around twenty-four to twenty-six weeks, although it is possible for the condition to develop later into a pregnancy. Signs and symptoms of this disease include extreme hunger, thirst, or fatigue. If blood sugar levels are not properly monitored and treated, the baby might gain too much weight and require a cesarean delivery. Diet and regular physical activity can help to manage this condition. Most patients who suffer from gestational diabetes also require daily insulin injections to boost the absorption of glucose from the bloodstream and promote the storage of glucose in the form of glycogen in liver and muscle cells. Gestational diabetes usually resolves after childbirth, although some women who suffer from this condition develop Type 2 diabetes later in life, particularly if they are overweight.

Infancy

Diet and nutrition have a major impact on a child’s development from infancy into the adolescent years. A healthy diet not only affects growth, but also immunity, intellectual capabilities, and emotional well-being. One of the most important jobs of parenting is making sure that children receive an adequate amount of needed nutrients to provide a strong foundation for the rest of their lives.

The choice to breastfeed is one that all new mothers face. Support from family members, friends, employers, and others can greatly help with both the decision-making process during pregnancy and the practice of breastfeeding after the baby’s birth. In the United States, about 75 percent of babies start out being breastfed. Yet by the age of six months, when solid foods should begin to be introduced into a child’s diet along with breast milk, only 15 percent of infants in the United States were still breastfed exclusively, according to the Centers for Disease Control and Prevention (CDC).Breastfeeding: Promotion and Support. Centers for Disease Control and Prevention. http://www.cdc.gov/breastfeeding/promotion/index.htm. Updated August 4, 2017. Accessed November 29, 2017.

However, the approval and assistance of family members, friends, employers, health-care providers, and policymakers can make an enormous difference and provide the needed promotion and support for mothers who wish to breastfeed their children. Education about breastfeeding typically begins with health-care providers. During prenatal care and often soon after a woman has given birth, doctors, nurses, and other clinicians can explain the benefits of breastfeeding and describe the proper technique. Nearly all births in the United States and Canada occur in hospital settings, and hospital practices in labor, delivery, postpartum care, and discharge planning can inform and support women who want to breastfeed. Once a new mother has left the hospital for home, she needs access to a trained individual who can provide consistent information. International Board Certified Lactation Consultants (IBCLCs) are health-care professionals (often a registered nurse or registered dietitian) certified in breastfeeding management that work with new mothers to solve problems and educate families about the benefits of this practice. Research shows that breastfeeding rates are higher among women who had infants in hospitals that make IBCLCs available to new mothers, rather than those who gave birth in institutions without these professionals on staff.Executive Summary: The Surgeon General’s Call to Action to Support Breastfeeding. US Department of Health and Human Services, Office of the Surgeon General. http://www.surgeongeneral.gov/topics/breastfeeding/executivesummary.pdf. Updated August 12, 2014. Accessed December 2, 2017.

In addition, spouses, partners, and other family members can play critical roles in helping a pregnant woman make the decision to breastfeed and assisting with feeding after the baby is born. Employment can also factor into a woman’s decision to breastfeed or her ability to maintain the practice. Employed mothers have been less likely to initiate breastfeeding and tend to breastfeed for a shorter period of time than new mothers who are not employed or who have lengthy maternity leaves. In 2010 in the United States, the passage of the Affordable Care Act (ACA) called for employers to provide accommodations within the workplace for new mothers to pump breast milk. This law requires a private and clean space within the workplace, other than a restroom, along with adequate break time for a woman to express milk.Executive Summary: The Surgeon General’s Call to Action to Support Breastfeeding. US Department of Health and Human Services, Office of the Surgeon General. http://www.surgeongeneral.gov/topics/breastfeeding/executivesummary.pdf. Updated August 12, 2014. Accessed DEcember 8, 2017.

Everyday Connection

In the Pacific, the state of Hawai‘i and and the territory of Guam are mandated to provide several accommodations within the workplace for new mothers.  All employers are to required to allow breastfeeding mothers adequate break time to pump or nurse in location other than a bathroom. To learn more about Hawai‘i’s laws visit http://health.hawaii.gov/wic/files/2013/04/WorkplaceBreastfeeding_02_2014.pdf and for Guam’s laws visit  http://www.guamcourts.org/CompilerofLaws/GCA/10gca/10gc092A.pdf.

Members of a community can also promote and support breastfeeding. New mothers can join peer counseling groups or turn to other women within their community who have previous experience with breastfeeding. In addition, community-based programs can provide education and support. The US Department of Agriculture’s Women, Infants, and Children program provides information on breastfeeding for low-income families. Launched in 2004, the Loving Support program combines peer counseling with breastfeeding promotion efforts to increase duration rates across the United States. La Leche League is an international program that provides mother-to-mother support, encouragement, and education about breastfeeding for women around the world. For more information on La Leche League, visit http://www.llli.org.

Although breastfeeding should be recommended and encouraged for almost all new mothers, it is important to remember that the decision to breastfeed is a personal choice and women should not be made to feel guilty if they cannot, or choose not, to breastfeed their infants. In some rare cases, a woman is unable to breastfeed or it is not in the baby’s best interest.

Nutritional choices that parents make, such as the decision to breastfeed or bottle-feed, not only affect early childhood development, but also a child’s health and wellness later in life. Therefore, it is imperative to promote and support the best practices for the well-being of infants and mothers alike.

Infancy (Birth to Age One)

Image by Marie Kainoa Fialkowski Revilla / CC BY 4.0

A number of major physiological changes occur during infancy. The trunk of the body grows faster than the arms and legs, while the head becomes less prominent in comparison to the limbs. Organs and organ systems grow at a rapid rate. Also during this period, countless new synapses form to link brain neurons. Two soft spots on the baby’s skull, known as fontanels, allow the skull to accommodate rapid brain growth. The posterior fontanel closes first, by the age of eight weeks. The anterior fontanel closes about a year later, at eighteen months on average. Developmental milestones include sitting up without support, learning to walk, teething, and vocalizing among many, many others. All of these changes require adequate nutrition to ensure development at the appropriate rate.McMillan B. Illustrated Atlas of the Human Body. Sydney, Australia: Weldon Owen. 2008, 248.

Healthy infants grow steadily, but not always at an even pace. For example, during the first year of life, height increases by 50 percent, while weight triples. Physicians and other health professionals can use growth charts to track a baby’s development process. Because infants cannot stand, length is used instead of height to determine the rate of a child’s growth. Other important developmental measurements include head circumference and weight. All of these must be tracked and compared against standard measurements for an infant’s age.

For infants and toddlers from birth to 24 months of age, the WHO growth charts are used to monitor growth. These standards represent optimal growth for children at this age and allow for tracking growth trends over time through percentile rankings. Growth charts may provide warnings that a child has a medical problem or is malnourished. Insufficient weight or height gain during infancy may indicate a condition known as failure-to-thrive (FTT), which is characterized by poor growth. FTT can happen at any age, but in infancy, it typically occurs after six months. Some causes include poverty, lack of enough food, feeding inappropriate foods, and excessive intake of fruit juice.

Figure 13.4 WHO Growth Chart For Boys From Birth To 24 Months

Nutritional Requirements

Requirements for macronutrients and micronutrients on a per-kilogram basis are higher during infancy than at any other stage in the human life cycle. These needs are affected by the rapid cell division that occurs during growth, which requires energy and protein, along with the nutrients that are involved in DNA synthesis. During this period, children are entirely dependent on their parents or other caregivers to meet these needs. For almost all infants six months or younger, breast milk is the best source to fulfill nutritional requirements. An infant may require feedings eight to twelve times a day or more in the beginning. After six months, infants can gradually begin to consume solid foods to help meet nutrient needs.

Energy and Macronutrients

Energy needs relative to size are much greater in an infant than an adult. A baby’s resting metabolic rate is two times that of an adult. The RDA to meet energy needs changes as an infant matures and puts on more weight. The IOM uses a set of equations to calculate the total energy expenditure and resulting energy needs. For example, the equation for the first three months of life is (89 x weight [kg] −100) + 175 kcal.

Based on these equations, the estimated energy requirement for infants from zero to six months of age is 472 to 645 kilocalories per day for boys and 438 to 593 kilocalories per day for girls. For infants ages six to twelve months, the estimated requirement is 645 to 844 kilocalories per day for boys and 593 to 768 kilocalories per day for girls. From the age one to age two, the estimated requirement rises to 844–1,050 kilocalories per day for boys and 768–997 kilocalories per day for girls.Dietary Reference Intakes for Energy, Carbohydrate, Fiber, Fat, Fatty Acids, Cholesterol, Protein, and Amino Acids.Food and Nutrition Board, Institute of Medicine. Washington, D.C.: The National Academies Press. 2005, 169–70. How often an infant wants to eat will also change over time due to growth spurts, which typically occur at about two weeks and six weeks of age, and again at about three months and six months of age.

The dietary recommendations for infants are based on the nutritional content of human breast milk. Carbohydrates make up about 45 to 65 percent of the caloric content in breast milk, which amounts to a RDA of about 130 grams. Almost all of the carbohydrate in human milk is lactose, which infants digest and tolerate well. In fact, lactose intolerance is practically nonexistent in infants. Protein makes up about 5 to 20 percent of the caloric content of breast milk, which amounts to 13 grams per day. Infants have a high need for protein to support growth and development, though excess protein (which is only a concern with bottle-feeding) can cause dehydration, diarrhea, fever, and acidosis in premature infants. About 30 to 40 percent of the caloric content in breast milk is made up of fat. A high-fat diet is necessary to encourage the development of neural pathways in the brain and other parts of the body. However, saturated fats and trans fatty acids inhibit this growth. Infants who are over the age of six months, which means they are no longer exclusively breastfed, should not consume foods that are high in these types of fats.

Micronutrients

Almost all of the nutrients that infants require can be met if they consume an adequate amount of breast milk. There are a few exceptions, though. Human milk is low in vitamin D, which is needed for calcium absorption and building bone, among other things. Therefore, breastfed children often need to take a vitamin D supplement in the form of drops. Infants at the highest risk for vitamin D deficiency are those with darker skin and no exposure to sunlight. Breast milk is also low in vitamin K, which is required for blood clotting, and deficits could lead to bleeding or hemorrhagic disease. Babies are born with limited vitamin K, so supplementation may be needed initially and some states require a vitamin K injection after birth. Also, breast milk is not high in iron, but the iron in breast milk is well absorbed by infants. After four to six months, however, an infant needs an additional source of iron other than breast milk.

Fluids

Infants have a high need for fluids, 1.5 milliliters per kilocalorie consumed compared to 1.0 milliliters per kilocalorie consumed for adults. This is because children have larger body surface area per unit of body weight and a reduced capacity for perspiration. Therefore, they are at greater risk of dehydration. However, parents or other caregivers can meet an infant’s fluid needs with breast milk or formula. As solids are introduced, parents must make sure that young children continue to drink fluids throughout the day.

Breastfeeding

The alveoli cells produce milk. To secrete it, they contract and push milk into the ductules and the milk sinus, which collects the milk. When a nursing infant’s gums press on the areola and nipple, the sinuses squeeze the milk into the baby’s mouth. The nipple tissue becomes firmer with stimulation, which makes it more flexible and easier for the baby to grasp in the mouth. After the birth of the baby, nutritional needs must be met to ensure that an infant not only survives, but thrives from infancy into childhood. Breastfeeding provides the fuel a newborn needs for rapid growth and development. As a result, the WHO recommends that breastfeeding be done exclusively for the first six months of an infant’s life. Exclusive breastfeeding is one of the best ways a mother can support the growth and protect the health of her infant child. Breast milk contains all of the nutrients that a newborn requires and gives a child the best start to a healthy life. Many women want to breastfeed their babies. Unfortunately, a mother’s intention alone may not be enough to make this practice possible. Around the world, less than 40 percent of infants under the age of six months are breastfed exclusively.10 Facts on Breastfeeding. World Health Organization. http://www.who.int/features/factfiles/breastfeeding/en/. Updated August 2017. Accessed December 2, 2017.  

New mothers must also pay careful consideration to their own nutritional requirements to help their bodies recover in the wake of the pregnancy. This is particularly true for women who breastfeed their babies, which calls for an increased need in certain nutrients.

Lactation

Lactation is the process that makes breastfeeding possible, and is the synthesis and secretion of breast milk. Early in a woman’s pregnancy, her mammary glands begin to prepare for milk production. Hormones play a major role in this, particularly during the second and third trimesters. At that point, levels of the hormone prolactin increase to stimulate the growth of the milk duct system, which initiates and maintains milk production. Levels of the hormone oxytocin also rise to promote the release of breast milk when the infant suckles, which is known as the milk ejection reflex. However, levels of the hormone progesterone need to decrease for successful milk production, because progesterone inhibits milk secretion. Shortly after birth, the expulsion of the placenta triggers progesterone levels to fall, which activates lactation.King J. Contraception and Lactation: Physiology of Lactation. Journal of Midwifery and Women’s Health. 2007; 52(6), 614–20.

New mothers need to adjust their caloric and fluid intake to make breastfeeding possible. The RDA is 330 additional calories during the first six months of lactation and 400 additional calories during the second six months of lactation. The energy needed to support breastfeeding comes from both increased intake and from stored fat. For example, during the first six months after her baby is born, the daily caloric cost for a lactating mother is 500 calories, with 330 calories derived from increased intake and 170 calories derived from maternal fat stores. This helps explain why breastfeeding may promote weight loss in new mothers. Lactating women should also drink 3.1 liters of liquids per day (about 13 cups) to maintain milk production, according to the IOM. As is the case during pregnancy, the RDA of nearly all vitamins and minerals increases for women who are breastfeeding their babies. The following table compares the recommended vitamins and minerals for lactating women to the levels for nonpregnant and pregnant women from Table 13.3 “Recommended Nutrient Intakes during Pregnancy”.

Table 13.3 Recommended Nutrient Intakes during Lactation

Nutrient Nonpregnant Women Pregnant Women Lactating Women
Vitamin A (mcg) 700.0 770.0 1,300.0
Vitamin B6 (mg) 1.5 1.9 2.0
Vitamin B12 (mcg) 2.4 2.6 2.8
Vitamin C (mg) 75.0 85.0 120.0
Vitamin D (mcg) 5.0 5.0 5.0
Vitamin E (mg) 15.0 15.0 19.0
Calcium (mg) 1,000.0 1,000.0 1,000.0
Folate (mcg) 400.0 600.0 500.0
Iron (mg) 18.0 27.0 9.0
Magnesium (mg) 320.0 360.0 310.0
Niacin (B3) (mg) 14.0 18.0 17.0
Phosphorus 700.0 700.0 700.0
Riboflavin (B2) (mg) 1.1 1.4 1.6
Thiamine (B1) (mg) 1.1 1.4 1.4
Zinc (mg) 8.0 11.0 12.0

Source: Institute of Medicine. 2006. Dietary Reference Intakes: The Essential Guide to Nutrient Requirements. Washington, DC: The National Academies Press. https://doi.org/10.17226/11537. Accessed December 10, 2017.

Calcium requirements do not change during breastfeeding because of more efficient absorption, which is the case during pregnancy, too. However, the reasons for this differ. During pregnancy, there is enhanced absorption within the gastrointestinal tract. During lactation, there is enhanced retention by the kidneys. The RDA for phosphorus, fluoride, and molybdenum also remains the same.

Components of Breastmilk

Human breast milk not only provides adequate nutrition for infants, it also helps to protect newborns from disease. In addition, breast milk is rich in cholesterol, which is needed for brain development. It is helpful to know the different types and components of breastmilk, along with the nutrients they provide to enable an infant survive and thrive. Colostrum is produced immediately after birth, prior to the start of milk production, and lasts for several days after the arrival of the baby. Colostrum is thicker than breast milk, and is yellowish or creamy in color. This protein-rich liquid fulfills an infant’s nutrient needs during those early days. Although low in volume, colostrum is packed with concentrated nutrition for newborns. This special milk is high in fat-soluble vitamins, minerals, and immunoglobulins (antibodies) that pass from the mother to the baby. Immunoglobulins provide passive immunity for the newborn and protect the baby from bacterial and viral diseases.Breastfeeding: Overview.  American Pregnancy Association. http://www.americanpregnancy.org/firstyearoflife/breastfeedingoverview.htm.Updated May 16, 2017. Accessed November 29, 2017.

Two to four days after birth, colostrum is replaced by transitional milk. Transitional milk is a creamy liquid that lasts for approximately two weeks and includes high levels of fat, lactose, and water-soluble vitamins. It also contains more calories than colostrum. After a new mother begins to produce transitional milk, she typically notices a change in the volume and type of liquid secreted and an increase in the weight and size of her breasts.Breastfeeding: Overview. American Pregnancy Association. http://www.americanpregnancy.org/firstyearoflife/breastfeedingoverview.htm. Updated May 16, 2017. Accessed November 29, 2017.

Mature milk is the final fluid that a new mother produces. In most women, it begins to secrete at the end of the second week postpartum. There are two types of mature milk that appear during a feeding. Foremilk occurs at the beginning and includes water, vitamins, and protein. Hind-milk occurs after the initial release of milk and contains higher levels of fat, which is necessary for weight gain. Combined, these two types of milk ensure that a baby receives adequate nutrients to grow and develop properly.Breastfeeding: Overview. American Pregnancy Association. http://www.americanpregnancy.org/firstyearoflife/breastfeedingoverview.htm. Updated May 16, 2017. Accessed November 29, 2017.

About 90 percent of mature milk is water, which helps an infant remain hydrated. The other 10 percent contains carbohydrates, proteins, and fats, which support energy and growth. Similar to cow’s milk, the main carbohydrate of mature breast milk is lactose. Breast milk contains vital fatty acids, such as docosahexaenoic acid (DHA) and arachidonic acid (ARA). In terms of protein, breast milk contains more whey than casein (which is the reverse of cow’s milk). Whey is much easier for infants to digest than casein. Complete protein, which means all of the essential amino acids, is also present in breast milk. Complete protein includes lactoferrin, an iron-gathering compound that helps to absorb iron into an infant’s bloodstream.

In addition, breast milk provides adequate vitamins and minerals. Although absolute amounts of some micronutrients are low, they are more efficiently absorbed by infants. Other essential components include digestive enzymes that help a baby digest the breast milk. Human milk also provides the hormones and growth factors that help a newborn to develop.

Diet and Milk Quality

A mother’s diet can have a major impact on milk production and quality. As during pregnancy, lactating mothers should avoid illegal substances and cigarettes. Some legal drugs and herbal products can be harmful as well, so it is helpful to discuss them with a health-care provider. Some mothers may need to avoid certain things, such as spicy foods, that can produce gas in sensitive infants. Lactating women can drink alcohol, though they must avoid breastfeeding until the alcohol has completely cleared from their milk. Typically, this takes two to three hours for 12 ounces of beer, 5 ounces of wine, or 1.5 ounces of liquor, depending on a woman’s body weight.Harms R. Breast-Feeding and Alcohol: Is It Okay to Drink?. Mayo Foundation for Medical Education and Research. Accessed February 21, 2012. http://www.mayoclinic.com/health/breast-feeding-and-alcohol/AN02131. Updated March 11, 2016. Accessed November 28, 2017. Precautions are necessary because exposure to alcohol can disrupt an infant’s sleep schedule.

Benefits of Breastfeeding

Breastfeeding has a number of benefits, both for the mother and for the child. Breast milk contains immunoglobulins, enzymes, immune factors, and white blood cells. As a result, breastfeeding boosts the baby’s immune system and lowers the incidence of diarrhea, along with respiratory diseases, gastrointestinal problems, and ear infections. Breastfed babies also are less likely to develop asthma and allergies, and breastfeeding lowers the risk of sudden infant death syndrome. In addition, human milk encourages the growth of healthy bacteria in an infant’s intestinal tract. All of these benefits remain in place after an infant has been weaned from breast milk. Some studies suggest other possible long-term effects. For example, breast milk may improve an infant’s intelligence and protect against Type 1 diabetes and obesity, although research is ongoing in these areas.Breastfeeding Benefits Your Baby’s Immune System. Healthy Children.org. American Academy of Pediatrics. http://www.healthychildren.org/English/ages-stages/baby/breastfeeding/pages/Breastfeeding-Benefits-Your-Baby%27s-Immune-System.aspx. Updated January 1, 2006. Accessed November 28, 2017.

Breastfeeding has a number of other important benefits. It is easier for babies to digest breast milk than bottle formula, which contains proteins made from cow’s milk that require an adjustment period for infant digestive systems. Breastfed infants are sick less often than bottle-fed infants. Breastfeeding is more sustainable and results in less plastic waste and other trash. Breastfeeding can also save families money because it does not incur the same cost as purchasing formula. Other benefits include that breast milk is always ready. It does not have to be mixed, heated, or prepared. Also, breast milk is sterile and is always at the right temperature.

In addition, the skin-to-skin contact of breastfeeding promotes a close bond between mother and baby, which is an important emotional and psychological benefit. The practice also provides health benefits for the mother. Breastfeeding helps a woman’s bones stay strong, which protects against fractures later in life. Studies have also shown that breastfeeding reduces the risk of breast and ovarian cancers.Reproductive History and Breast Cancer Risk. National Cancer Institute. http://www.cancer.gov/cancertopics/factsheet/Risk/reproductive-history. Updated November 9, 2016. Accessed November 28, 2017.

The Baby-Friendly Hospital Initiative

In 1991, the WHO and UNICEF launched the Baby-Friendly Hospital Initiative (BFHI), which works to ensure that all maternities, including hospitals and free-standing facilities, become centers of breastfeeding support. A maternity can be denoted as “baby-friendly” when it does not accept substitutes to human breast milk and has implemented ten steps to support breastfeeding. These steps include having a written policy on breastfeeding communicated to health-care staff on a routine basis, informing all new mothers about the benefits and management of breastfeeding, showing new mothers how to breastfeed their infants, and how to maintain lactation, and giving newborns no food or drink other than breast milk, unless medically indicated. Since the BFHI began, more than fifteen thousand facilities in 134 countries, from Benin to Bangladesh, have been deemed “baby friendly.” As a result, more mothers are breastfeeding their newborns and infant health has improved, in both the developed world and in developing nations.The Baby-Friendly Hospital Initiative. United Nations Children’s Fund. http://www.unicef.org/programme/breastfeeding/baby.htm. Updated December 18, 2017. Accessed December 18, 2017.

Barriers to Breastfeeding

Although breast milk is ideal for almost all infants, there are some challenges that nursing mothers may face when starting and continuing to breastfeed their infants. These obstacles include painful engorgement or fullness in the breasts, sore and tender nipples, lack of comfort or confidence in public, and lack of accommodation to breastfeed or express milk in the workplace.

One of the first challenges nursing mothers face is learning the correct technique. It may take a little time for a new mother to help her baby properly latch on to her nipples. Improper latching can result in inadequate intake, which could slow growth and development. However, International Board Certified Lactation Consultants (IBCLCs), OB nurses, and registered dietitians are all trained to help new mothers learn the proper technique. Education, the length of maternity leave, and laws to protect public breastfeeding, among other measures, can all help to facilitate breastfeeding for many lactating women and their newborns.

Contraindications to Breastfeeding

Although there are numerous benefits to breastfeeding, in some cases there are also risks that must be considered. In the developed world, a new mother with HIV should not breastfeed, because the infection can be transmitted through breast milk. These women typically have access to bottle formula that is safe, and can be used as a replacement for breast milk. However, in developing nations where HIV infection rates are high and acceptable infant formula can be difficult to come by, many newborns would be deprived of the nutrients they need to develop and grow. Also, inappropriate or contaminated bottle formulas cause 1.5 million infant deaths each year. As a result, the WHO recommends that women infected with HIV in the developing world should nurse their infants while taking antiretroviral medications to lower the risk of transmission.Infant and Young Child Feeding. World Health Organization. http://www.who.int/mediacentre/factsheets/fs342/en/index.html. Updated July 2017. Accessed December 5, 2017.

Breastfeeding also is not recommended for women undergoing radiation or chemotherapy treatment for cancer. Additionally, if an infant is diagnosed with galactosemia, meaning an inability to process the simple sugar galactose, the child must be on a galactose-free diet, which excludes breast milk. This genetic disorder is a very rare condition, however, and only affects 1 in thirty- to sixty thousand newborns.Galactosemia. Genetics Home Reference, a service of the US National Library of Medicine. http://ghr.nlm.nih.gov/condition/galactosemia. Published December 12, 2017. Accessed December 14, 2017. When breastfeeding is contraindicated for any reason, feeding a baby formula enables parents and caregivers to meet their newborn’s nutritional needs.

Bottle-Feeding

Most women can and should breastfeed when given sufficient education and support. However, as discussed, a small percentage of women are unable to breastfeed their infants, while others choose not to. For parents who choose to bottle-feed, infant formula provides a balance of nutrients. However, not all formulas are the same and there are important considerations that parents and caregivers must weigh. Standard formulas use cow’s milk as a base. They have 20 calories per fluid ounce, similar to breast milk, with vitamins and minerals added. Soy-based formulas are usually given to infants who develop diarrhea, constipation, vomiting, colic, or abdominal pain, or to infants with a cow’s milk protein allergy. Hypoallergenic protein hydrolysate formulas are usually given to infants who are allergic to cow’s milk and soy protein. This type of formula uses hydrolyzed protein, meaning that the protein is broken down into amino acids and small peptides, which makes it easier to digest. Preterm infant formulas are given to low birth weight infants, if breast milk is unavailable. Preterm infant formulas have 24 calories per fluid ounce and are given until the infant reaches a desired weight.

Infant formula comes in three basic types:

  1. Powder that requires mixing with water. This is the least expensive type of formula.
  2. Concentrates, which are liquids that must be diluted with water. This type is slightly more expensive.
  3. Ready-to-use liquids that can be poured directly into bottles. This is the most expensive type of formula. However, it requires the least amount of preparation. Ready-to-use formulas are also convenient for traveling.

Most babies need about 2.5 ounces of formula per pound of body weight each day. Therefore, the average infant should consume about 24 fluid ounces of breastmilk or formula per day. When preparing formula, parents and caregivers should carefully follow the safety guidelines, since an infant has an immature immune system. All equipment used in formula preparation should be sterilized. Prepared, unused formula should be refrigerated to prevent bacterial growth. Parents should make sure not to use contaminated water to mix formula in order to prevent foodborne illnesses. Follow the instructions for powdered and concentrated formula carefully—formula that is overly diluted would not provide adequate calories and protein, while overly concentrated formula provides too much protein and too little water which can impair kidney function.

It is important to note again that both the American Academy of Pediatrics and the WHO state that breast milk is far superior to infant formula. This table compares the advantages of giving a child breast milk to the disadvantages of using bottle formula.

Table 13.4 Breast Milk versus Bottle Formula

Breast Milk Bottle Formula
Antibodies and lactoferrin in breast milk protect infants. Formula does not contain immunoprotective factors.
The iron in breast milk is absorbed more easily. Formula contains more iron than breast milk, but it is not absorbed as easily.
The feces that babies produce do not smell because breastfed infants have different bacteria in the gut. The feces that bottle-fed infants produce tends to have a foul-smelling odor.
Breast milk is always available and is always at the correct temperature. Formula must be prepared, refrigerated for storage, and warmed before it is given to an infant.
Breastfed infants are less likely to have constipation. Bottle-fed infants are more likely to have constipation.
Breastfeeding ostensibly is free, though purchasing a pump and bottles to express milk does require some expense. Formula must be purchased and is expensive.
Breast milk contains the fatty acids DHA and ARA, which are vital for brain and vision development. Some formulas contain DHA and ALA.

Source: Breastfeeding versus Bottle Feeding. American Pregnancy Association. http://www.americanpregnancy.org/firstyearoflife/breastfeedingandbottle.html. Updated May 16, 2017. Accessed December 5, 2017.

Introducing Solid Foods

Infants should be breastfed or bottle-fed exclusively for the first six months of life according to the WHO. (The American Academy of Pediatrics recommends breast milk or bottle formula exclusively for at least the first four months, but ideally for six months.) Infants should not consume solid foods prior to six months because solids do not contain the right nutrient mix that infants need. Also, eating solids may mean drinking less breast milk or bottle formula. If that occurs, an infant may not consume the right quantities of various nutrients. If parents try to feed an infant who is too young or is not ready, their tongue will push the food out, which is called an extrusion reflex. After six months, the suck-swallow reflexes are not as strong, and infants can hold up their heads and move them around, both of which make eating solid foods more feasible.

Solid baby foods can be bought commercially or prepared from regular food using a food processor, blender, food mill, or grinder at home. By nine months to a year, infants are able to chew soft foods and can eat solids that are well chopped or mashed. Infants who are fed solid foods too soon are susceptible to developing food allergies. Therefore, as parents and caregivers introduce solids, they should feed their child only one new food at a time, to help identify allergic responses or food intolerances. An iron supplement is also recommended at this time.

Everyday Connection

Different cultures have specific food customs.  In ancient Hawai‘i, poi (pounded taro) was a staple food in the diet and is still popular today due to it’s nutrient-dense structure.

Poi is high in easily digestible calories, a good source of calcium and iron along with a number of other essential vitamins and minerals. Poi also has many gastrointestinal tract health benefits due to its fiber and probiotic content.  With it’s viscous texture, poi is an excellent first food for infants to consume.

Table 13.5 Appropriate Foods for Complementary Feeding

WHAT FOODS TO GIVE AND WHY HOW TO GIVE THE FOODS
BREAST MILK: continues to provide energy and high quality nutrients up to 23 monthsSTAPLE FOODS: provide energy, some protein (cereals only) and vitamins
  • Examples: cereals (rice, wheat, maize, millet, quinoa), roots (cassava, yam and potatoes) and starchy fruits (plantain and breadfruit)

ANIMAL-SOURCE FOODS: provide high quality protein, haem iron, zinc and vitamins

  • Examples: liver, red meat, chicken, fish, eggs (not good source of iron)

MILK PRODUCTS: provide protein, energy, most vitamins (especially vitamin A and folate), calcium

  • Examples: milk, cheese, yogurt and curds

GREEN LEAFY AND ORANGE-COLOURED VEGETABLES: provide vitamins A, C, folate

  • Examples: spinach, broccoli, chard, carrots, pumpkins, sweet potatoes

PULSES: provide protein (of medium quality), energy, iron (not well absorbed)

  • Examples: chickpeas, lentils, cowpeas, black-eyed peas, kidney beans, lima beans

OILS AND FATS: provide energy and essential fatty acids

  • Examples: oils (preferably soy or rapeseed oil), margarine, butter or lard

SEEDS: provide energy

  • Examples: groundnut paste or other nut pastes, soaked or germinated seeds such as pumpkin, sunflower, melon, sesame
Infants 6–11 months
  • Continue breastfeeding
  • Give adequate servings of:
  • Thick porridge made out of maize, cassava, millet; add milk, soy, ground nuts or sugar
  • Mixtures of pureed foods made out of matoke, potatoes, cassava, posho (maize or millet) or rice: mix with fish, beans or pounded groundnuts; add green vegetables
  • Give nutritious snacks: egg, banana, bread, papaya, avocado, mango, other fruits, yogurt, milk and puddings made with milk, biscuits or crackers, bread or chapati with butter, margarine, groundnut paste or honey, bean cakes, cooked potatoes
Children 12–23 months
  • Continue breastfeeding
  • Give adequate servings of:
  • Mixtures of mashed or finely cut family foods made out of matoke, potatoes, cassava, posho (maize or millet) or rice; mix with fish or beans or pounded groundnuts; add green vegetables
  • Thick porridge made out of maize, cassava, millet; add milk, soy, ground nuts or sugar
  • Give nutritious snacks: egg, banana, bread, papaya, avocado, mango, other fruits, yogurt, milk and puddings made with milk, biscuits or crackers, bread or chapati with butter, margarine, groundnut paste or honey, bean cakes, cooked potatoes
REMINDER:
Foods rich in iron
  • Liver (any type), organ meat, flesh of animals (especially red meat), flesh of birds (especially dark meat), foods fortified with iron

Foods rich in Vitamin A

  • Liver (any type), red palm oil, egg yolk, orange coloured fruits and vegetables, dark green vegetables

Foods rich in zinc

  • Liver (any type), organ meat, food prepared with blood, flesh of animals, birds and fish, shell fish, egg yolk

Foods rich in calcium

  • Milk or milk products, small fish with bones

Foods rich in Vitamin C

  • Fresh fruits, tomatoes, peppers (green, red, yellow), green leaves and vegetables

Source: Table 3.5 Appropriate Foods For Complementary Foods.  National Institute of Health. https://www.ncbi.nlm.nih.gov/books/NBK148957/table/session3.t3/?report=objectonly. Accessed February 19, 2018.

Learning to Self-Feed

With the introduction of solid foods, young children begin to learn how to handle food and how to feed themselves. At six to seven months, infants can use their whole hand to pick up items (this is known as the palmer grasp). They can lift larger items, but picking up smaller pieces of food is difficult. At eight months, a child might be able to use a pincer grasp, which uses fingers to pick up objects. After the age of one, children slowly begin to use utensils to handle their food. Unbreakable dishes and cups are essential, since very young children may play with them or throw them when they become bored with their food.

Food Allergies

Food allergies impact four to six percent of young children in America. Common food allergens include peanuts, eggs, shellfish, wheat, and cow’s milk. However, lactating women should not make any changes to their diets. Research shows that nursing mothers who attempt to ward off allergies in their infants by eliminating certain foods may do more harm than good. According to the American Academy of Allergy, Asthma, and Immunology, mothers who avoided certain dairy products showed decreased levels in their breast milk of an immunoglobulin specific to cow’s milk. This antibody is thought to protect against the development of allergies in children. Even when an infant is at higher risk for food allergies, there is no evidence that alterations in a mother’s diet make a difference. And, it is possible that continuing breastfeeding when introducing solid foods in the infant diet may be preventative. There is currently no scientific evidence indicating that delayed (after six months of age) or early (before four months of age) introduction of solid foods is preventative. However, there is evidence that introduction of solid foods after 17 weeks of age is associated with decreased risk of developing food allergies.Alvisi P, Brusa S, Alboresi S. Recommendations on Complementary Feeding for Healthy, Full-term Infants. Italian Journal of Pediatrics. 2015; 41(36) https://www.ncbi.nlm.nih.gov/pmc/articles/PMC4464122/. Accessed November 22, 2017.Gever J. Nursing Mom’s Diet No Guard Against Baby Allergies. Medpage Today. Everyday Health, Inc. March 7, 2012. http://www.medpagetoday.com/MeetingCoverage/AAAAIMeeting/31527. Accessed November 22, 2017.

Early Childhood Caries

Primary teeth are at risk for a disorder known as early childhood caries from breast milk, formula, juice, or other drinks fed through a bottle. Liquids can build up in a baby’s mouth, and the natural or added sugars lead to decay. Early childhood caries is caused not only by the kinds of liquids given to an infant, but also by the frequency and length of time that fluids are given. Giving a child a bottle of juice or other sweet liquids several times each day, or letting a baby suck on a bottle longer than a mealtime, either when awake or asleep, can also cause early childhood caries. In addition, this practice affects the development and position of the teeth and the jaw. The risk of early childhood caries continues into the toddler years as children begin to consume more foods with a high sugar content. Therefore, parents should avoid giving their children sugary snacks and beverages.

Newborn Jaundice

Newborn jaundice is another potential problem during infancy. This condition can occur within a few days of birth and is characterized by yellowed skin or yellowing in the whites of the eyes, which can be harder to detect in dark-skinned babies. Jaundice typically appears on the face first, followed by the chest, abdomen, arms, and legs. This disorder is caused by elevated levels of bilirubin in a baby’s bloodstream. Bilirubin is a substance created by the breakdown of red blood cells and is removed by the liver. Jaundice develops when a newborn’s liver does not efficiently remove bilirubin from the blood. There are several types of jaundice associated with newborns:

  • Physiologic jaundice. The most common type of newborn jaundice and can affect up to 60 percent of full-term babies in the first week of life.
  • Breast-milk jaundice. The name for a condition that persists after physiologic jaundice subsides in otherwise healthy babies and can last for three to twelve weeks after birth. Breast-milk jaundice tends to be genetic and there is no known cause, although it may be linked to a substance in the breast milk that blocks the breakdown of bilirubin. However, that does not mean breastfeeding should be stopped. As long as bilirubin levels are monitored, the disorder rarely leads to serious complications.
  • Breastfeeding jaundice. Occurs when an infant does not get enough milk. This may happen because a newborn does not get a good start breastfeeding, does not latch on to the mother’s breast properly, or is given other substances that interfere with breastfeeding (such as juice). Treatment includes increased feedings, with help from a lactation consultant to ensure that the baby takes in adequate amounts.

Newborn jaundice is more common in a breastfed baby and tends to last a bit longer. If jaundice is suspected, a pediatrician will run blood tests to measure the amount of bilirubin in an infant’s blood. Treatment often involves increasing the number of feedings to increase bowel movements, which helps to excrete bilirubin. Within a few weeks, as the baby begins to mature and red blood cell levels diminish, jaundice typically subsides with no lingering effects.Breastfeeding and Jaundice. American Pregnancy Association. http://www.americanpregnancy.org/firstyearoflife/breastfeedingandjaundice.htm. Updated August 2015. Accessed December 5, 2017.

Toddler Years

Image by kazuend on unsplash.com / CC0

Major physiological changes continue into the toddler years. Unlike in infancy, the limbs grow much faster than the trunk, which gives the body a more proportionate appearance. By the end of the third year, a toddler is taller and more slender than an infant, with a more erect posture. As the child grows, bone density increases and bone tissue gradually replaces cartilage. This process known as ossification is not completed until puberty.Polan EU, Taylor DR. Journey Across the LifeSpan: Human Development and Health Promotion. Philadelphia: F. A. Davis Company; 2003, 108.

Developmental milestones include running, drawing, toilet training, and self-feeding. How a toddler acts, speaks, learns, and eats offers important clues about their development. By the age of two, children have advanced from infancy and are on their way to becoming school-aged children. Their physical growth and motor development slows compared to the progress they made as infants. However, toddlers experience enormous intellectual, emotional, and social changes. Of course, food and nutrition continue to play an important role in a child’s development. During this stage, the diet completely shifts from breastfeeding or bottle-feeding to solid foods along with healthy juices and other liquids. Parents of toddlers also need to be mindful of certain nutrition-related issues that may crop up during this stage of the human life cycle. For example, fluid requirements relative to body size are higher in toddlers than in adults because children are at greater risk of dehydration.

The toddler years pose interesting challenges for parents or other caregivers, as children learn how to eat on their own and begin to develop personal preferences. However, with the proper diet and guidance, toddlers can continue to grow and develop at a healthy rate.

Nutritional Requirements

MyPlate may be used as a guide for the toddler’s diet (http://www.choosemyplate.gov/preschoolers.html). A toddler’s serving sizes should be approximately one-quarter that of an adult’s. One way to estimate serving sizes for young children is one tablespoon for each year of life. For example, a two-year-old child would be served 2 tablespoons of fruits or vegetables at a meal, while a four-year-old would be given 4 tablespoons, or a quarter cup. Here is an example of a toddler-sized meal:

Energy

The energy requirements for ages two to three are about 1,000 to 1,400 calories a day. In general, a toddler needs to consume about 40 calories for every inch of height. For example, a young child who measures 32 inches should take in an average of 1,300 calories a day. However, the recommended caloric intake varies with each child’s level of activity. Toddlers require small, frequent, nutritious snacks and meals to satisfy energy requirements. The amount of food a toddler needs from each food group depends on daily calorie needs. See Table 13.6 “Serving Sizes for Toddlers” for some examples.

Table 13.6 Serving Sizes for Toddlers

Food Group Daily Serving Examples
Grains About 3 ounces of grains per day, ideally whole grains
  • 3 slices of bread
  • 1 slice of bread, plus ⅓ cup of cereal, and ¼ cup of cooked whole-grain rice or pasta
Proteins 2 ounces of meat, poultry, fish, eggs, or legumes
  • 1 ounce of lean meat or chicken, plus one egg
  • 1 ounce of fish, plus ¼ cup of cooked beans
Fruits 1 cup of fresh, frozen, canned, and/or dried fruits, or 100 percent fruit juice
  • 1 small apple cut into slices
  • 1 cup of sliced or cubed fruit
  • 1 large banana
Vegetables 1 cup of raw and/or cooked vegetables
  • 1 cup of pureed, mashed, or finely chopped vegetables (such as sweet potato, chopped broccoli, or tomato sauce)
Dairy Products 2 cups per day
  • 2 cups of fat-free or low-fat milk
  • 1 cup of fat-free or low-fat milk, plus 2 slices of cheese
  • 1 cup of fat-free or low-fat milk, plus 1 cup of yogurt

Source:It‘s about Eating Right: Size-Wise Nutrition for Toddlers. Academy of Nutrition and Dietetics. Academy of Nutrition and Dietetics. http://www.eatright.org/public/content.aspx?id=8055. Accessed December 5, 2017.

Macronutrients

For carbohydrate intake, the Acceptable Macronutrient Distribution Range (AMDR) is 45 to 65 percent of daily calories (113 to 163 grams for 1,000 daily calories). Toddlers’ needs increase to support their body and brain development. The RDA of protein is 5 to 20 percent of daily calories (13 to 50 grams for 1,000 daily calories). The AMDR for fat for toddlers is 30 to 40 percent of daily calories (33 to 44 grams for 1,000 daily calories). Essential fatty acids are vital for the development of the eyes, along with nerve and other types of tissue. However, toddlers should not consume foods with high amounts of trans fats and saturated fats. Instead, young children require the equivalent of 3 teaspoons of healthy oils, such as canola oil, each day.

Micronutrients

As a child grows bigger, the demands for micronutrients increase. These needs for vitamins and minerals can be met with a balanced diet, with a few exceptions. According to the American Academy of Pediatrics, toddlers and children of all ages need 600 international units of vitamin D per day. Vitamin D-fortified milk and cereals can help to meet this need. However, toddlers who do not get enough of this micronutrient should receive a supplement. Pediatricians may also prescribe a fluoride supplement for toddlers who live in areas with fluoride-poor water. Iron deficiency is also a major concern for children between the ages of two and three. You will learn about iron-deficiency anemia later in this section.

Learning How to Handle Food

As children grow older, they enjoy taking care of themselves, which includes self-feeding. During this phase, it is important to offer children foods that they can handle on their own and that help them avoid choking and other hazards. Examples include fresh fruits that have been sliced into pieces, orange or grapefruit sections, peas or potatoes that have been mashed for safety, a cup of yogurt, and whole-grain bread or bagels cut into pieces. Even with careful preparation and training, the learning process can be messy. As a result, parents and other caregivers can help children learn how to feed themselves by providing the following:

Feeding Problems in the Toddler Years

During the toddler years, parents may face a number of problems related to food and nutrition. Possible obstacles include difficulty helping a young child overcome a fear of new foods, or fights over messy habits at the dinner table. Even in the face of problems and confrontations, parents and other caregivers must make sure their preschooler has nutritious choices at every meal. For example, even if a child stubbornly resists eating vegetables, parents should continue to provide them. Before long, the child may change their mind, and develop a taste for foods once abhorred. It is important to remember this is the time to establish or reinforce healthy habits.

Nutritionist Ellyn Satter states that feeding is a responsibility that is split between parent and child. According to Satter, parents are responsible for what their infants eat, while infants are responsible for how much they eat. In the toddler years and beyond, parents are responsible for what children eat, when they eat, and where they eat, while children are responsible for how much food they eat and whether they eat. Satter states that the role of a parent or a caregiver in feeding includes the following:

Picky Eaters

The parents of toddlers are likely to notice a sharp drop in their child’s appetite. Children at this stage are often picky about what they want to eat. They may turn their heads away after eating just a few bites. Or, they may resist coming to the table at mealtimes. They also can be unpredictable about what they want to consume for specific meals or at particular times of the day. Although it may seem as if toddlers should increase their food intake to match their level of activity, there is a good reason for picky eating. A child’s growth rate slows after infancy, and toddlers ages two and three do not require as much food.

Toddler Obesity

Another potential problem during the early childhood years is toddler obesity. According to the US Department of Health and Human Services, in the past thirty years, obesity rates have more than doubled for all children, including infants and toddlers.Prevention of Overweight and Obesity in Infants and Toddlers. Head Start, US Department of Health and Human Services. http://eclkc.ohs.acf.hhs.gov/hslc/tta-system/family. Published 2005. Accessed February 21, 2012. Almost 10 percent of infants and toddlers weigh more than they should considering their length, and slightly more than 20 percent of children ages two to five are overweight or obese.Early Childhood Obesity Prevention Policies. National Academy of Medicine. http://nationalacademies.org/hmd/reports/2011/early-childhood-obesity-prevention-policies.aspx?_ga=2.233158171.481869186.1512972937-1253974459.1512636366 Published June 23, 2011. Accessed December 4, 2017.

Some minority group children, such as Filipinos, Native Hawaiians, and Other Pacific Islanders, in Hawaii have higher rates of overweight and obesity. In 2012, 12.8% of Hawaii WIC (low-income) participants ages two to four years were overweight and 10.2% were obese.Oshiro C, Novotny R, Grove J, Hurwitz E. Race/ethnic differences in birth size, infant growth, and body mass index at age five years in children in Hawaii. Child Obes. 2015;11(6),683-690. https://www.ncbi.nlm.nih.gov/pubmed/26561722. Accessed December 4, 2017.Thorn B, Tadler C, Huret N, Ayo E, Trippe C. WIC participant and program characteristics final report. http://www.fns.usda.gov/sites/default/files/ops/WICPC2014.pdf. Published November 2015. Accessed October 23, 2016.Segal L, Rayburn J, Martin A. Childhood obesity trends: the state of obesity. The State of Obesity. http://stateofobesity.org/childhood-obesity-trends/. Accessed October 23, 2016. One study that investigated 2000-2010 data for children ages two to eight years in 51 communities in 11 United States Affiliated Pacific (USAP) jurisdictions found that 14.4% of the study population was overweight and 14% was obese.Novotny R, Fenfang L, Fialkowski, M. Prevalence of Obesity and Acanthosis Nigricans Among Young Children in the Children’s Healthy Living Program in the United States Affiliated Pacific. Medicine. 2016; 37, e4711.   http://chl-pacific.org/wp-content/uploads/2011/08/Novotny-et-al-2016-Prevalence_of_obesity_and_acanthosis_nigricans.-Medicine.pdf. Accessed December 5, 2017.

Obesity during early childhood tends to linger as a child matures and cause health problems later in life. There are a number of reasons for this growing problem. One is a lack of time. Parents and other caregivers who are constantly on the go may find it difficult to fit home-cooked meals into a busy schedule and may turn to fast food and other conveniences that are quick and easy, but not nutritionally sound. Another contributing factor is a lack of access to fresh fruits and vegetables. This is a problem particularly in low-income neighborhoods where local stores and markets may not stock fresh produce or may have limited options. Physical inactivity is also a factor, as toddlers who live a sedentary lifestyle are more likely to be overweight or obese. Another contributor is a lack of breastfeeding support. Children who were breastfed as infants show lower rates of obesity than children who were bottle-fed.

To prevent or address toddler obesity parents and caregivers can do the following:

Early Childhood Caries

Early childhood caries remains a potential problem during the toddler years. The risk of early childhood caries continues as children begin to consume more foods with a high sugar content. According to the National Health and Nutrition Examination Survey, children between ages of two and five consume about 200 calories of added sugar per day.Consumption of Added Sugar among US Children and Adolescents.US Department of Health and Human Services. NCHS Data Brief; 2012, 87. Therefore, parents with toddlers should avoid processed foods, such as snacks from vending machines, and sugary beverages, such as soda. Parents also need to instruct a child on brushing their teeth at this time to help a toddler develop healthy habits and avoid tooth decay.

Iron-Deficiency Anemia

An infant who switches to solid foods, but does not eat enough iron-rich foods, can develop iron-deficiency anemia. This condition occurs when an iron-deprived body cannot produce enough hemoglobin, a protein in red blood cells that transports oxygen throughout the body. The inadequate supply of hemoglobin for new blood cells results in anemia. Iron-deficiency anemia causes a number of problems including weakness, pale skin, shortness of breath, and irritability. It can also result in intellectual, behavioral, or motor problems. In infants and toddlers, iron-deficiency anemia can occur as young children are weaned from iron-rich foods, such as breast milk and iron-fortified formula. They begin to eat solid foods that may not provide enough of this nutrient. As a result, their iron stores become diminished at a time when this nutrient is critical for brain growth and development.

There are steps that parents and caregivers can take to prevent iron-deficiency anemia, such as adding more iron-rich foods to a child’s diet, including lean meats, fish, poultry, eggs, legumes, and iron-enriched whole-grain breads and cereals. A toddler’s diet should provide 7 to 10 milligrams of iron daily. Although milk is critical for the bone-building calcium that it provides, intake should not exceed the RDA to avoid displacing foods rich with iron. Children may also be given a daily supplement, using infant vitamin drops with iron or ferrous sulfate drops. If iron-deficiency anemia does occur, treatment includes a dosage of 3 milligrams per kilogram once daily before breakfast, usually in the form of a ferrous sulfate syrup. Consuming vitamin C, such as orange juice, can also help to improve iron absorption.Louis A, Kazal JR. Prevention of Iron Deficiency in Infants and Toddlers. American Academy of Family Physicians. 2002;  66(7), 1217—25. http://www.aafp.org/afp/2002/1001/p1217.html. Accessed December 5, 2017.

XIV

Chapter 14. Lifespan Nutrition During Childhood and Adolescence

Introduction

E mālama ‘ia nā pono o ka ‘āina e na ‘ōpio

The traditions of the land are perpetuated by its youth

Image by Brytni K-aloha / CC BY 4.0

Learning Objectives

By the end of this chapter you will be able to:

  • Describe the physiological basis for nutrient requirements during childhood and adolescence.

Early childhood encompasses infancy and the toddler years, from birth through age three. The remaining part of childhood is the period from ages four through eight and is the time when children enter school. A number of critical physiological and emotional changes take place during the life stage from childhood through adolescences. Children’s attitudes and opinions about food deepen. They not only begin taking their cues about food preferences from family members, but also from peers and the larger culture. In Hawai‘i, organizations such as the Kōkua Hawai‘i Foundation have implemented school programs such as ‘Āina In Schools to connect children to their local land, waters, and food. The program initiative is to address childhood health issues by fostering healthy eating habits by teaching and engaging youth about local and traditional foods.About ‘Āina In Schools. Kōkua Hawai‘i Foundation. https://www.kokuahawaiifoundation.org/aina. Accessed February 16, 2018.

Parents also greatly impact their child’s nutritional choices. This time in a child’s life provides an opportunity for parents and other caregivers to reinforce good eating habits and to introduce new foods into the diet, while remaining mindful of a child’s preferences. Parents should also serve as role models for their children, who will often mimic their behavior and eating habits. Parents must continue to help their school-aged children and adolescents establish healthy eating habits and attitudes toward food. Their primary role is to bring a wide variety of health-promoting foods into the home, so that their children can make good choices.


Childhood

Image by Brytni K-aloha / CC BY 4.0

Nutritional needs change as children leave the toddler years. From ages four to eight, school-aged children grow consistently, but at a slower rate than infants and toddlers. They also experience the loss of deciduous, or “baby,” teeth and the arrival of permanent teeth, which typically begins at age six or seven. As new teeth come in, many children have some malocclusion, or malposition, of their teeth, which can affect their ability to chew food. Other changes that affect nutrition include the influence of peers on dietary choices and the kinds of foods offered by schools and afterschool programs, which can make up a sizable part of a child’s diet. Food-related problems for young children can include tooth decay, food sensitivities, and malnourishment. Also, excessive weight gain early in life can lead to obesity into adolescence and adulthood.

At this life stage, a healthy diet facilitates physical and mental development and helps to maintain health and wellness. School-aged children experience steady, consistent growth, with an average growth rate of 2–3 inches (5–7 centimeters) in height and 4.5–6.5 pounds (2–3 kilograms) in weight per year. In addition, the rate of growth for the extremities is faster than for the trunk, which results in more adult-like proportions. Long-bone growth stretches muscles and ligaments, which results in many children experiencing “growing pains,” at night, in particular.Polan EU, Taylor DR. Journey Across the LifeSpan: Human Development and Health Promotion. Philadelphia: F. A. Davis Company; 2003, 150–51.

Energy

Children’s energy needs vary, depending on their growth and level of physical activity. Energy requirements also vary according to gender. Girls ages four to eight require 1,200 to 1,800 calories a day, while boys need 1,200 to 2,000 calories daily, and, depending on their activity level, maybe more. Also, recommended intakes of macronutrients and most micronutrients are higher relative to body size, compared with nutrient needs during adulthood. Therefore, children should be provided nutrient-dense food at meal- and snack-time. However, it is important not to overfeed children, as this can lead to childhood obesity, which is discussed in the next section. Parents and other caregivers can turn to the MyPlate website for guidance: http://www.choosemyplate.gov/.

Macronutrients

For carbohydrates, the Acceptable Macronutrient Distribution Range (AMDR) is 45–65 percent of daily calories (which is a recommended daily allowance of 135–195 grams for 1,200 daily calories). Carbohydrates high in fiber should make up the bulk of intake. The AMDR for protein is 10–30 percent of daily calories (30–90 grams for 1,200 daily calories). Children have a high need for protein to support muscle growth and development. High levels of essential fatty acids are needed to support growth (although not as high as in infancy and the toddler years). As a result, the AMDR for fat is 25–35 percent of daily calories (33–47 grams for 1,200 daily calories). Children should get 17–25 grams of fiber per day.

Micronutrients

Micronutrient needs should be met with foods first. Parents and caregivers should select a variety of foods from each food group to ensure that nutritional requirements are met. Because children grow rapidly, they require foods that are high in iron, such as lean meats, legumes, fish, poultry, and iron-enriched cereals. Adequate fluoride is crucial to support strong teeth. One of the most important micronutrient requirements during childhood is adequate calcium and vitamin D intake. Both are needed to build dense bones and a strong skeleton. Children who do not consume adequate vitamin D should be given a supplement of 10 micrograms (400 international units) per day. Table 14.1 “Micronutrient Levels during Childhood” shows the micronutrient recommendations for school-aged children. (Note that the recommendations are the same for boys and girls. As we progress through the different stages of the human life cycle, there will be some differences between males and females regarding micronutrient needs.)


Table 14.1 Micronutrient Levels during Childhood

Nutrient Children, Ages 4–8
Vitamin A (mcg) 400.0
Vitamin B6 (mcg) 600.0
Vitamin B12 (mcg) 1.2
Vitamin C (mg) 25.0
Vitamin D (mcg) 5.0
Vitamin E (mg) 7.0
Vitamin K (mcg) 55.0
Calcium (mg) 800.0
Folate (mcg) 200.0
Iron (mg) 10.0
Magnesium (mg) 130.0
Niacin (B3) (mg) 8.0
Phosphorus (mg) 500.0
Riboflavin (B2) (mcg) 600.0
Selenium (mcg) 30.0
Thiamine (B1) (mcg) 600.0
Zinc (mg) 5.0

Source:Institute of Medicine. 2006. Dietary Reference Intakes: The Essential Guide to Nutrient Requirements. Washington, DC: The National Academies Press. https://doi.org/10.17226/11537. Accessed December 10, 2017.

Factors Influencing Intake

A number of factors can influence children’s eating habits and attitudes toward food. Family environment, societal trends, taste preferences, and messages in the media all impact the emotions that children develop in relation to their diet. Television commercials can entice children to consume sugary products, fatty fast-foods, excess calories, refined ingredients, and sodium. Therefore, it is critical that parents and caregivers direct children toward healthy choices.

One way to encourage children to eat healthy foods is to make meal- and snack-time fun and interesting. Parents should include children in food planning and preparation, for example selecting items while grocery shopping or helping to prepare part of a meal, such as making a salad. At this time, parents can also educate children about kitchen safety. It might be helpful to cut sandwiches, meats, or pancakes into small or interesting shapes. In addition, parents should offer nutritious desserts, such as fresh fruits, instead of calorie-laden cookies, cakes, salty snacks, and ice cream. Also, studies show that children who eat family meals on a frequent basis consume more nutritious foods.Research on the Benefits of Family Meals. Dakota County, Minnesota. https://www.co.dakota.mn.us/HealthFamily/HealthyLiving/DietNutrition/Documents/ReturnFamilyMeals.doc. Updated April 30, 2012. Accessed December 4, 2017.

Children and Malnutrition

Malnutrition is a problem many children face, in both developing nations and the developed world. Even with the wealth of food in North America, many children grow up malnourished, or even hungry. The US Census Bureau characterizes households into the following groups:

Millions of children grow up in food-insecure households with inadequate diets due to both the amount of available food and the quality of food. In the United States, about 20 percent of households with children are food insecure to some degree. In half of those, only adults experience food insecurity, while in the other half both adults and children are considered to be food insecure, which means that children did not have access to adequate, nutritious meals at times.Coleman-Jensen A, et al. Household Food Security in the United States in 2010. US Department of Agriculture, Economic Research Report, no. ERR-125; 2011.

Growing up in a food-insecure household can lead to a number of problems. Deficiencies in iron, zinc, protein, and vitamin A can result in stunted growth, illness, and limited development. Federal programs, such as the National School Lunch Program, the School Breakfast Program, and Summer Feeding Programs, work to address the risk of hunger and malnutrition in school-aged children. They help to fill the gaps and provide children living in food-insecure households with greater access to nutritious meals.

The National School Lunch Program

Beginning with preschool, children consume at least one of their meals in a school setting. Many children receive both breakfast and lunch outside of the home. Therefore, it is important for schools to provide meals that are nutritionally sound. In the United States, more than thirty-one million children from low-income families are given meals provided by the National School Lunch Program. This federally-funded program offers low-cost or free lunches to schools, and also snacks to after-school facilities. School districts that take part receive subsidies from the US Department of Agriculture (USDA) for every meal they serve. School lunches must meet the 2015 Dietary Guidelines for Americans and need to provide one-third of the RDAs for protein, vitamin A, vitamin C, iron, and calcium. However, local authorities make the decisions about what foods to serve and how they are prepared.ENational School Lunch Program Fact Sheet. US Department of Agriculture. https://fns-prod.azureedge.net/sites/default/files/cn/NSLPFactSheet.pdf. Published 2011. Accessed December 4, 2017.nter your footnote content here.

The Healthy School Lunch Campaign works to improve the food served to children in school and to promote children’s short- and long-term health by educating government officials, school officials, food-service workers, and parents. Sponsored by the Physicians Committee for Responsible Medicine, this organization encourages schools to offer more low-fat, cholesterol-free options in school cafeterias and in vending machines.Healthy School Lunches. Physicians Committee for Responsible Medicine. http://healthyschoollunches.org/. Accessed March 5, 2012.

Food Allergies and Food Intolerance

As discussed previously, the development of food allergies is a concern during the toddler years. This remains an issue for school-aged children. Recent studies show that three million children under age eighteen are allergic to at least one type of food.Allergy Statistics. American Academy of Allergy, Asthma and Immunology. http://www.aaaai.org/about-the-aaaai/newsroom/allergy-statistics.aspx. Accessed on March 5, 2012.

Some of the most common allergenic foods include peanuts, milk, eggs, soy, wheat, and shellfish. An allergy occurs when a protein in food triggers an immune response, which results in the release of antibodies, histamine, and other defenders that attack foreign bodies. Possible symptoms include itchy skin, hives, abdominal pain, vomiting, diarrhea, and nausea. Symptoms usually develop within minutes to hours after consuming a food allergen. Children can outgrow a food allergy, especially allergies to wheat, milk, eggs, or soy.

Anaphylaxis is a life-threatening reaction that results in difficulty breathing, swelling in the mouth and throat, decreased blood pressure, shock, or even death. Milk, eggs, wheat, soybeans, fish, shellfish, peanuts, and tree nuts are the most likely to trigger this type of response. A dose of the drug epinephrine is often administered via a “pen” to treat a person who goes into anaphylactic shock.Food Allergy Quick Facts. National Institutes of Health, US Department of Health and Human Services. http://www.niaid.nih.gov/topics/foodallergy/understanding/pages/quickfacts.aspx. Updated March 27, 2017. Accessed December 10, 2017.

Some children experience a food intolerance, which does not involve an immune response. A food intolerance is marked by unpleasant symptoms that occur after consuming certain foods. Lactose intolerance, though rare in very young children, is one example. Children who suffer from this condition experience an adverse reaction to the lactose in milk products. It is a result of the small intestine’s inability to produce enough of the enzyme lactase, which is produced by the small intestine. Symptoms of lactose intolerance usually affect the GI tract and can include bloating, abdominal pain, gas, nausea, and diarrhea. An intolerance is best managed by making dietary changes and avoiding any foods that trigger the reaction.Lactose Intolerance. National Institute of Diabetes and Digestive and Kidney Diseases. http://digestive.niddk.nih.gov/ddiseases/pubs/lactoseintolerance/. Updated June 2014. Accessed December 4, 2017.

The Threat of Lead Toxicity

There is a danger of lead toxicity, or lead poisoning, among school-aged children. Lead is found in plumbing in old homes, in lead-based paint, and occasionally in the soil. Contaminated food and water can increase exposure and result in hazardous lead levels in the blood. Children under age six are especially vulnerable. They may consume items tainted with lead, such as chipped, lead-based paint. Another common exposure is lead dust in carpets, with the dust flaking off of paint on walls. When children play or roll around on carpets coated with lead, they are in jeopardy. Lead is indestructible, and once it has been ingested it is difficult for the human body to alter or remove it. It can quietly build up in the body for months, or even years, before the onset of symptoms. Lead toxicity can damage the brain and central nervous system, resulting in impaired thinking, reasoning, and perception.

Treatment for lead poisoning includes removing the child from the source of contamination and extracting lead from the body. Extraction may involve chelation therapy, which binds with lead so it can be excreted in urine. Another treatment protocol, EDTA therapy, involves administering a drug called ethylenediaminetetraacetic acid to remove lead from the bloodstream of patients with levels greater than 45 mcg/dL.Lead Exposure: Tips to Protect Your Child. Mayo Foundation for Medical Education and Research. https://www.mayoclinic.org/diseases-conditions/lead-poisoning/in-depth/lead-exposure/art-20044627. Updated March 12, 2015. Accessed December 5, 2017. Fortunately, lead toxicity is highly preventable. It involves identifying potential hazards, such as lead paint and pipes, and removing them before children are exposed to them.

Adolescence

Image by Peter Hershey on unsplash.com / CC0

The onset of puberty is the beginning of adolescence and is the bridge between the childhood years and young adulthood. According to the DRI recommendations, adolescence is divided into two age groups: 9 through 13 years, and 14 through 18 years. Some of the important physiological changes that take place during this stage include the development of primary sex characteristics, or the reproductive organs, along with the onset of menstruation in females. This life stage is also characterized by the appearance of secondary sex characteristics, such as the growth of facial and body hair, the development of breasts in girls, and the deepening of the voice in boys. Other physical changes include rapid growth and alterations in body proportions.Polan EU, Taylor DR. Journey Across the LifeSpan: Human Development and Health Promotion. Philadelphia: F. A. Davis Company; 2003, 170–71. All of these changes, as well as the accompanying mental and emotional adjustments, should be supported with sound nutrition.

The Onset of Puberty (Ages 9 through 13 years)

This period of physical development is divided into two phases. The first phase involves height increases from 20 to 25 percent. Puberty is second to the prenatal period in terms of rapid growth as the long bones stretch to their final, adult size. Girls grow 2–8 inches (5–20 centimeters) taller, while boys grow 4–12 inches (10–30 centimeters) taller. The second phase involves weight gain related to the development of bone, muscle, and fat tissue. Also in the midst of puberty, the sex hormones trigger the development of reproductive organs and secondary sexual characteristics, such as pubic hair. Girls also develop “curves,” while boys become broader and more muscular.McMillan B. Illustrated Atlas of the Human Body. Sydney, Australia: Weldon Owen; 2008, 258.

Energy and Macronutrients

The energy requirements for preteens differ according to gender, growth, and activity level. For ages nine to thirteen, girls should consume about 1,400 to 2,200 calories per day and boys should consume 1,600 to 2,600 calories per day. Physically active preteens who regularly participate in sports or exercise need to eat a greater number of calories to account for increased energy expenditures.

For carbohydrates, the AMDR is 45 to 65 percent of daily calories (which is a recommended daily allowance of 158–228 grams for 1,400–1,600 daily calories). Carbohydrates that are high in fiber should make up the bulk of intake. The AMDR for protein is 10 to 30 percent of daily calories (35–105 grams for 1,400 daily calories for girls and 40–120 grams for 1,600 daily calories for boys). The AMDR for fat is 25 to 35 percent of daily calories (39–54 grams for 1,400 daily calories for girls and 44–62 grams for 1,600 daily calories for boys), depending on caloric intake and activity level.

Micronutrients

Key vitamins needed during puberty include vitamins D, K, and B12. Adequate calcium intake is essential for building bone and preventing osteoporosis later in life. Young females need more iron at the onset of menstruation, while young males need additional iron for the development of lean body mass. Almost all of these needs should be met with dietary choices, not supplements (iron is an exception). Table 14.2 “Micronutrient Levels during Puberty” shows the micronutrient recommendations for young adolescents.

Table 14.2  Micronutrient Levels during Puberty

Nutrient Preteens, Ages 9–13
Vitamin A (mcg) 600.0
Vitamin B6 (mg) 1.0
Vitamin B12 (mcg) 1.8
Vitamin C (mg) 45.0
Vitamin D (mcg) 5.0
Vitamin E (mg) 11.0
Vitamin K (mcg) 60.0
Calcium (mg) 1,300.0
Folate (mcg) 300.0
Iron (mg) 8.0
Magnesium (mg) 240.0
Niacin (B3) (mg) 12.0
Phosphorus (mg) 1,250.0
Riboflavin (B2) (mcg) 900.0
Selenium (mcg) 40.0
Thiamine (B1) (mcg) 900.0
Zinc (mg) 8.0

Source: Institute of Medicine. 2006. Dietary Reference Intakes: The Essential Guide to Nutrient Requirements. Washington, DC: The National Academies Press. https://doi.org/10.17226/11537. Accessed December 10, 2017.

Late Adolescence

Image by Riley McCullough on unsplash.com / CC0

After puberty, the rate of physical growth slows down. Girls stop growing taller around age sixteen, while boys continue to grow taller until ages eighteen to twenty. One of the psychological and emotional changes that takes place during this life stage includes the desire for independence as adolescents develop individual identities apart from their families.Polan EU, Taylor DR. Journey Across the LifeSpan: Human Development and Health Promotion. Philadelphia: F. A. Davis Company; 2003, 171–76. As teenagers make more and more of their dietary decisions, parents or other caregivers and authority figures should guide them toward appropriate, nutritious choices. One way that teenagers assert their independence is by choosing what to eat. They have their own money to purchase food and tend to eat more meals away from home. Older adolescents also can be curious and open to new ideas, which includes trying new kinds of food and experimenting with their diet. For example, teens will sometimes skip a main meal and snack instead. That is not necessarily problematic. Their choice of food is more important than the time or place.

However, too many poor choices can make young people nutritionally vulnerable. Teens should be discouraged from eating fast food, which has a high fat and sugar content, or frequenting convenience stores and using vending machines, which typically offer poor nutritional selections. Other challenges that teens may face include obesity and eating disorders. At this life stage, young people still need guidance from parents and other caregivers about nutrition-related matters. It can be helpful to explain to young people how healthy eating habits can support activities they enjoy, such as skateboarding or dancing, or connect to their desires or interests, such as a lean figure, athletic performance, or improved cognition.

As during puberty, growth and development during adolescence differs in males than in females. In teenage girls, fat assumes a larger percentage of body weight, while teenage boys experience greater muscle and bone increases. For both, primary and secondary sex characteristics have fully developed and the rate of growth slows with the end of puberty. Also, the motor functions of an older adolescent are comparable to those of an adult.Polan EU, Taylor DR. Journey Across the Life Span: Human Development and Health Promotion. Philadelphia: F. A. Davis Company; 2003, 171–173. Again, adequate nutrition and healthy choices support this stage of growth and development.

Energy and Macronutrients

Adolescents have increased appetites due to increased nutritional requirements. Nutrient needs are greater in adolescence than at any other time in the life cycle, except during pregnancy. The energy requirements for ages fourteen to eighteen are 1,800 to 2,400 calories for girls and 2,000 to 3,200 calories for boys, depending on activity level. The extra energy required for physical development during the teenaged years should be obtained from foods that provide nutrients instead of “empty calories.” Also, teens who participate in sports must make sure to meet their increased energy needs.

Older adolescents are more responsible for their dietary choices than younger children, but parents and caregivers must make sure that teens continue to meet their nutrient needs. For carbohydrates, the AMDR is 45 to 65 percent of daily calories (203–293 grams for 1,800 daily calories). Adolescents require more servings of grain than younger children, and should eat whole grains, such as wheat, oats, barley, and brown rice. The Institute of Medicine recommends higher intakes of protein for growth in the adolescent population. The AMDR for protein is 10 to 30 percent of daily calories (45–135 grams for 1,800 daily calories), and lean proteins, such as meat, poultry, fish, beans, nuts, and seeds are excellent ways to meet those nutritional needs.

The AMDR for fat is 25 to 35 percent of daily calories (50–70 grams for 1,800 daily calories), and the AMDR for fiber is 25–34 grams per day, depending on daily calories and activity level. It is essential for young athletes and other physically active teens to intake enough fluids, because they are at a higher risk for becoming dehydrated.

Micronutrients

Micronutrient recommendations for adolescents are mostly the same as for adults, though children this age need more of certain minerals to promote bone growth (e.g., calcium and phosphorus, along with iron and zinc for girls). Again, vitamins and minerals should be obtained from food first, with supplementation for certain micronutrients only (such as iron).

The most important micronutrients for adolescents are calcium, vitamin D, vitamin A, and iron. Adequate calcium and vitamin D are essential for building bone mass. The recommendation for calcium is 1,300 milligrams for both boys and girls. Low-fat milk and cheeses are excellent sources of calcium and help young people avoid saturated fat and cholesterol. It can also be helpful for adolescents to consume products fortified with calcium, such as breakfast cereals and orange juice. Iron supports the growth of muscle and lean body mass. Adolescent girls also need to ensure sufficient iron intake as they start to menstruate. Girls ages twelve to eighteen require 15 milligrams of iron per day. Increased amounts of vitamin C from orange juice and other sources can aid in iron absorption. Also, adequate fruit and vegetable intake allows for meeting vitamin A needs. Table 14.3 “Micronutrient Levels during Older Adolescence” shows the micronutrient recommendations for older adolescents, which differ slightly for males and females, unlike the recommendations for puberty.

Table 14.3 Micronutrient Levels during Older Adolescence

Nutrient Males, Ages 14–18 Females, Ages 14–18
Vitamin A (mcg) 900.0 700.0
Vitamin B6 (mg) 1.3 1.2
Vitamin B12 (mcg) 2.4 2.4
Vitamin C (mg) 75.0 65.0
Vitamin D (mcg) 5.0 5.0
Vitamin E (mg) 15.0 15.0
Vitamin K (mcg) 75.0 75.0
Calcium (mg) 1,300.0 1,300.0
Folate mcg) 400.0 400.0
Iron (mg) 11.0 15.0
Magnesium (mg) 410.0 360.0
Niacin (B3) (mg) 16.0 14.0
Phosphorus (mg) 1,250.0 1,250.0
Riboflavin (B2) (mg) 1.3 1.0
Selenium (mcg) 55.0 55.0
Thiamine (B1) (mg) 1.2 1.0
Zinc (mg) 11.0 9.0

Source: Institute of Medicine. 2006. Dietary Reference Intakes: The Essential Guide to Nutrient Requirements. Washington, DC: The National Academies Press. https://doi.org/10.17226/11537. Accessed December 10, 2017.

Eating Disorders

Many teens struggle with an eating disorder, which can have a detrimental effect on diet and health. A study published by North Dakota State University estimates that these conditions impact twenty-four million people in the United States and seventy million worldwide.Eating Disorder Statistics. North Dakota State University. http://www.ndsu.edu/fileadmin/counseling/Eating_Disorder_Statistics.pdf. Accessed March 5, 2012. These disorders are more prevalent among adolescent girls, but have been increasing among adolescent boys in recent years. Because eating disorders often lead to malnourishment, adolescents with an eating disorder are deprived of the crucial nutrients their still-growing bodies need.

Eating disorders involve extreme behavior related to food and exercise. Sometimes referred to as “starving or stuffing,” they encompass a group of conditions marked by under eating or overeating. Some of these conditions include:

Eating disorders stem from stress, low self-esteem, and other psychological and emotional issues. It is important for parents to watch for signs and symptoms of these disorders, including sudden weight loss, lethargy, vomiting after meals, and the use of appetite suppressants. Eating disorders can lead to serious complications or even be fatal if left untreated. Treatment includes cognitive, behavioral, and nutritional therapy.

Childhood and Adolescent Obesity

Children need adequate caloric intake for growth, and it is important not to impose very restrictive diets. However, exceeding caloric requirements on a regular basis can lead to childhood obesity, which has become a major problem in North America. Nearly one of three US children and adolescents are overweight or obese.Learn the Facts. Let’s Move. https://letsmove.obamawhitehouse.archives.gov/learn-facts/epidemic-childhood-obesity. Accessed December 5, 2017.

There are a number of reasons behind this problem, including:

Children who suffer from obesity are more likely to become overweight or obese adults. Obesity has a profound effect on self-esteem, energy, and activity level. Even more importantly, it is a major risk factor for a number of diseases later in life, including cardiovascular disease, Type 2 diabetes, stroke, hypertension, and certain cancers.Obesity and Overweight Fact Sheet. World Health Organization. http://www.who.int/mediacentre/factsheets/fs311/en/. Updated October 2017. Accessed November 29, 2017.

A percentile for body mass index (BMI) specific to age and sex is used to determine if a child is overweight or obese. This is more appropriate than the BMI categories used for adults because the body composition of children varies as they develop, and differs between boys and girls. If a child gains weight inappropriate to growth, parents and caregivers should limit energy-dense, nutrient-poor snack foods. In addition, it is extremely beneficial to increase a child’s physical activity and limit sedentary activities, such as watching television, playing video games, or surfing the Internet.

Programs to address childhood obesity can include behavior modification, exercise counseling, psychological support or therapy, family counseling, and family meal-planning advice. For most, the goal is not weight loss, but rather allowing height to catch up with weight as the child continues to grow. Rapid weight loss is not recommended for preteens or younger children due to the risk of deficiencies and stunted growth.

Avoiding Added Sugars

One major contributing factor to childhood obesity is the consumption of added sugars. Added sugars include not only sugar added to food at the table, but also are ingredients in items such as bread, cookies, cakes, pies, jams, and soft drinks. The added sugar in store-bought items may be listed as white sugar, brown sugar, high-fructose corn syrup, honey, malt syrup, maple syrup, molasses, anhydrous dextrose, crystal dextrose, and concentrated fruit juice. (Not included are sugars that occur naturally in foods, such as the lactose in milk or the fructose in fruits.) In addition, sugars are often “hidden” in items added to foods after they’re prepared, such as ketchup, salad dressing, and other condiments. According to the National Center for Health Statistics, young children and adolescents consume an average of 322 calories per day from added sugars, or about 16 percent of daily calories.Ervin RB, Kit BK, Carroll MD. Consumption of Added Sugar among US Children and Adolescents, 2005–2008. National Center for Health Statistics. NCHS Data Brief. 2012; 87. http://www.cdc.gov/nchs/data/databriefs/db87.pdf. Accessed December 5, 2017.

The primary offenders are processed and packaged foods, along with soda and other beverages. These foods are not only high in sugar, they are also light in terms of nutrients and often take the place of healthier options. Intake of added sugar should be limited to 100–150 calories per day to discourage poor eating habits.

Tools for Change

The 2008 Physical Activity Guidelines for Americans call for sixty minutes of moderate to vigorous physical activity daily for preteens and teens. This includes aerobic activity, along with bone- and muscle-strengthening exercises.2008 Physical Activity Guidelines for Americans. US Department of Health and Human Services. http://www.health.gov/paguidelines/pdf/paguide.pdf. Accessed March 5, 2012. However, many young people fall far short of this goal. Preteens must be encouraged to lead more active lifestyles to prevent or treat childhood obesity. In the United States, the Let’s Move! campaign inspires kids to start exercising. This program, launched in 2010 by First Lady Michelle Obama, works to solve the problem of rising obesity rates among children, preteens, and teens. It offers information to parents and educators, works to provide healthier food choices in schools and afterschool programs, and helps children become more active. One way the program promotes physical activity is by encouraging preteens and teens to find something they love to do. When kids find an activity they enjoy, whether riding a bike, playing football, joining a soccer team, or participating in a dance crew, they are more likely to get moving and stay healthy. You can learn more about Let’s Move! and efforts to encourage physical activity among adolescents at this website: http://www.letsmove.gov/.

XV

Chapter 15. Lifespan Nutrition in Adulthood

Introduction

E ola koa.

Live like a koa tree.


Image by nic.co on unsplash.com / CCO

Learning Objectives

By the end of this chapter you will be able to:

  • Describe the physiological basis for nutrient requirements during childhood and adolescence.

Adulthood begins at the end of adolescents and continues until the end of one’s life. During adulthood, the human body will reach maximum cardiac output specifically between ages twenty and thirty. Bone and muscle mass also reach optimal levels, and physical activity helps to improve muscle strength, endurance, and tone.Polan EU, Taylor DR. Journey Across the LifeSpan: Human Development and Health   Promotion. Philadelphia: F. A. Davis Company; 2003, 192–93. In order to maintain health and fitness throughout the lifespan, it is important to remain active. The CDC has implemented science based physical activity guidelines for all Americans to follow in hopes of creating a healthy lifestyle. In Hawai‘i, nearly 60% of all adults meet the recommended aerobic physical activity guidelines. However, only 32% of adults meet the guidelines for muscle strengthening and less than a quarter (23%) of Hawai‘i residents meet the recommended guidelines for both.Hawaii Physical Activity and Nutrition Plan, 2013-2020. https://health.hawaii.gov/physical-activity-nutrition/files/2013/08/Hawaii-PAN-Plan-2013-2020.pdf. Accessed February 16, 2018.    To learn more about the current physical activity guidelines visit https://www.cdc.gov/cancer/dcpc/prevention/policies_practices/physical_activity/guidelines.htm.

Along with physical activity, nutrition also plays an essential role in maintaining health through adulthood. As you’ve already learned, a healthful diet includes a variety of nutrient dense foods. The USDA Dietary Guidelines recommend eating a balanced diet from the five food groups: fruits, vegetables, protein, grains and dairy.All About the Fruit Group. USDA ChooseMyPlate.gov. https://www.choosemyplate.gov/fruit Accessed February 16, 2018. In Hawai‘i, only about 19% of adults eat the recommended amount of servings of fruits and vegetables per day. Inadequacy of any food group can lead to several health issues.Hawai‘i Physical Activity and Nutrition Plan, 2013-2020. https://health.hawaii.gov/physical-activity-nutrition/files/2013/08/Hawaii-PAN-Plan-2013-2020.pdf. Accessed February 16, 2018.    Consuming diets high in fruits and vegetables may have health benefits such as a reduced risk for heart disease, and protection against certain cancers.Nutrients and Health Benefits. USDA ChooseMyPlate.gov. https://www.choosemyplate.gov/fruits-nutrients-health. Accessed February 16, 2018.

Young Adulthood

Image by David Marcu on unsplash.com / CC0

Young adulthood is the period from ages nineteen to thirty years. It is a stable time compared to childhood and adolescence. Physical growth has been completed and all of the organs and body systems are fully developed. Typically, a young adult who is active has reached his or her physical peak and is in prime health. For example, vital capacity, or the maximum amount of air that the lungs can inhale and exhale, is at its peak between the ages of twenty and forty.Polan EU, Taylor DR. Journey Across the Life Span: Human Development and Health Promotion. Philadelphia: F. A. Davis Company; 2003, 192–93. During this life stage, it important to continue to practice good nutrition. Healthy eating habits promote metabolic functioning, assist repair and regeneration, and prevent the development of chronic conditions. In addition, the goals of a young adult, such as beginning a career or seeking out romantic relationships, can be supported with good habits. Proper nutrition and adequate physical activity at this stage not only promote wellness in the present, but also provide a solid foundation for the future.

With the onset of adulthood, good nutrition can help young adults enjoy an active lifestyle. The body of an adult does not need to devote its energy and resources to support the rapid growth and development that characterizes youth. However, the choices made during those formative years can have a lasting impact. Eating habits and preferences developed during childhood and adolescence influence health and fitness into adulthood. Some adults have gotten a healthy start and have established a sound diet and regular activity program, which helps them remain in good condition from young adulthood into the later years. Others carry childhood obesity into adulthood, which adversely affects their health. However, it is not too late to change course and develop healthier habits and lifestyle choices. Therefore, adults must monitor their dietary decisions and make sure their caloric intake provides the energy that they require, without going into excess.

Energy and Macronutrients

Young men typically have higher nutrient needs than young women. For ages nineteen to thirty, the energy requirements for women are 1,800 to 2,400 calories, and 2,400 to 3,000 calories for men, depending on activity level. These estimates do not include women who are pregnant or breastfeeding, who require a higher energy intake. For carbohydrates, the AMDR is 45 to 65 percent of daily calories. All adults, young and old, should eat fewer energy-dense carbohydrates, especially refined, sugar-dense sources, particularly for those who lead a more sedentary lifestyle. The AMDR for protein is 10 to 35 percent of total daily calories, and should include a variety of lean meat and poultry, eggs, beans, peas, nuts, and seeds. The guidelines also recommend that adults eat two 4-ounce servings (or one 8-ounce serving) of seafood per week.

It is also important to replace proteins that are high in trans fats and saturated fat with ones that are lower in solid fats and calories. All adults should limit total fat to 20 to 35 percent of their daily calories and keep saturated fatty acids to less than 10 percent of total calories by replacing them with monounsaturated and polyunsaturated fatty acids. Avoid trans fats by limiting foods that contain synthetic sources, such as partially hydrogenated oils. The AMDR for fiber is 22 to 28 grams per day for women and 28 to 34 grams per day for men. Soluble fiber may help improve cholesterol and blood sugar levels, while insoluble fiber can help prevent constipation.

Micronutrients

Micronutrient needs in adults differ slightly according to sex. Young men and women who are very athletic and perspire a great deal also require extra sodium, potassium, and magnesium. Males require more of vitamins C and K, along with thiamine, riboflavin, and niacin. Females require extra iron due to menstruation. Therefore, it can be beneficial for some young adults to follow a daily multivitamin regimen to help meet nutrient needs. But as always, it is important to remember “food first, supplements second.” Table 15.1 “Micronutrient Levels during Adulthood” shows the micronutrient recommendations for adult men and women.

Table 15.1 Micronutrient Levels during Adulthood

Nutrient Adult Males Adult Females
Vitamin A (mcg) 900.0 700.0
Vitamin B6 (mg) 1.3 1.3
Vitamin B12  (mcg) 2.4 2.4
Vitamin C (mg) 90.0 75.0
Vitamin D (mcg) 5.0 5.0
Vitamin E (mg) 15.0 15.0
Vitamin K (mcg) 120.0 90.0
Calcium (mg) 1,000.0 1,000.0
Folate (mcg) 400.0 400.0
Iron (mg) 8.0 18.0
Magnesium (mg)  400.0 310.0
Niacin (mg) 16.0 14.0
Phosphorus (mg) 700.0 700.0
Riboflavin (mg) 1.3 1.1
Selenium 55.0 55.0
Thiamin (mg) 1.2 1.1
 Zinc (mg) 11.0  8.0
Source: Institute of Medicine. 2006. Dietary Reference Intakes: The Essential Guide to Nutrient Requirements. Washington, DC: The National Academies Press. https://doi.org/10.17226/11537. Accessed December 10, 2017.

Nutritional Concerns in Young Adulthood

There are a number of intake recommendations for young adults. According to the IOM, an adequate intake (AI) of fluids for men is 3.7 liters per day, from both food and liquids. The AI for women is 2.7 liters per day, from food and liquids.Institute of Medicine. 2005. Dietary Reference Intakes for Water, Potassium, Sodium, Chloride, and Sulfate. Washington, DC: The National Academies Press. https://doi.org/10.17226/10925. Accessed December 10, 2017. It is best when fluid intake is from water, instead of sugary beverages, such as soda. Fresh fruits and vegetables, including watermelon and cucumbers, are excellent food sources of fluid. In addition, young adults should avoid consuming excessive amounts of sodium. The health consequences of high sodium intake include high blood pressure and its complications. Therefore, it is best to limit sodium to less than 2,300 milligrams per day.

Obesity during Adulthood

Obesity remains a major concern into young adulthood. For adults, a BMI above 25 is considered overweight, and a BMI of 30 or higher is obese. By that measurement, about two-thirds of all adults in the United States are overweight or obese, with 35.7 percent considered to be obese. Prevalence of Obesity in the United States, 2009–2010. Centers for Disease Control, National Center for Health Statistics.NCHS Data Brief, No. 82. http://www.cdc.gov/nchs/data/databriefs/db82.pdf. Published January 2012. Accessed December 8, 2017. As during childhood and adolescence, physical inactivity and poor dietary choices are major contributors to obesity in adulthood. Solid fats, alcohol, and added sugars (SoFAAS) make up 35 percent of total calories for most people, leading to high levels of saturated fat and cholesterol and insufficient dietary fiber. Therefore, it is important to limit unrefined carbohydrates and processed foods.

Middle Age

Middle age is defined as the period from age thirty-one to fifty. The early period of this stage is very different from the end. For example, during the early years of middle age, many women experience pregnancy, childbirth, and lactation. In the latter part of this life stage, women face perimenopause, which is a transition period that leads up to menopause, or the end of menstruation. A number of physical changes take place in the middle-aged years, including the loss of bone mass in women due to dropping levels of estrogen during menopause. In both men and women, visual acuity declines, and by age forty there can be a decreased ability to see objects at a close distance, a condition known as presbyopia.Polan EU, Taylor DR. Journey Across the Life Span: Human Development and Health Promotion. Philadelphia: F. A. Davis Company; 2003, 192–93. All of these are signs of aging, as the human body begins to change in subtle and not-so-subtle ways. However, a middle aged person can remain vital, healthy, and near his or her physical peak with proper diet and adequate exercise.

During this stage of the human life cycle, adults begin to experience the first outward signs of aging. Wrinkles begin to appear, joints ache after a highly active day, and body fat accumulates. There is also a loss of muscle tone and elasticity in the connective tissue.Polan EU, Taylor DR. Journey Across the Life Span: Human Development and Health Promotion. Philadelphia: F. A. Davis Company; 2003, 212–213. Many people in their late thirties and in their forties notice a decline in endurance, the onset of wear-and-tear injuries (such as osteoarthritis), and changes in the digestive system. Wounds and other injuries also take longer to heal. Body composition changes due to fat deposits in the trunk. To maintain health and wellness during the middle-aged years and beyond, it is important to:

Energy and Macronutrients

The energy requirements for ages thirty-one to fifty are 1,800 to 2,200 calories for women and 2,200 to 3,000 calories for men, depending on activity level. These estimates do not include women who are pregnant or breastfeeding. Middle-aged adults must rely on healthy food sources to meet these needs. In many parts of North America, typical dietary patterns do not match the recommended guidelines. For example, five foods—iceberg lettuce, frozen potatoes, fresh potatoes, potato chips, and canned tomatoes—account for over half of all vegetable intake.Drewnowski A, Darmon, N. Food Choices and Diet Cost: an Economic Analysis. The Journal of Nutrition. 2005; 135(4), 900-904. http://jn.nutrition.org/content/135/4/900.full. Accessed December 12, 2017. Following the dietary guidelines in the middle-aged years provides adequate but not excessive energy, macronutrients, vitamins, and minerals.

The AMDRs for carbohydrates, protein, fat, fiber, and fluids remain the same from young adulthood into middle age. It is important to avoid putting on excess pounds and limiting an intake of SoFAAS to help avoid cardiovascular disease, diabetes, and other chronic conditions.

Micronutrients

There are some differences, however, regarding micronutrients. For men, the recommendation for magnesium increases to 420 milligrams daily, while middle-aged women should increase their intake of magnesium to 320 milligrams per day. Other key vitamins needed during the middle-aged years include folate and vitamins B6 and B12 to prevent elevation of homocysteine, a byproduct of metabolism that can damage arterial walls and lead to atherosclerosis, a cardiovascular condition. Again, it is important to meet nutrient needs with food first, then supplementation, such as a daily multivitamin, if you can’t meet your needs through food.

Preventive/Defensive Nutrition

During the middle-aged years, preventive nutrition can promote wellness and help organ systems to function optimally throughout aging. Preventive nutrition is defined as dietary practices directed toward reducing disease and promoting health and well-being. Healthy eating in general—such as eating unrefined carbohydrates instead of refined carbohydrates and avoiding trans fats and saturated fats—helps to promote wellness. However, there are also some things that people can do to target specific concerns. One example is consuming foods high in antioxidants, such as strawberries, blueberries, and other colorful fruits and vegetables, to reduce the risk of cancer.


Phytochemicals are also great nonessential nutrients that may promote body wellness.For example, carotenoids, which are found in carrots, cantaloupes, sweet potatoes, and butternut squash, may protect against cardiovascular disease by helping to prevent the oxidation of cholesterol in the arteries, although research is ongoing.Voutilainen S, Nurmi T, Mursu J, Rissanen, TH. Carotenoids and Cardiovascular Health. Am J Clin Nutr. 2006; 83, 1265–71. http://www.ajcn.org/content/83/6/1265.full.pdf. Accessed December 9, 2017. According to the American Cancer Society, some studies suggest that a phytochemical found in watermelons and tomatoes called lycopene may protect against stomach, lung, and prostate cancer, although more research is needed.Lycopene. American Cancer Society. http://www.cancer.org/Treatment/TreatmentsandSideEffects/ComplementaryandAlternativeMedicine/DietandNutrition/lycopene. Updated May 13, 2010. Accessed November 29, 2017.

Omega-3 fatty acids can help to prevent coronary artery disease. These crucial nutrients are found in oily fish, including salmon, mackerel, tuna, herring, cod, and halibut. Other beneficial fats that are vital for healthy functioning include monounsaturated fats, which are found in plant oils, avocados, peanuts, and pecans.

Menopause

In the middle-aged years, women undergo a specific change that has a major effect on their health. They begin the process of menopause, typically in their late forties or early fifties. The ovaries slowly cease to produce estrogen and progesterone, which results in the end of menstruation. Menopausal symptoms can vary, but often include hot flashes, night sweats, and mood changes. The hormonal changes that occur during menopause can lead to a number of physiological changes as well, including alterations in body composition, such as weight gain in the abdominal area. Bone loss is another common condition related to menopause due to the loss of female reproductive hormones. Bone thinning increases the risk of fractures, which can affect mobility and the ability to complete everyday tasks, such as cooking, bathing, and dressing.Eating Right During Menopause.Academy of Nutrition and Dietetics. http://www.eatright.org/Public/content.aspx?id=6809. Updated January 2015. Accessed December 4, 2017.

Recommendations for women experiencing menopause or perimenopause (the stage just prior to the end of the menstruation) include:

Older Adulthood: The Golden Years

Image by Alex Blajan on unsplash.com / CC0


The senior years are the period from age fifty-one until the end of life. A number of physiological and emotional changes take place during this life stage. For example, many older adults face serious health challenges, such as cancer, heart disease, diabetes, or dementia. Both men and women experience a loss of hormone production, muscle mass, and strength and undergo changes in body composition. Fat deposits build up in the abdominal area, which increases the risk for Type 2 diabetes and cardiovascular disease. The skin becomes thinner and may take longer to heal after an injury. Around age seventy, men begin to experience bone loss when estrogen and testosterone levels begin to decline.American Medical Association. Complete Guide to Prevention and Wellness. Hoboken, NJ: John Wiley & Sons, Inc.; 2008, 512. Also in the later years, the heart has to work harder because each pump is not as efficient as it used to be. Kidneys are not as effective in excreting metabolic products such as sodium, acid, and potassium, which can alter water balance and increase the risk for over- or underhydration. In addition, immune function decreases and there is lower efficiency in the absorption of vitamins and minerals.

In addition, disorders of the nervous system can have profound effects. Dementia is the umbrella term for changes in the normal activity of the brain. Elderly adults who suffer from dementia may experience memory loss, agitation, and delusions. One in eight people over age sixty-four and almost half of all people over eighty-five suffer from the brain disorder Alzheimer’s disease, which is the most common form of dementia.American Medical Association. Complete Guide to Prevention and Wellness. Hoboken, NJ: John Wiley & Sons, Inc.; 2008, 421. Neurological disorder and psychological conditions, such as depression, can influence attitudes toward food, along with the ability to prepare or ingest food. They might lead some adults to overindulge to compensate for stress or emotions that are difficult to handle. Other adults might eat less or pay less attention to their diet and nutritional needs. Older adults may also need guidance from dietitians and health-care professionals to make the best dietary choices for this stage of life.

Beginning at age fifty-one, requirements change once again and relate to the nutritional issues and health challenges that older people face. After age sixty, blood pressure rises and the immune system may have more difficulty battling invaders and infections. The skin becomes more wrinkled and hair has turned gray or white or fallen out, resulting in hair thinning. Older adults may gradually lose an inch or two in height. Also, short-term memory might not be as keen as it once was.Beverly McMillan, Illustrated Atlas of the Human Body (Sydney, Australia: Weldon Owen, 2008), 260.

Being either underweight or overweight is also a major concern for the elderly. However, many older adults remain in relatively good health and continue to be active into their golden years. Good nutrition is often the key to maintaining health later in life. In addition, the fitness and nutritional choices made earlier in life set the stage for continued health and happiness.  Older adults should continue to consume nutrient-dense foods and remain physically active. However, deficiencies are more common after age sixty, primarily due to reduced intake or malabsorption. The loss of mobility among frail, homebound elderly adults also impacts their access to healthy, diverse foods.

Energy and Macronutrients

Due to reductions in lean body mass and metabolic rate, older adults require less energy than younger adults. The energy requirements for people ages fifty-one and over are 1,600 to 2,200 calories for women and 2,000 to 2,800 calories for men, depending on activity level. The decrease in physical activity that is typical of older adults also influences nutritional requirements. The AMDRs for carbohydrates, protein, and fat remain the same from middle age into old age. Older adults should substitute more unrefined carbohydrates for refined ones, such as whole grains and brown rice. Fiber is especially important in preventing constipation and diverticulitis, and may also reduce the risk of colon cancer. Protein should be lean, and healthy fats, such as omega-3 fatty acids, are part of any good diet.

Micronutrients

An increase in certain micronutrients can help maintain health during this life stage. The recommendations for calcium increase to 1,200 milligrams per day for both men and women to slow bone loss. Also to help protect bones, vitamin D recommendations increase to 10–15 micrograms per day for men and women. Vitamin B6 recommendations rise to 1.7 milligrams per day for older men and 1.5 milligrams per day for older women to help lower levels of homocysteine and protect against cardiovascular disease. As adults age, the production of stomach acid can decrease and lead to an overgrowth of bacteria in the small intestine. This can affect the absorption of vitamin B12 and cause a deficiency. As a result, older adults need more B12 than younger adults, and require an intake of 2.4 micrograms per day, which helps promote healthy brain functioning. For elderly women, higher iron levels are no longer needed postmenopause and recommendations decrease to 8 milligrams per day. People over age fifty should eat foods rich with all of these micronutrients.

Nutritional Concerns for Older Adults

Dietary choices can help improve health during this life stage and address some of the nutritional concerns that many older adults face. In addition, there are specific concerns related to nutrition that affect adults in their later years. They include medical problems, such as disability and disease, which can impact diet and activity level. For example, dental problems can lead to difficulties with chewing and swallowing, which in turn can make it hard to maintain a healthy diet. The use of dentures or the preparation of pureed or chopped foods can help solve this problem. There also is a decreased thirst response in the elderly, and the kidneys have a decreased ability to concentrate urine, both of which can lead to dehydration.

Sensory Issues

At about age sixty, taste buds begin to decrease in size and number. As a result, the taste threshold is higher in older adults, meaning that more of the same flavor must be present to detect the taste. Many elderly people lose the ability to distinguish between salty, sour, sweet, and bitter flavors. This can make food seem less appealing and decrease the appetite. An intake of foods high in sugar and sodium can increase due to an inability to discern those tastes. The sense of smell also decreases, which impacts attitudes toward food. Sensory issues may also affect the digestion because the taste and smell of food stimulates the secretion of digestive enzymes in the mouth, stomach, and pancreas.

Dysphagia

Some older adults have difficulty getting adequate nutrition because of the disorder dysphagia, which impairs the ability to swallow. Any damage to the parts of the brain that control swallowing can result in dysphagia, therefore stroke is a common cause. Dysphagia is also associated with advanced dementia because of overall brain function impairment. To assist older adults suffering from dysphagia, it can be helpful to alter food consistency. For example, solid foods can be pureed, ground, or chopped to allow more successful and safe swallow. This decreases the risk of aspiration, which occurs when food flows into the respiratory tract and can result in pneumonia. Typically, speech therapists, physicians, and dietitians work together to determine the appropriate diet for dysphagia patients.

Obesity in Old Age

Similar to other life stages, obesity is a concern for the elderly. Adults over age sixty are more likely to be obese than young or middle-aged adults. As explained throughout this chapter, excess body weight has severe consequences. Being overweight or obese increases the risk for potentially fatal conditions that can afflict the elderly. They include cardiovascular disease, which is the leading cause of death in the United States, and Type 2 diabetes, which causes about seventy thousand deaths in the United States annually.Deaths and Mortality. Centers for Disease Control, National Center for Health Statistics. http://www.cdc.gov/nchs/fastats/deaths.htm. Updated May 3, 2017. Accessed December 9, 2017. Obesity is also a contributing factor for a number of other conditions, including arthritis.

For older adults who are overweight or obese, dietary changes to promote weight loss should be combined with an exercise program to protect muscle mass. This is because dieting reduces muscle as well as fat, which can exacerbate the loss of muscle mass due to aging. Although weight loss among the elderly can be beneficial, it is best to be cautious and consult with a healthcare professional before beginning a weight-loss program.

The Anorexia of Aging

In addition to concerns about obesity among senior citizens, being underweight can be a major problem. A condition known as the anorexia of aging is characterized by poor food intake, which results in dangerous weight loss. This major health problem among the elderly leads to a higher risk for immune deficiency, frequent falls, muscle loss, and cognitive deficits. Reduced muscle mass and physical activity mean that older adults need fewer calories per day to maintain a normal weight. It is important for health care providers to examine the causes for anorexia of aging among their patients, which can vary from one individual to another. Understanding why some elderly people eat less as they age can help healthcare professionals assess the risk factors associated with this condition. Decreased intake may be due to disability or the lack of a motivation to eat. Also, many older adults skip at least one meal each day. As a result, some elderly people are unable to meet even reduced energy needs.

Nutritional interventions should focus primarily on a healthy diet. Remedies can include increasing the frequency of meals and adding healthy, high-calorie foods (such as nuts, potatoes, whole-grain pasta, and avocados) to the diet. Liquid supplements between meals may help to improve caloric intake.Morley, JE. Anorexia of Aging: Physiologic and Pathologic. Am J Clin Nutr. 1997; 66, 760–73. http://www.ajcn.org/content/66/4/760.full.pdf. Accessed November 12, 2017. Health care professionals should consider a patient’s habits and preferences when developing a nutritional treatment plan. After a plan is in place, patients should be weighed on a weekly basis until they show improvement.

Vision Problems

Many older people suffer from vision problems and a loss of vision. Age-related macular degeneration is the leading cause of blindness in Americans over age sixty.American Medical Association. Complete Guide to Prevention and Wellness. Hoboken, NJ: John Wiley & Sons, Inc.; 2008, 413. This disorder can make food planning and preparation extremely difficult and people who suffer from it often must depend on caregivers for their meals. Self-feeding also may be difficult if an elderly person cannot see his or her food clearly. Friends and family members can help older adults with shopping and cooking. Food-assistance programs for older adults (such as Meals on Wheels) can also be helpful.

Diet may help to prevent macular degeneration. Consuming colorful fruits and vegetables increases the intake of lutein and zeaxanthin. Several studies have shown that these antioxidants provide protection for the eyes. Lutein and zeaxanthin are found in green, leafy vegetables such as spinach, kale, and collard greens, and also corn, peaches, squash, broccoli, Brussels sprouts, orange juice, and honeydew melon.American Medical Association. Complete Guide to Prevention and Wellness. Hoboken, NJ: John Wiley & Sons, Inc.; 2008, 415.

Longevity and Nutrition

The foods you consume in your younger years influence your health as you age. Good nutrition and regular physical activity can help you live longer and healthier. Conversely, poor nutrition and a lack of exercise can shorten your life and lead to medical problems. The right foods provide numerous benefits at every stage of life. They help an infant grow, an adolescent develop mentally and physically, a young adult achieve his or her physical peak, and an older adult cope with aging. Nutritious foods form the foundation of a healthy life at every age.

Developing Habits

Eating habits develop early in life. They are typically formed within the first few years and it is believed that they persist for years, if not for life. So it is important for parents and other caregivers to help children establish healthy habits and avoid problematic ones. Children begin expressing their preferences at an early age. Parents must find a balance between providing a child with an opportunity for self-expression, helping a child develop healthy habits, and making sure that a child meets all of their nutritional needs.

Bad habits and poor nutrition have an accrual effect. The foods you consume in your younger years will impact your health as you age, from childhood into the later stages of life. As a result, good nutrition today means optimal health tomorrow. Therefore, it is best to start making healthy choices from a young age and maintain them as you mature. However, a recent report published in the American Journal of Clinical Nutrition, suggests that adopting good nutritional choices later in life, during the forties, fifties, and even the sixties, may still help to reduce the risk of chronic disease as you grow older.Rivlin, RS. Keeping the Young-Elderly Healthy: Is It Too Late to Improve Our Health through Nutrition?. Am J Clin Nutr. 2007; 86, 1572S–6S.

Even if past nutritional and lifestyle choices were not aligned with dietary guidelines, older adults can still do a great deal to reduce their risk of disability and chronic disease. As we age, we tend to lose lean body mass. This loss of muscle and bone can have critical health implications. For example, a decrease in body strength can result in an increased risk for fractures because older adults with weakened muscles are more likely to fall, and to sustain serious injuries when they do. However, improving your diet while increasing physical activity helps to control weight, reduce fat mass, and maintain muscle and bone mass.

There are a number of changes middle-aged adults can implement, even after years of unhealthy choices. Choices include eating more dark, green, leafy vegetables, substituting high-fat proteins with lean meats, poultry, fish, beans, and nuts, and engaging in moderate physical activity for thirty minutes per day, several days per week. The resulting improvements in body composition will go a long way toward providing greater protection against falls and fractures, and helping to ward off cardiovascular disease and hypertension, among other chronic conditions.Rivlin, RS. Keeping the Young-Elderly Healthy: Is It Too Late to Improve Our Health through Nutrition?. Am J Clin Nutr. 2007; 86, 1572S–6S.

XVI

Chapter 16. Performance Nutrition

Introduction

He po‘i na kai uli, kai ko‘o, ‘a‘ohe hina pūko‘a

Though the sea be deep and rough, the coral rock remains standing.


Image by Chris McCormack on flickr.com / CC BY-ND 2.0

Learning Objectives

By the end of this chapter you will be able to:

  • Describe the physiological changes that occur in response to exercise
  • Describe the effects of physical fitness on overall health
  • Describe the purpose and applications of nutrition supplements

Becoming and staying physically fit is an important part of achieving optimal health. A well-rounded exercise program is crucial to becoming and remaining healthy. Physical activity improves your health in a number of ways. It promotes weight loss, strengthens muscles and bones, keeps the heart and lungs strong, and helps to protect against chronic disease. There are four essential elements of physical fitness: cardiorespiratory, muscular strength, flexibility, and maintaining a healthful body composition. Some enthusiasts might argue the relative importance of each, but optimal health requires some degree of balance between all four. For example, the Hawai‘i Ironman is a vigorous race that consists of a 2.4 mile swim, 112 mile bike, and a 26 mile run. All four elements of physical fitness are vital in order to complete each leg of the race. To learn more about the Hawai‘i Ironman, visit their website at http://www.ironman.com.

Some forms of exercise confer multiple benefits, which can help you to balance the different elements of physical fitness. For example, riding a bicycle for thirty minutes or more not only builds cardiorespiratory endurance, it also improves muscle strength and muscle endurance. Some forms of yoga can also build muscle strength and endurance, along with flexibility. However, addressing fitness standards in all four categories generally requires incorporating a range of activities into your regular routine. If you exercise regularly, your body will begin to change and you will notice that you are able to continue your activity longer. This is due to the overload principle that our bodies will adapt to with continuous repetition. For example, if you run a mile everyday for a week, in a few weeks you would be able to run further and likely faster.

The Essential Elements of Physical Fitness

Cardiorespiratory Endurance

Cardiorespiratory endurance is enhanced by aerobic training which involves activities that increase your heart rate and breathing such as walking, jogging, or biking. Building cardiorespiratory endurance through aerobic exercise is an excellent way to maintain a healthy weight. Working on this element of physical fitness also improves your circulatory system. It boosts your ability to supply the body’s cells with oxygen and nutrients, and to remove carbon dioxide and metabolic waste. Aerobic exercise is continuous exercise (lasting more than 2 minutes) that can range from low to high levels of intensity. In addition, aerobic exercise increases heart and breathing rates to meet increased demands for oxygen in working muscles. Regular, moderate aerobic activity, about thirty minutes at a time for five days per week, trains the body to deliver oxygen more efficiently, which strengthens the heart and lungs, and reduces the risk of cardiovascular disease.The American Heart Association Recommendations for Physical Activity in Adults. American Heart Association. Heart.org. http://www.heart.org/HEARTORG/HealthyLiving/PhysicalActivity/FitnessBasics/American-Heart-Association-Recommendations-for-Physical-Activity-Infographic_UCM_450754_SubHomePage.jsp. Accessed March 10, 2018. Strengthening your heart muscle and increasing the blood volume pumped each heartbeat will lead to a lower resting heart rate for healthy individuals. Aerobic exercise increases the ability of muscles to use oxygen for energy metabolism therefore creating ATP.

Aerobic capacity, or VO2 is the most common standard for evaluating cardiorespiratory endurance. VO2 max is your maximal oxygen uptake, and the VO2 max test measures the amount of oxygen (in relation to body weight) that you can use per minute. A test subject usually walks or runs on a treadmill or rides a stationary bicycle while the volume and oxygen content of exhaled air is measured to determine oxygen consumption as exercise intensity increases. At some point, the amount of oxygen consumed no longer increases despite an increase in exercise intensity. This value of oxygen consumption is referred to as VO2 max, ‘V’ meaning volume, and ‘max’ meaning the maximum amount of oxygen (O2) an individual is capable of utilizing. The higher the number, the more oxygen you can consume, and the faster or longer you can walk, run, bike, or swim, among other aerobic activities. VO2 max can increase over time with training.Ed Eyestone. How to Improve Your VO2 Max. RunnersWorld.com. http://www.runnersworld.com/article/0,7120,s6-238-244--12408-0,00.html. Published January 9, 2008.

Figure 16.1 VO2 Max Test

Image by Cosmed / CC BY-SA 3.0

Muscle Strength

Muscle strength is developed and maintained by weight or resistance training that often is called anaerobic exercise. Anaerobic exercise consists of short duration, high intensity movements that rely on immediately available energy sources and require little or no oxygen during the activity. This type of high intensity training is used to build muscle strength by short, high intensity activities. Building muscle mass is not just crucial for athletes and bodybuilders—building muscle strength and endurance is important for children, seniors, and everyone in between. The support that your muscles provide allows you to work, play, and live more efficiently. Strength training involves the use of resistance machines, resistance bands, free weights, or other tools. However, you do not need to pay for a gym membership or expensive equipment to strengthen your muscles. Homemade weights, such as plastic bottles filled with sand, can work just as well. You can also use your own body weight and do push-ups, leg squats, abdominal crunches, and other exercises to build your muscles. If strength training is performed at least twice a week, it can help to improve muscle strength and to increase bone strength. Strength training can also help you to maintain muscle mass during a weight-loss program.American College of Sports Medicine. Resistance Training for Health and Fitness. Acsm.org. https://www.acsm.org/docs/brochures/resistance-training.pdf. Accessed March 11, 2018.

Flexibility

Flexibility is the range of motion available to your joints. Yoga, tai chi, Pilates, and stretching exercises work to improve this element of fitness. Stretching not only improves your range of motion, it also promotes better posture, and helps you perform activities that can require greater flexibility, such as chores around the house. In addition to working on flexibility, older adults should include balance exercises in their regular routine. Balance tends to deteriorate with age, which can result in falls and fractures.Fitness Training: Elements of a Well-Rounded Routine. MayoClinic.com. http://www.mayoclinic.com/health/fitness-training/HQ01305. Updated August 10, 2017.

Body Composition

Body composition is the proportion of fat and fat-free mass (which includes bones, muscles and organs) in your body. A healthy and physically fit individual has a greater proportion of muscle and smaller proportion of fat than an unfit individual of the same weight. Although habitual physical activity can promote a more healthful body composition, other factors like age, gender, genetics, and diet contribute to an individual’s body composition. Women have a higher healthy fat percentage than men. For adult women, a healthy amount of body fat ranges from 20 to 32 percent. Adult males on the other hand range from 10 to 22 percent of body fat.Measuring and Evaluating Body Composition. ACSM.org. http://www.acsm.org/public-information/articles/2016/10/07/measuring-and-evaluating-body-composition


Metabolic Fitness

Being fit also includes metabolic fitness. It relates to the number of calories you require to survive and the number of calories you burn during physical activity. Recall that metabolism is the sum of all chemical reactions that occur in the human body to conduct life’s processes. Some are catabolic reactions that break down nutrients to supply the body with cellular energy. The rate at which a person burns calories depends on body composition, gender, age, nutritional status, physical activity, and genetics.

Increasing your daily activity and shedding excess body fat helps to improve metabolic fitness. Physical activity also makes weight management easier because it increases energy needs and lean body mass. During moderate to vigorous activity, energy expenditure raises well above the resting rate. With continuous exercise over time, regular exercise increases lean body mass as well. At rest, lean tissues use more energy than fat tissue therefore increasing basal metabolism. The combination of increased energy output, energy expenditure and basal needs over a long period of time can have a major impact on total energy expenditure (see Figure 16.2 “The Effect of Physical Activity on Energy Expenditure”). The more energy you expend, the more foods you are able to consume while maintaining a healthy weight. Any improvement to metabolic fitness is beneficial and means a decrease in the risk for developing diabetes, or other chronic conditions.

One measurement of metabolic fitness is basal metabolic rate, or BMR, which is a measurement of the amount of energy required for the body to maintain its basic functions while at rest, i.e. breathing, heart beats, liver and kidney function, and so on. On average, BMR accounts for between 50 and 70 percent of a person’s total daily energy expenditure. Different factors can affect the BMR. For example, a slender person who is tall has more body surface area and therefore has a higher RMR relative to their body mass (weight). Also, muscle utilizes more energy at rest than fat, so a person with more muscle mass has a higher BMR.

A second measurement of metabolic fitness is the number of calories burned during physical activity. The amount of calories burned depends on how much oxygen is delivered to tissues, and how efficiently metabolic reactions consume oxygen and, therefore, expend calories. One of the best estimates of energy expenditure during exercise is how much oxygen a person consumes. Recall that VO2 max is a measure of the maximum cardiorespiratory capacity to deliver oxygen to the body, especially to working muscles during exercise.. Greater VO2 max is indicative of better cardiovascular fitness. In contrast to RMR, VO2 max increases significantly with exercise training due to training adaptations that increase the body’s ability to deliver oxygen to working tissues and an increased capacity of muscles to take up and utilize oxygen.

Figure 16.2 The Effect of Physical Activity on Energy Expenditure

Image by Allison Calabrese / CC BY 4.0

Physical Activity Recommendations

The CDC along with the American College of Sports Medicine (ACSM) have evidence based  recommendations and guidelines for individuals to follow in order to obtain or maintain a healthy lifestyle. Adults should get at least 150 minutes of moderate-intensity aerobic physical activity or 75 minutes of vigorous-intensity aerobic physical activity each week. In addition to aerobic physical activity, it is recommended that adults do muscle strengthening activities on each major muscle group two or three times each week. Adults also are recommended by the ACSM to do flexibility exercises at least two to three times a week to improve range of motion. To learn more about these guidelines visit the CDC website at https://health.gov/paguidelines/guidelines/adults.aspx and the ACSM website at http://www.acsm.org/about-acsm/media-room/news-releases/2011/08/01/acsm-issues-new-recommendations-on-quantity-and-quality-of-exercise.

Fuel Sources

The human body uses carbohydrate, fat and protein in food and from body stores as energy. These essential nutrients are needed regardless of the intensity of activity you are doing. If you are lying down reading a book or running the the Honolulu Marathon, these macronutrients are always needed in the body. However, in order for these nutrients to be used as fuel for the body, their energy must be transferred into the high energy molecule known as Adenosine Triphosphate (ATP). ATP is the body’s immediate fuel source of energy that can be generated either with the presences of oxygen known as aerobic metabolism or without the presence of oxygen by anaerobic metabolism. The type of metabolism that is predominately used during physical activity is determined by the availability of oxygen and how much carbohydrate, fat, and protein are used.

Anaerobic and Aerobic Metabolism

Anaerobic metabolism occurs in the cytosol of the muscle cells. As seen in Figure 16.2 “Anaerobic versus Aerobic Metabolism”, a small amount of ATP is produced in the cytosol without the presence of oxygen. Anaerobic metabolism uses glucose as its only source of fuel and produces pyruvate and lactic acid. Pyruvate can then be used as fuel for aerobic metabolism. Aerobic metabolism takes place in the mitochondria of the cell and is able to use carbohydrates, protein or fat as its fuel source.  Aerobic metabolism is a much slower process than anaerobic metabolism but produces majority of the ATP.

Figure 16.3  Anaerobic versus Aerobic Metabolism

Image by Allison Calabrese / CC BY 4.0

Physical Activity Duration and Fuel Use

The respiratory system plays a vital role in the uptake and delivery of oxygen to muscle cells throughout the body. Oxygen is inhaled by the lungs and transferred from the lungs to the blood where the cardiovascular system circulates the oxygen-rich blood to the muscles.  The oxygen is then taken up by the muscles and can be used to generate ATP. When the body is at rest, the heart and lungs are able to supply the muscles with adequate amounts of oxygen to meet the aerobic metabolism energy needs. However, during physical activity your muscles energy and oxygen needs are increased. In order to provide more oxygen to the muscle cells, your heart rate and breathing rate will increase. The amount of oxygen that is delivered to the tissues via the cardiovascular and respiratory systems during exercise depend on the duration, intensity and physical conditioning of the individual.

During the first few steps of exercise, your muscles are the first to respond to the change in activity level. Your lungs and heart however do not react as quickly and during those beginning steps they do not begin to increase the delivery of oxygen. In order for our bodies to get the energy that is needed in these beginning steps, the muscles rely on a small amount of ATP that is stored in resting muscles. The stored ATP is able to provide energy for only a few seconds before it is depleted. Once the stored ATP is just about used up, the body resorts to another high-energy molecule known as creatine phosphate to convert ADP (adenosine diphosphate) to ATP. After about 10 seconds, the stored creatine phosphate in the muscle cells are also depleted as well.

About 15 seconds into exercise, the stored ATP and creatine phosphate are used up in the muscles. The heart and lungs have still not adapted to the increase need of oxygen so the muscles must begin to produce ATP by anaerobic metabolism (without oxygen). Anaerobic metabolism can produce ATP at a rapid pace but only uses glucose as its fuel source. The glucose is obtained from the blood of muscle glycogen. At around 30 seconds, anaerobic pathways are operating at their full capacity but because the availability of glucose is limited, it cannot continue for a long period of time.

As your exercise reaches two to three minutes, your heart rate and breathing rate have increased to supply more oxygen to your muscles. Aerobic metabolism is the most efficient way of producing ATP by producing 18 times more ATP for each molecule of glucose than anaerobic metabolism. Although the primary source of ATP in aerobic metabolism is carbohydrates, fatty acids and protein can also be used as fuel to generate ATP.

Figure 16.4 The Effect of Exercise Duration on Energy Systems

Image by Allison Calabrese / CC BY 4.0

The fuel sources for anaerobic and aerobic metabolism will change depending on the amount of nutrients available and the type of metabolism. Glucose may come from blood glucose (which is from dietary carbohydrates or liver glycogen and glucose synthesis) or muscle glycogen. Glucose is the primary energy source for both anaerobic and aerobic metabolism. Fatty acids are stored as triglycerides in muscles but about 90% of stored energy is found in adipose tissue. As low to moderate intensity exercise continues using aerobic metabolism, fatty acids become the predominant fuel source for the exercising muscles. Although protein is not considered a major energy source, small amounts of amino acids are used while resting or doing an activity.  The amount of amino acids used for energy metabolism increase if the total energy intake from your diet does not meet the nutrient needs or if you are involved in long endurance exercises. When amino acids are broken down removing the nitrogen-containing amino acid, that remaining carbon molecule can be broken down into ATP via aerobic metabolism or used to make glucose. When exercise continues for many hours, amino acid use will increase as an energy source and for glucose synthesis.

Figure 16.5 Fuel Sources for Anaerobic and Aerobic Metabolism

Physical Activity Intensity and Fuel Use

The exercise intensity determines the contribution of the type of fuel source used for ATP production(see Figure 16.4 “The Effect of Exercise Intensity on Fuel Sources”). Both anaerobic and aerobic metabolism combine during exercise to ensure that the muscles are equipped with enough ATP to carry out the demands placed on them. The amount of contribution from each type of metabolism will depend on the intensity of an activity. When low-intensity activities are performed, aerobic metabolism is used to supply enough ATP to muscles. However, during high-intensity activities more ATP is needed so the muscles must rely on both anaerobic and aerobic metabolism to meet the body’s demands.

During low-intensity activities, the body will use aerobic metabolism over anaerobic metabolism because it is more efficient by producing larger amounts of ATP. Fatty acids are the primary energy source during low-intensity activity. With fat reserves in the body being almost unlimited, low-intensity activities are able to continue for a long time. Along with fatty acids, a small amount of glucose is used as well. Glucose differs from fatty acids where glycogen storages can be depleted. As glycogen stores are depleted, fatigue will eventually set in.

Figure 16.6 The Effect of Exercise Intensity on Fuel Sources

The Fat-Burning Zone

The fat-burning zone is a low intensity aerobic activity that keeps your heart rate between 60 and 69% of your maximum heart rate. The cardio zone on the other hand is a high intensity aerobic activity that keeps the heart rate between about 70 to 85% of your maximum heart rate. So which zone do you burn the most fat in? Technically, your body burns a higher percentage of of calories from fat during a low intensity aerobic activity but there’s more to it than just that. When you begin a low intensity activity, about 50% of the calories burned comes from fat whereas in the cardio zone only 40% come froms fat. However, when looking at the actual numbers of calories burned, higher intensity activity burns just as much fat and a much greater total calories overall.

Image by Allison Calabrese / CC BY 4.0

“Hitting the Wall” or “Bonking”

If you are familiar with endurance sports, you may have heard of “hitting the wall” or “bonking.” These colloquial terms refer to the extreme fatigue that sets in after about 120 minutes of performing an endurance sport, such as marathon running or long-distance cycling. The physiology underlying “hitting the wall” means that muscles have used up all their stored glycogen and are therefore dependent on other nutrients to support their energy needs. Fatty acids are transported from fat-storing cells to the muscle to rectify the nutrient deficit. However, fatty acids take more time to convert to energy than glucose, thus decreasing performance levels. To avoid “hitting the wall” or “bonking,” endurance athletes load up on carbohydrates for a few days before the event, known as carbohydrate loading. This will maximize an athlete’s amount of glycogen stored in their liver and muscle tissues. It is important not to assume that carbohydrate loading works for everyone. Without accompanied endurance training you will not increase the amount of stored glucose. If you plan on running a five-mile race for fun with your friend and decide to eat a large amount of carbohydrates in the form of a big spaghetti dinner the night before, the excess carbohydrates will be stored as fat. Therefore, if you are not an endurance athlete exercising for more than 90 minutes, carbohydrate loading will provide no benefit, and can even have some disadvantages. Another way for athletes to avoid “hitting the wall” is to consume carbohydrate-containing drinks and foods during an endurance event. In fact, throughout the Tour de France—a twenty-two-day, twenty-four-hundred-mile race—the average cyclist consumes greater than 60 grams of carbohydrates per hour.

Sports Nutrition

Nutrient Needs for Athletes

Nutrition is essential to your performance during all types of exercise. The foods consumed in your diet are used to provide the body with enough energy to fuel an activity regardless of the intensity of activity. Athletes have different nutritional needs to support the vigorous level they compete and practice at.

Energy Needs

To determine an athletes nutritional needs, it is important to revisit the concept of energy metabolism. Energy intake is the foundation of an athlete’s diet because it supports optimal body functions, determines the amount of intake of macronutrients and micronutrients, and assists in the maintaining of body composition. Energy needs for athletes increase depending on their energy expenditure. The energy expended during physical activity are contingent on the intensity, duration, and frequency of the exercise. Competitive athletes may need 3,000 to over 5,000 calories daily compared to a typical inactive individual who needs about 2,000 calories per day. Energy needs are also affected by an individual’s gender, age, and weight.  Weight-bearing exercises, such as running, burn more calories per hour than non-weight bearing exercises, such as swimming. Weight-bearing exercises requires your body to move against gravity which requires more energy. Men are also able to burn more calories than women for the same activity because they have more muscle mass which requires more energy to support and move around.Nutrition and Athletic Performance. American College of Sports Medicine.Medicine & Science in Sports & Exercise. 2016; 48(3), 543- 568.  https://journals.lww.com/acsm-msse/Fulltext/2016/03000/Nutrition_and_Athletic_Performance.25.aspx. Accessed March 17, 2018.

Body weight and composition can have a tremendous impact on exercise performance. Body weight and composition are considered the focal points of physique for athletes because they are the able to be manipulated the most. Energy intake can play a role in manipulating the physiques for athletes. For individuals competing in sports such as football and weight lifting, having a large amount of muscle mass and increased body weight may be beneficial. This can be obtained through a combination of increased energy intake, and protein. Although certain physiques are more advantageous for specific sports, it is important to remember that a single and rigid “optimal” body composition is not recommended for any group of athletes.Nutrition and Athletic Performance. American College of Sports Medicine.Medicine & Science in Sports & Exercise. 2016; 48(3), 543- 568.  https://journals.lww.com/acsm-msse/Fulltext/2016/03000/Nutrition_and_Athletic_Performance.25.aspx. Accessed March 17, 2018.

Macronutrient Needs

The composition of macronutrients in the diet is a key factor in maximizing performance for athletes. Carbohydrates are an important fuel source for the brain and muscle during exercise.  Carbohydrate storage in the liver and muscle cells are relatively limited and therefore it is important for athletes to consume enough carbohydrates from their diet. Carbohydrate needs should increase about 3-10 g/kg/day depending on the type of training or competition.Nutrition and Athletic Performance. American College of Sports Medicine.Medicine & Science in Sports & Exercise. 2016; 48(3), 543- 568.  https://journals.lww.com/acsm-msse/Fulltext/2016/03000/Nutrition_and_Athletic_Performance.25.aspx. Accessed March 17, 2018. See Table 16.1 “Daily Needs for Carbohydrate Fuel” for carbohydrate needs for athletes depending on the intensity of the exercise.

Table 16.1 Daily Needs for Carbohydrate Fuel

Activity Level Example of Exercise Increase of Carbohydrate (g/kg of athlete’s body weight/day)
Light Low intensity or skill based activities 3-5
Moderate Moderate exercise program (about 1 hour per day) 5-7
High Endurance program (about 1-3 hours per day of moderate to high intensity exercise) 6-10
Very High Extreme commitment (4-5 hours per day of moderate to high intensity exercise) 8-12

Source: Nutrition and Athletic Performance. American College of Sports Medicine.Medicine & Science in Sports & Exercise. 2016; 48(3), 543- 568.  https://journals.lww.com/acsm-msse/Fulltext/2016/03000/Nutrition_and_Athletic_Performance.25.aspx. Accessed March 17, 2018.

Fat is a necessary component of a healthy diet to provide energy, essential fatty acids and to facilitate the absorption of fat-soluble vitamins. Athletes are recommended to consume the same amount of fat in the diet as the general population, 20-35% of their energy intake. Although these recommendations are in accordance with public health guidelines, athletes should individualize their needs based on their training level and body composition goals. Athletes who choose to excessively restrict their fat intake in an effort to lose body weight or improve body composition should ensure they are still getting the minimum recommended amount of fat. Fat intakes below 20% of energy intake will reduce the intake of fat-soluble vitamins and essential fatty acids, especially omega 3’s. Nutrition and Athletic Performance. American College of Sports Medicine.Medicine & Science in Sports & Exercise. 2016; 48(3), 543- 568.  https://journals.lww.com/acsm-msse/Fulltext/2016/03000/Nutrition_and_Athletic_Performance.25.aspx. Accessed March 17, 2018.

Although protein accounts for only about 5% of energy expended, dietary protein is necessary to support metabolic reactions (that generate ATP), and to help muscles with maintenance, growth, and repair.  During exercise, these metabolic reactions for generating ATP rely heavily on proteins such as enzymes and transport proteins. It is recommended that athletes consume 1.2 to 2.0 g/kg/day of proteins in order to support these functions. Higher intakes may also be needed for short periods of intense training or when reducing energy intake.Nutrition and Athletic Performance. American College of Sports Medicine.Medicine & Science in Sports & Exercise. 2016; 48(3), 543- 568.  https://journals.lww.com/acsm-msse/Fulltext/2016/03000/Nutrition_and_Athletic_Performance.25.aspx. Accessed March 17, 2018. See Table 16.2 “Recommended Protein Intakes for Athletes” below for a better representation of protein needs depending on extent of training and dietary sources.

Table 16.2 The Recommended Protein Intakes for Individuals

Group Protein Intake (g/kg body weight)
Most adults 0.8
Endurance athletes 1.2 to 1.4
Vegetarian endurance athletes 1.3 to 1.5
Strength athletes 1.6 to 1.7
Vegetarian strength athletes 1.7 to 1.8

Source: Dietary Reference Intakes, 2002 ACSM/ADA/Dietitians of Canada Position Statement: Nutrition & Athletic Performance, 2001. Accessed March 17, 2018.

It is important to consume adequate amounts of protein and to understand that the quality of the protein consumed affects the amount needed. High protein foods such as meats, dairy, and eggs contain all of the essential amino acids in relative amounts that most efficiently meet the body’s needs for growth, maintenance and repair of muscles. Vegetarian diets contain protein that has lower digestibility and amino acid patterns that do not match human needs as closely as most animal proteins. To compensate for this as well as the fact that plant food protein sources also contain higher amounts of fiber, higher protein intakes are recommended for vegetarian athletes. (See Table 16.2 “The Recommended Protein Intakes for Individuals” )

Micronutrient Needs

Vitamins and minerals are essential for energy metabolism, the delivery of oxygen, protection against oxidative damage, and the repair of body structures. When exercise increases, the amount of many vitamins and minerals needed are also increased due to the excess loss in nutrients.  Currently, there is not special micronutrient recommendations made for athletes but most athletes will meet their needs by consuming a balanced diet that meets their energy needs. Because the energy needs of athletes increase, they often consume extra vitamins and minerals. The major micronutrients of concern for athletes include iron, calcium, vitamin D, and some antioxidants. Nutrition and Athletic Performance. American College of Sports Medicine.Medicine & Science in Sports & Exercise. 2016; 48(3), 543- 568.  https://journals.lww.com/acsm-msse/Fulltext/2016/03000/Nutrition_and_Athletic_Performance.25.aspx. Accessed March 17, 2018.

Common Nutrient Deficiencies for Athletes

Energy deficiency

For athletes, consuming sufficient amounts of calories to support their energy expenditure is vital to maintain health and body functions. When the energy intake for athletes does not meet the high demands of exercise, a syndrome referred to as relative deficiency in sport (RED-S) occurs. RED-S has a negative effect on performance and health in both male and female athletes as shown in Table 16.7 “Relative Energy Deficiency in Sport Effects”. Athletes in sports with weight classes, such as wrestling, may put their health at risk by rapid weight loss in order to hit a specific weight for a match. These athletes are vulnerable to eating disorders due to sporadic dieting (several of which will restrict energy intake). The long term effects of these practices can not only impair performance but also have serious repercussions such as heart and kidney function, temperature regulation and electrolyte balance problems.

Figure 16.7 Relative Energy Deficiency in Sport Effects

Of the RED-S consequences that occur from an energy intake deficiency, the two health effects that are of the greatest concern to female athletes are menstrual dysfunction and decreased bone density. Menstrual dysfunction and low bone density symptoms of RED-S can create hormonal imbalances that are described in “Figure 16.8 The Female Athlete Triad”. In today’s society, there is increasing pressure to be extremely thin that some females take exercise too far. The low energy intakes will lead to the female athlete triad that causes bone loss, stoppage of menstrual periods, and eating disorders.The Female Athlete Triad. American College of Sports Medicine. http://www.acsm.org/public-information/articles/2016/10/07/the-female-athlete-triad. Published October 7, 2016. Accessed March 16, 2018.

Figure 16.8 The Female Athlete Triad

Image by Allison Calabrese / CC BY 4.0

Iron

Iron deficiency is very common in athletes. During exercise, iron-containing proteins like hemoglobin and myoglobin are needed in great amounts. An iron deficiency can impair muscle function to limit work capacity leading to compromised training performance. Some athletes in intense training may have an increase in iron losses through sweat, urine, and feces. Iron losses are greater in females than males due to the iron lost in blood every menstrual cycle. Female athletes, distance runners and vegetarians are at the greatest risk for developing iron deficiency.Beard J, Tobin B. Iron Status and Exercise. The American Journal of Clinical Nutrition. 2000; 72(2), 594S–597S. https://academic.oup.com/ajcn/article/72/2/594S/4729672. Accessed March 16, 2018. See Table 16.3 “The Potential Iron Loss in Endurance Athletes” for the potential amounts of iron loss each day in male and female athletes. An increased recommendation for both genders are shown below. These recommendations are based on the assumption that iron has a 10%  absorption efficiency. As noted above, women athletes have a greater iron loss due to menstruation and therefore must increase their dietary needs more than male athletes.

Table 16.3 The Potential Iron Loss in Endurance Athletes


Approximate Daily Iron Losses in Endurance Athletes (mg/day)and Increased Dietary Need
Male Female
Sedentary 1 1.5
Athlete 1.8 2.5
*Increase dietary needs 8 10
*Assumes 10% absorption efficiency

Source: Weaver CM, Rajaram S.Exercise and iron status. J Nutr. 1992 Mar;122(3 Suppl):782-7. https://www.ncbi.nlm.nih.gov/pubmed/1542048. Accessed March 23, 2018.

Sports anemia, which is different from iron deficiency anemia is an adaptation to training for athletes. Excessive training causes the blood volume to expand in order to increase the amount of oxygen delivered to the muscles. During sports anemia, the synthesis of red blood cells lags behind the increase in blood volume which results in a decreased percentage of blood volume that is red blood cells. The total amount of red blood cells remains the same or may increase slightly to continue the transport of oxygen. Eventually as training progresses, the amount of red blood cells will increase to catch up with the total blood volume.

Vitamin D and Calcium

Vitamin D regulates the calcium and phosphorus absorption and metabolism and plays a key role in maintaining optimal bone health. There is also growing evidence that vitamin D is important for other aspect of athletic performance such as injury prevention, rehabilitation, and muscle metabolism. Individuals who primarily practice indoors are at a larger risk for a vitamin D deficiency and should ensure they are consuming foods high in vitamin D to maintain sufficient vitamin D status.Nutrition and Athletic Performance. American College of Sports Medicine.Medicine & Science in Sports & Exercise. 2016; 48(3), 543- 568.  https://journals.lww.com/acsm-msse/Fulltext/2016/03000/Nutrition_and_Athletic_Performance.25.aspx. Accessed March 17, 2018.

Calcium is especially important for the growth, maintenance, and repair of bone tissue. Low calcium intake occurs in athletes with RED-S, menstrual dysfunction, and those who avoid dairy products. A diet inadequate in calcium increases the risk for low bone mineral density  which ultimately leads to stress fractures.

Antioxidant nutrients

Antioxidant nutrients play an important role in protecting cell membranes from oxidative damage. During exercise, the amount of oxygen used by the muscles increases and can produce free radicals which causes an increase in antioxidant systems in the the body. These antioxidant systems rely on the dietary antioxidants such as beta-carotene, vitamin C, vitamin E, and selenium that can be obtained through a nutrient dense diet.


Water and Electrolyte Needs

During exercise, being appropriately hydrated contributes to performance. Water is needed to cool the body, transport oxygen and nutrients, and remove waste products from the muscles.  Water needs are increased during exercise due to the extra water losses through evaporation and sweat. Dehydration can occur when there is inadequate water levels in the body and can be very hazardous to the health of an individual. As the severity of dehydration increases, the exercise performance of an individual will begin to decline (see Figure 16.9 “Dehydration Effect on Exercise Performance”). It is important to continue to consume water before, during and after exercise to avoid dehydration as much as possible.

Figure 16.9 Dehydration Effect on Exercise Performance

Image by Allison Calabrese / CC BY 4.0

During exercise, thirst is not a reliable short term indicator of the body’s needs as it typically is not enough to replace the water loss. Even with the constant replenishing of water throughout an exercise, it may not be possible to drink enough water to compensate for the losses. Dehydration occurs when the total loss of water is so significant that the total blood volume decreases which leads to the reduction of oxygen and nutrients transported to the muscle cells. A decreased blood volume also reduces the blood flow to the skin and the production of sweat which can increase the body temperature. As a result, the risk of heat related illnesses increases.

Heat cramps are one of the heat related illnesses that can occur during or after exercise. Heat cramps are involuntary muscle spasms that usually involve the muscle being exercised, which causes by an imbalance of electrolytes, usually sodium.  Heat exhaustion is caused the the loss of water decreasing the blood volume so much that it is not possible to cool the body as well as provide oxygen and nutrients to the active muscles. Symptoms that arise from heat exhaustion may include low blood pressure, disorientation, profuse sweating, and fainting. Heat exhaustion can progress further if exercise continues into a heat stroke.  A heat stroke is the most serious form of heat related illnesses that can occur. During a heat stroke, the internal body temperature rises above 105℉ which causes the brain’s temperature-regulatory center to shut down. When the brain’s temperature regulatory center shuts down, an individual is unable to sweat regardless of their internal body temperature rising. Other symptoms that arise are dry skin, extreme confusion, and unconsciousness. A heat stroke requires immediate medical attention.

The external temperature during exercise can also play a role in the risk of heat related illnesses.  As the external temperature increases, it becomes more difficult for the body to dissipate heat. As humidity also increases, the body is unable to cool itself through evaporation. The Heat Index is a measure of how hot the body feels when humidity is added to the air temperature (see Figure 16.10 “The Heat Index”).

Figure 16.10 The Heat Index

“Heat Index” by National Weather Service, Southern Region Headquarters / Public Domain

Hyponatremia

Sweating during exercise helps our bodies to stay cool. Sweat consists of mostly water but it also causes losses of sodium, potassium, calcium and magnesium. During most exercises, the amount of sodium lost is very small.Drinking water after completing an exercise will replenish the sodium in the body. However, during long endurance exercises such as a marathon or triathlon, sodium losses are larger and must be replenished as well. If water is replenished without sodium the sodium already in the body will become diluted. These low levels of sodium in the blood will cause a condition known as hyponatremia (see Figure 16.11 “The Effect of Exercise on Sodium Levels”). When sodium levels in the blood are decreased, water moves into the cell through osmosis which causes swelling. Accumulation of fluid in the lungs and the brain can cause serious life threatening conditions such as a seizure, coma and death.

In order to avoid hyponatremia, athletes should increase their consumption of sodium in the days leading up to an event and consume sodium-containing sports drinks during their race or game. The early signs of hyponatremia include nausea, muscle cramps, disorientation, and slurred speech.  To learn more about the sports drinks that can optimize your performance, refer back to Chapter 3, Water and Electrolytes.

Figure 16.11 The Effect of Exercise on Sodium Levels

Food Supplements and Food Replacements

Current trends also include the use of supplementation to promote health and wellness. Vitamins, minerals, herbal remedies, and supplements of all kinds constitute big business and many of their advertising claims suggest that optimal health and eternal youth are just a pill away. Dietary supplements can be macronutrient (amino acids, proteins, essential fatty acids), micronutrient (vitamins and minerals that promote healthy body functions), probiotic (beneficial bacteria such as the kind found in the intestines), and herbally ( often target a specific body part, such as bones) based.

Some public health officials recommend a daily multivitamin due to the poor diet of most North Americans. The US Preventive Task Force also recommends a level of folate intake which can be easier to achieve with a supplement. In addition, the following people may benefit from taking daily vitamin and mineral supplements:Nutrition and Athletic Performance. American College of Sports Medicine.Medicine & Science in Sports & Exercise. 2016; 48(3), 543- 568.  https://journals.lww.com/acsm-msse/Fulltext/2016/03000/Nutrition_and_Athletic_Performance.25.aspx. Accessed March 17, 2018.

However, before you begin using dietary supplementation, consider that the word supplement denotes something being added. Vitamins, minerals, and other assorted remedies should be considered as extras. They are add-ons—not replacements—for a healthy diet. As food naturally contains nutrients in its proper package, remember that food should always be your primary source of nutrients. When considering taking supplements, it is important to recognize possible drawbacks that are specific to each kind:Choosing a Vitamin and Mineral Supplement—Topic Overview. WebMD.com. http://www.webmd.com/food-recipes/tc/choosing-a-vitamin -and-mineral-supplement-topic-overview. Last revised March 11, 2018.

Supplement Claims and Restrictions

The Food and Drug Administration (FDA) regulates supplements, but it treats them like food rather than pharmaceuticals. Dietary supplements must meet the FDA’s Good Manufacturing Standards, but are not required to meet the standards for drugs, although some companies do so voluntarily. Also, although supplement manufacturers are allowed to say a particular ingredient may reduce the risk of a disease or disorder, or that it might specifically target certain body systems, these claims are not approved by the FDA. This is why labels that make structural and functional claims are required to carry a disclaimer saying the product is not intended “to diagnose, treat, cure, or prevent any disease.” In addition, in the United States, supplements are taken off the market only after the FDA has proven that they are hazardous.Watson S. How to Evaluate Vitamins and Supplements. WebMD.com. http://www.webmd.com/vitamins-and-supplements/lifestyle-guide -11/how-to-evaluate-vitamins-supplements. Accessed March 11, 2018. To revisit the topic of structural and functional claims refer back to Chapter 12 “Nutrition Applications”.

Before Taking Supplements

The phrase caveat emptor means “buyer beware,” and it is important to keep the term in mind when considering supplementation. Just because a product is “natural” does not mean it can’t be harmful or dangerous, particularly if used inappropriately. The following are helpful questions to explore before deciding to take a supplement:

Lastly, please remember that a supplement is only as good as the diet that accompanies it. We cannot overstate the importance of eating a healthy, well-balanced diet designed to provide all of the necessary nutrients. Food contains many more beneficial substances, such as phytochemicals and fiber, that promote good health and cannot be duplicated with a pill or a regimen of supplements. Therefore, vitamins and other dietary supplements should never be a substitute for food. Nutrients should always be derived from food first.

Food: The Best Medicine

Poor dietary choices and a sedentary lifestyle account for about 300–600 thousand deaths every year according to the US Department of Health and Human Services. That number is thirteen times higher than the deaths due to gun violence.Why Good Nutrition Is Important. CSPINET.org. http://www.cspinet.org/nutritionpolicy/nutrition_policy.html. Accessed March 9, 2018. The typical North American diet is too high in saturated fat, sodium, and sugar, and too low in fiber in the form of whole fruits, vegetables, and whole grains to keep people healthy. With so many threats to optimal health it is vital to address those factors that are under your control, namely dietary and lifestyle choices. A diet that supplies your body with the needed energy and nutrients daily will result in efficient body functioning and in protection from disease. Making sound nutritional choices can also provide support for individuals undergoing treatment for short-term or chronic conditions. Finding a balance between nutritional needs with concerns about drug interactions can hasten recovery, improve quality of life, and minimize the side effects from treatment protocols.


XVII

Chapter 17. Food Safety

Introduction

Ka lepo ke kumu wai, e hua‘i ana ka lepo kai

When the source of water is dirty, the dirt is carried to the sea.


Image by Maarten Van de Heuvel on unsplash.com / CCO

Learning Objectives

By the end of this chapter you will be able to:

  • Describe the major types and causes of foodborne illness and contamination
  • Describe the purpose and process of food irradiation
  • Describe consumer-level techniques for avoiding foodborne illness

Foodborne Illness and Food Safety

Foodborne illness is a serious threat to health. Sometimes called “food poisoning,” foodborne illness is a common public health problem that can result from exposure to a pathogen or a toxin via food or beverages. Raw foods, such as seafood, produce, and meats, can all be contaminated during harvest (or slaughter for meats), processing, packaging, or during distribution, though meat and poultry are the most common source of foodborne illness. For all kinds of food, contamination also can occur during preparation and cooking in a home kitchen or in a restaurant. For example in 2009, the Marshall Islands reported 174 cases  presenting with vomiting and diarrhea. After an epidemiological investigation was completed, they identified the cause to be egg sandwiches that had been left at room temperature too long resulting in the growth of foodborne toxins in the egg sandwiches.Thein CC, Trinidad RM, Pavlin B. A Large Foodborne Outbreak on a Small Pacific Island. Pacific Health Dialogue. 2010, 16(1). https://www.ncbi.nlm.nih.gov/pubmed/20968238. Accessed January 28, 2018.   

In many developing nations, contaminated water is also a major source of foodborne illness. Many people are affected by foodborne illness each year, making food safety a very important issue. Annually, one out of six Americans becomes sick after consuming contaminated foods or beverages.Foodborne Illnesses and Germs. Centers for Disease Control and Prevention.https://www.cdc.gov/foodsafety/foodborne-germs.html . Updated January 23, 2018. Accessed January 28, 2017. Foodborne illness can range from mild stomach upset to severe symptoms, or even fatalities. The problem of food contamination can not only be dangerous to your health, it can also be harmful to your wallet. Medical costs and lost wages due to salmonellosis, just one foodborne disease, are estimated at over $1 billion per year.

At-Risk Groups

No one is immune from consuming contaminated food but, whether you become seriously ill depends on the microorganism, the amount you have consumed, and your overall health. In addition, some groups have a higher risk than others for developing severe complications to foodborne disease. Who is most at risk? Young children, elderly people, and pregnant women all have a higher chance of becoming very sick after consuming contaminated food. Other high-risk groups include people with compromised immune systems due to HIV/AIDS, immunosuppressive medications (such as after an organ transplant), and long-term steroid use for asthma or arthritis. Exposure to contaminated food could also pose problems for diabetics, cancer patients, people who have liver disease, and people who have stomach problems as a result of low stomach acid or previous stomach surgery. People in all of these groups should handle food carefully, make sure that what they eat has been cooked thoroughly, and avoid taking any chances that could lead to exposure.

The Major Types of Foodborne Illness

Foodborne illnesses are either infectious or toxic in nature. The difference depends on the agent that causes the condition. Microbes, such as bacteria, cause food infections, while toxins, such as the kind produced by molds, cause intoxications. Different diseases manifest in different ways, so signs and symptoms can vary with the source of contamination. However the illness occurs, the microbe or toxin enters the body through the gastrointestinal tract, and as a result common symptoms include diarrhea, nausea, and abdominal pain. Additional symptoms may include vomiting, dehydration, lightheadedness, and rapid heartbeat. More severe complications can include a high fever, diarrhea that lasts more than three days, prolonged vomiting, bloody stools, and signs of shock.

One of the biggest misconceptions about foodborne illness is that it is always triggered by the last meal that a person ate. However, it may take several days or more before the onset of symptoms. If you develop a foodborne illness, you should rest and drink plenty of fluids. Avoid antidiarrheal medications, because they could slow the elimination of the contaminant.

Food Infection

According to the CDC, more than 250 different foodborne diseases have been identified.Foodborne Illnesses and Germs. Centers for Disease Control and Prevention.https://www.cdc.gov/foodsafety/foodborne-germs.html . Updated January 23, 2018. Accessed January 28, 2017. Majority of these diseases are food infections, which means they are caused from food contaminated by microorganisms, such as bacteria, by microscopic animals called parasites, or by viruses. The infection then grows inside the body and becomes the source of symptoms. Food infections can be sporadic and often are not reported to physicians. However, occasional outbreaks occur that put communities, states and provinces, or even entire nations at risk. For example, in 1994, an outbreak of the infection salmonellosis occurred in the United States due to contaminated ice cream. An estimated 224,000 people became ill. In 1988, contaminated clams resulted in an outbreak of hepatitis A in China, which affected about 300,000 people.Food Safety. World Health Organization. http://www.who.int/mediacentre/factsheets/fs399/en/. Updated October 2017. Accessed January 18, 2018.

The Reproduction of Microorganisms

Bacteria, one of the most common agents of food infection, are single-celled microorganisms that are too small to be seen with the human eye. Microbes live, die, and reproduce, and like all living creatures, they depend on certain conditions to survive and thrive. In order to reproduce within food, microorganisms require the following:

Food Intoxication

Other kinds of foodborne illness are food intoxications, which are caused by natural toxins or harmful chemicals. These and other unspecified agents are major contributors to episodes of acute gastroenteritis and other kinds of foodborne illness.Scallan E, Griffin PM, Angulo FJ, et al. Foodborne Illness Acquired in the United States—Unspecified Agents. Emerging Infectious Diseases. 2011;17(1):16-22. https://wwwnc.cdc.gov/eid/article/17/1/p2-1101_article. Accessed January 28, 2018. Like pathogens, toxins and chemicals can be introduced to food during cultivation, harvesting, processing, or distribution. Some toxins can lead to symptoms that are also common to food infection, such as abdominal cramping, while others can cause different kinds of symptoms and complications, some very severe. For example, mercury, which is sometimes found in fish, can cause neurological damage in infants and children. Exposure to cadmium can cause kidney damage, typically in elderly people.

The Causes of Food Contamination


Both food infections and food intoxications can create a burden on health systems, when patients require treatment and support, and on food systems, when companies must recall contaminated food or address public concerns. It all begins with the agent that causes the contamination. When a person ingests a food contaminant, it travels to the stomach and intestines. There, it can interfere with the body’s functions and make you sick. In the next part, we will focus on different types of food contaminants and examine common microbes, toxins, chemicals, and other substances that can cause food infections and intoxications. Let’s begin with pathogens, which include bacteria and viruses. About one hundred years ago, typhoid fever, tuberculosis, and cholera were common diseases caused by food and water contaminated by pathogens. Over time, improvements in food processing and water treatment eliminated most of those problems in North America. Today, other bacteria and viruses have become common causes of food infection.

Bacteria

All foods naturally contain small amounts of bacteria. However, poor handling and preparation of food, along with improper cooking or storage can multiply bacteria and cause illness. In addition, bacteria can multiply quickly when cooked food is left out at room temperature for more than a few hours. Most bacteria grow undetected because they do not change the color or texture of food or produce a bad odor. Freezing and refrigeration slow or stop the growth of bacteria, but does not destroy the bacteria completely. The microbes can reactivate when the food is taken out and thawed.

Salmonella virus

Image by NIH NIAID / CC BY 2.0


Many different kinds of bacteria can lead to food infections. One of the most common is Salmonella, which is found in the intestines of birds, reptiles, and mammals. Salmonella can spread to humans via a variety of different animal-origin foods, including meats, poultry, eggs, dairy products, and seafood. The disease it causes, salmonellosis, typically brings about fever, diarrhea, and abdominal cramps within twelve to seventy-two hours after eating. Usually, the illness lasts four to seven days, and most people recover without treatment. However, in individuals with weakened immune systems, Salmonella can invade the bloodstream and lead to life-threatening complications, such as a high fever and severe diarrhea.Salmonella. Centers for Disease Control and Prevention. http://www.cdc.gov/salmonella/. Updated January 24, 2018. Accessed January 29, 2018.

The bacterium Listeria monocytogenes is found in soft cheeses, unpasteurized milk, meat, and seafood. It causes a disease called listeriosis that can bring about fever, headache, nausea, and vomiting. Listeria monocytogenes mostly affects pregnant women, newborns, older adults, and people with cancer and compromised immune systems.

The food infection by Escherichia coli is found in raw or undercooked meat, raw vegetables, unpasteurized milk, minimally processed ciders and juices, and contaminated drinking water. Symptoms can occur a few days after eating, and include watery and bloody diarrhea, severe stomach cramps, and dehydration. More severe complications may include colitis, neurological symptoms, stroke, and hemolytic uremic syndrome. In young children, an E. coli infection can cause kidney failure and death.

The bacterium Clostridium botulinum causes botulism. Sources include improperly canned foods, lunch meats, and garlic. An infected person may experience symptoms within four to thirty-six hours after eating. Symptoms could include nerve dysfunction, such as double vision, inability to swallow, speech difficulty, and progressive paralysis of the respiratory system. Botulism can also be fatal.

Campylobacter jejuni causes the disease campylobacteriosis. It is the most commonly identified bacterial cause of diarrhea worldwide. Consuming undercooked chicken, or food contaminated with the juices of raw chicken, is the most frequent source of this infection. Other sources include raw meat and unpasteurized milk. Within two to five days after consumption, symptoms can begin and include diarrhea, stomach cramps, fever, and bloody stools. The duration of this disease is about seven to ten days.

The food infection shigellosis is caused by Shigella, of which there are several types. Sources include undercooked liquid or moist food that has been handled by an infected person. The onset of symptoms occurs one to seven days after eating, and can include stomach cramps, diarrhea, fever, and vomiting. Another common symptom is blood, pus, or mucus in stool. Once a person has had shigellosis, the individual is not likely to get infected with that specific type again for at least several years. However, they can still become infected with other types of Shigella.

Staphylococcus aureus causes staphylococcal food poisoning. Food workers who carry this kind of bacteria and handle food without washing their hands can cause contamination. Other sources include meat and poultry, egg products, cream-filled pastries, tuna, potato and macaroni salad, and foods left unrefrigerated for long periods of time. Symptoms can begin thirty minutes to eight hours after eating, and include diarrhea, vomiting, nausea, stomach pain, and cramps. This food infection usually lasts one to two days.

Found in raw oysters and other kinds of seafood, Vibrio vulnificus belongs to the same family as the bacteria which cause cholera. This food contaminant can result in the Vibrio infection. Symptoms can begin anywhere from six hours to a few days after consumption, and include chills, fever, nausea, and vomiting. This disease is very dangerous and can result in fatalities, especially in people with underlying health problems.Foodborne Illnesses and Germs. Centers for Disease Control and Prevention.https://www.cdc.gov/foodsafety/foodborne-germs.html . Updated January 23, 2018. Accessed January 28, 2017.

Virus

Viruses are another type of pathogen that can lead to food infections, however they are less predominant than bacteria. Viruses differ from bacteria in that they cannot grow and reproduce in foods. Instead, viruses that cause human diseases can only reproduce inside human cells (see Figure 15.1 “Viruses in the Human Body”). Hepatitis A is one of the more well-known food-contaminating viruses. Sources include raw shellfish from polluted water, and food handled by an infected person. This virus can go undetected for weeks and, on average, symptoms do not appear until about one month after exposure. At first, symptoms include malaise, loss of appetite, nausea, vomiting, and fever. Three to ten days later, additional symptoms can manifest, including jaundice and darkened urine. Severe cases of a hepatitis A can result in liver damage and death.

The most common form of contamination from handled foods is the norovirus, which is also known as the Norwalk-like virus, or the calicivirus. Sources include raw shellfish from polluted water, salads, sandwiches, and other ready-to-eat foods handled by an infected person. The norovirus causes gastroenteritis and within one to three days it leads to symptoms, such as nausea, vomiting, diarrhea, stomach pain, headache, and a low-grade fever.Foodborne Illnesses and Germs. Centers for Disease Control and Prevention.https://www.cdc.gov/foodsafety/foodborne-germs.html . Updated January 23, 2018. Accessed January 28, 2017.

Figure 17.1 Viruses in the Human Body

Parasitic Protozoa

Food-contaminating parasitic protozoa are microscopic organisms that may be spread in food and water. Several of these creatures pose major problems to food production worldwide. They include Anisakis, microscopic worms that invade the stomach or the intestines. Sources of this parasite include raw fish. This parasite can result in the Anisakis infection, with symptoms that begin within a day or less and include abdominal pain, which can be severe.

Cryptosporidium lives in the intestines of infected animals. Another common source is drinking water, when heavy rains wash animal wastes into reservoirs. One major problem with this pathogen is that it is extremely resistant to disinfection with chlorine. Cryptosporidium causes the disease cryptosporidiosis, with symptoms that begin one to twelve days after exposure and include watery stools, loss of appetite, vomiting, a low-grade fever, abdominal cramps, and diarrhea. For HIV/AIDS patients and others with weakened immune systems, the disease can be severe, and sometimes can lead to death.

Giardia lamblia is another parasite that is found in contaminated drinking water. In addition, it lives in the intestinal tracts of animals, and can wash into surface water and reservoirs, similar to Cryptosporidium. Giardia causes giardiasis, with symptoms that include abdominal cramping and diarrhea within one to three days. Although most people recover within one to two weeks, the disease can lead to a chronic condition, especially in people with compromised immune systems.

The parasite Toxoplasma gondii causes the infection toxoplasmosis, which is a leading cause of death attributed to foodborne illness in the United States. More than sixty million Americans carry Toxoplasma gondii, but very few have symptoms. Typically, the body’s immune system keeps the parasite from causing disease. Sources include raw or undercooked meat and unwashed fruits and vegetables. Handling the feces of a cat with an acute infection can also lead to the disease.Centers for Disease Control and Prevention. “Parasites.” Last updated November 2, 2010. http://www.cdc.gov/parasites/food.html.

Mold Toxins

Mold can grow on fruits, vegetables, grains, meats, poultry, and dairy products, and typically appears as gray or green “fur.”

Mold growing on oranges

Moldy nectarines by Roger McLassus 1951 / CC BY-SA 3.0

Warm, humid, or damp conditions encourage mold to grow on food. Molds are microscopic fungi that live on animals and plants. No one knows how many species of fungi exist, but estimates range from ten- to three-hundred thousand. Unlike single-celled bacteria, molds are multicellular, and under a microscope look like slender mushrooms. They have stalks with spores that form at the ends. The spores give molds their color and can be transported by air, water, or insects. Spores also enable mold to reproduce. Additionally, molds have root-like threads that may grow deep into food and be difficult to see. The threads are very deep when a food shows heavy mold growth. Foods that contain mold may also have bacteria growing alongside it.

Some molds, like the kind found in blue cheese, are desirable in foods, while other molds can be dangerous. The spores of some molds can cause allergic reactions and respiratory problems. In the right conditions, a few molds produce mycotoxins, which are natural, poisonous substances that can make you sick if they are consumed. Mycotoxins are contained in and around mold threads, and in some cases, may have spread throughout the food. The Food and Agriculture Organization of the United Nations estimates that mycotoxins affect 25 percent of the world’s food crops. They are found primarily in grains and nuts, but other sources include apples, celery, and other produce.

The most dangerous mycotoxins are aflatoxins, which are produced by strains of fungi called Aspergillus under certain temperature and humidity conditions. Contamination has occurred in peanuts, tree nuts, and corn. Aflatoxins can cause aflatoxicosis in humans, livestock, and domestic animals. Symptoms include vomiting and abdominal pain. Possible complications include liver failure, liver cancer, and even death. Many countries try to limit exposure to aflatoxins by monitoring their presence on food and feed products.Molds on Food: Are They Dangerous?. US Department of Agriculture, Food Safety and Inspection Service. https://www.fsis.usda.gov/wps/portal/fsis/topics/food-safety-education/get-answers/food-safety-fact-sheets/safe-food-handling/molds-on-food-are-they-dangerous_/ct_index. Updated August 22, 2013. Accessed January 2018.

Poisonous Mushrooms

Amanita Muscaria by Onder Wijsgek / CC BY 3.0

Like molds, mushrooms are fungi and the poisonous kind produces mycotoxins that can cause food intoxication. Toxic mushrooms, also known as toadstools, can cause severe vomiting and other symptoms. However, only a few varieties are fatal. Toxic mushrooms cannot be made safe by cooking, freezing, canning, or processing. The only way to avoid food intoxication is to refrain from eating them. Mushroom guides can help wild gatherers distinguish between the edible and toxic kindsUS Department of Agriculture, Food Safety and Inspection Service. “Molds on Food: Are They Dangerous?” Last modified March 4, 2010. http://www.fsis.usda.gov/FactSheets/Molds_On_Food/..

Pesticides

Pesticides are important in food production to control diseases, insects, and other pests. They protect crops and ensure a large yield. However, synthetic pesticides can leave behind residues, particularly on produce, that can be harmful to human health. Foods that contain the highest levels of pesticide residue include conventionally-grown peaches, apples, bell peppers, celery, nectarines, strawberries, cherries, pears, spinach, lettuce, and potatoes. Foods that contain the lowest levels of pesticide residue include avocados, pineapples, bananas, mangoes, asparagus, cabbage, and broccoli.Pesticide Residues in Food. World Health Organization. http://www.who.int/mediacentre/factsheets/pesticide-residues-food/en/. Updated January 2018. Accessed January 28, 2018. In many cases, the amount of pesticide exposure is too small to pose a risk. However, harmful exposures can lead to certain health problems and complications, including cancer. Also, infants and young children are more susceptible to the hazards of pesticides than adults. In addition, using synthetic pesticides, herbicides, and fertilizers contributes to soil and water pollution and can be hazardous to farm workers.

To protect the public and their workers, many farmers now rely on alternatives to synthetic pesticide use, including crop rotation, natural pesticides, and planting non food crops nearby to lure pests away. Some consumers choose to reduce their exposure to pesticides by purchasing organic produce. Organic foods are grown or produced without synthetic pesticides or fertilizer, and all growers and processors must be certified by the US Department of Agriculture (USDA). However, conventionally-grown produce should be fine for fruits and vegetables that appear on the low-residue list.

Pollutants

Pollutants are another kind of chemical contaminant that can make food harmful. Chemical runoff from factories can pollute food products and drinking water. For example, dioxins are chemical compounds created in industrial processes, such as manufacturing and bleaching pulp and paper. Fish that swim in dioxin-polluted waters can contain significant amounts of this pollutant, which causes cancer. When metals contaminate food, it can result in serious and even life-threatening health problems. A common metal contaminant is lead, which can be present in drinking water, soil, and air. Lead exposure most often affects children, who can suffer from physical and mental developmental delays as a result.

Methyl mercury occurs naturally in the environment and is also produced by human activities. Fish can absorb it, and the predatory fish that consume smaller, contaminated fish can have very high levels. This highly toxic chemical can cause mercury poisoning, which leads to developmental problems in children, as well as autoimmune effects. A condition called Minamata disease was identified in 1956 in Japan. It was named for the town of Minamata, which was the site of an environmental disaster when methyl mercury was released into the surface water near a factory. Many residents experienced neurological issues, including numbness in hands and feet, muscle weakness, a narrowing of the field of vision, damage to hearing and speech, and ataxia, which is a lack of muscle coordination.Minamata Disease: The History and Measures. Ministry of the Environment, Government of Japan.http://www.env.go.jp/en/chemi/hs/minamata2002/. Published 2002. Accessed December 21, 2011.

PCBs, or polychlorinated biphenyls, are man-made organic compounds that consists of carbon, hydrogen and chlorine. Due to their non-flammability, chemically stable, and high boiling points PCBs were manufactured and used commercially from 1929 until 1979 when it was banned. Like methylmercury, higher concentrations of this contaminant are found in predatory fish. Health effects include complications in physical and neurological development in children, and this compound is potentially a carcinogen. PCB contamination also can affect the immune, reproductive, nervous, and endocrine systems.Learn About Polychlorinated Biphenyls. US Environmental Protection Agency. https://www.epa.gov/pcbs/learn-about-polychlorinated-biphenyls-pcbs. Updated August 10, 2017. Accessed January 28, 2018.

Protecting the Public Health

Most foodborne infections go unreported and undiagnosed. However, the CDC estimates that about seventy-six million people in the United States become ill from foodborne pathogens or other agents every year. In North America, a number of government agencies work to educate the public about food infections and intoxications, prevent the spread of disease, and quell any major problems or outbreaks. They include the CDC, the FDA, and the USDA, among other organizations.

Efforts on the Governmental Level

A number of government agencies work to ensure food safety and to protect the public from foodborne illness. Food regulatory agencies work to protect the consumer and ensure the safety of our food. Food and drug regulation in the United States began in the late nineteenth century when state and local governments began to enact regulatory policies. In 1906, Congress passed the Pure Food and Drugs Act, which led to the creation of the US Food and Drug Administration (FDA). Today, a number of agencies are in charge of monitoring how food is produced, processed, and packaged.History of Food and Drug Regulation in the United States. EH.Net Encyclopedia. http://eh.net/?s=History+of+Food+and+Drug+Regulation+in+the+United+States. Published February 4, 2010. Accessed January 28, 2018. 

The USDA and the FDA enforce laws regarding the safety of domestic and imported food. In addition, the Federal Food, Drug, and Cosmetic Act of 1938 gives the FDA authority over food ingredients. The FDA enforces the safety of domestic and imported foods. It also monitors supplements, food labels, claims that corporations make about the benefits of products, and pharmaceutical drugs. Sometimes, the FDA must recall contaminated foods and remove them from the market to protect public health. For example, in 2011 contaminated peanut butter led to the recall of thousands of jars of a few popular brands.FDA 101: Product Recalls—From First Alert to Effectiveness Checks. US Food and Drug Administration. http://www.fda.gov/ForConsumers/ConsumerUpdates/ucm049070.htm. Updated September 9, 2011. Accessed January 18, 2018.  Recalls are almost always voluntary and often are requested by companies after a problem has been discovered. In rare cases, the FDA will request a recall. But no matter what triggers the removal of a product, the FDA’s role is to oversee the strategy and assess the adequacy and effectiveness of the recall.

Many consumers have concerns about safety practices during the production and distribution of food. This is especially critical given recent outbreaks of foodborne illnesses. For example, during fall 2011 in the United States, there was an eruption of the bacteria Listeria monocytogenes in cantaloupe. It was one of the deadliest outbreaks in over a decade and resulted in a number of deaths and hospitalizations.Centers for Disease Control and Prevention. “Multistate Outbreak of Listeriosis Associated with Jensen Farms Cantaloupe—United States.” August–September, 2011. http://www.cdc.gov/mmwr/preview/mmwrhtml/mm6039a5.htm?s_cid= mm6039a5_w. In January 2011, the Food Safety Modernization Act was passed to grant more authority to the FDA to improve food safety. The FDA and other agencies also address consumer-related concerns about protecting the nation’s food supply in the event of a terrorist attack.

The USDA headed by the Secretary of Agriculture, develops and executes federal policy on farming and food. This agency supports farmers and ranchers, protects natural resources, promotes trade, and seeks to end hunger in the United States and abroad. The USDA also assures food safety, and in particular oversees the regulation of meat, poultry, and processed egg products. The CDC tracks outbreaks, identifies the causes of food infection and intoxication, and recommends ways to prevent foodborne illness. Other government agencies that play a role in protecting the public include the Food Safety and Inspection Service, a division of the USDA, which enforces laws regulating meat and poultry safety. The Agricultural Research Service, which is the research arm of the USDA, investigates a number of agricultural practices, including those related to animal and crop safety. The National Institute of Food and Agriculture conducts research and education programs on food safety for farmers and consumers.

The Environmental Protection Agency (EPA) works to protect human health and the environment. Founded in 1970, the agency conducts environmental assessment, education, research, and regulation. The EPA also works to prevent pollution and protect natural resources. Two of its many regulatory practices in the area of agriculture include overseeing water quality and the use of pesticides.The EPA approves pesticides and other chemicals used in agriculture, and sets limits on how much residue can remain on food. The FDA analyzes food for surface residue and waxes. Processing methods can either reduce or concentrate pesticide residue in foods. Therefore, the Food Quality Protection Act, which was passed in 1996, requires manufacturers to show that pesticide levels are safe for children.

Efforts within the Food Industry

The Hazard Analysis Critical Control Points (HACCP) is a program within the food industry designed to promote food safety and prevent contamination by identifying all areas in food production and retail where contamination could occur. Companies and retailers determine the points during processing, packaging, shipping, or shelving where potential contamination may occur.. Those companies or retailers must then establish critical control points to prevent, control, or eliminate the potential for food contamination. The USDA requires the food industry to follow HACCP for meat and poultry, while the FDA requires it for seafood, low-acid canned-food, and juice. HACCP is voluntary for all other food products but its main goal is to prevent contamination at all costs.


Everyday Connection

The Seven Steps to HACCP:
  1. Conduct a hazard analysis: The manufacturer must first determine any food safety hazards (ex. biological, chemicals, or physical) and identify preventative measures to control the hazards.
  2. Identify the critical control points: Critical control point (CCP) is a point or procedure in food manufacturing where control can be applied to prevent or eliminate food hazards that may cause the food to be unsafe.
  3. Establish critical limits: A critical limit is the maximum or minimum value that a food hazard must be controlled at a CCP to prevent, eliminate or reduce it to an acceptable level.
  4. Establish monitoring requirements: The manufacture must establish procedures to monitor the control points to ensure the process is under control and not above the CCP.
  5. Establish corrective actions: Corrective actions are needed when monitoring indicates a deviation from the established critical limit to ensure that no produce injurious to health has occurred as a result of the deviation.
  6. Establish verification procedures: Verification ensures that the HACCP plan is adequate with CCP records, critical limits and microbial sampling and analysis.
  7. Record keeping procedure: The manufacturer must maintain certain documents including its hazard analysis, HACCP plan, and records monitoring the CCP, critical limits, and the verification of handling processed deviations.

For more information on the HACCP visit https://www.fsis.usda.gov/Oa/background/keyhaccp.htm.

Key Takeaways

Type your key takeaways here.

  • First
  • Second


The Food System

The food system is a network of farmers and related operations, including food processing, wholesale and distribution, retail, industry technology, and marketing. The milk industry, for example, includes everything from the farm that raises livestock, to the milking facility that extracts the product, to the processing company that pasteurizes milk and packages it into cartons, to the shipping company that delivers the product to stores, to the markets and groceries that stock and sell the product, to the advertising agency that touts the product to consumers. All of these components play a part in a very large system.

Two important aspects of a food system are preservation and processing. Each provides for or protects consumers in different ways. Food preservation includes the handling or treating of food to prevent or slow down spoilage. Food processing involves transforming raw ingredients into packaged food, from fresh-baked goods to frozen dinners. Although there are numerous benefits to both, preservation and processing also pose some concerns, in terms of both nutrition and sustainability.

Food Preservation

Food preservation protects consumers from harmful or toxic food. There are different ways to preserve food. Some are ancient methods that have been practiced for generations, such as curing, smoking, pickling, salting, fermenting, canning, and preserving fruit in the form of jam. Others include the use of modern techniques and technology, including drying, vacuum packing, pasteurization, and freezing and refrigeration. Preservation guards against foodborne illnesses, and also protects the flavor, color, moisture content, or nutritive value of food.

Food Irradiation: What You Need to Know

Irradiation does not make foods radioactive, compromise nutritional quality, or noticeably change the taste, texture, or appearance of food. In fact, any changes made by irradiation are so minimal that it is not easy to tell if a food has been irradiated.

Food irradiation (the application of ionizing radiation to food) is a technology that improves the safety and extends the shelf life of foods by reducing or eliminating microorganisms and insects. Like pasteurizing milk and canning fruits and vegetables, irradiation can make food safer for the consumer. The Food and Drug Administration (FDA) is responsible for regulating the sources of radiation that are used to irradiate food. The FDA approves a source of radiation for use on foods only after it has determined that irradiating the food is safe.

Why Irradiate Food?

Irradiation can serve many purposes.

How Is Food Irradiated?

There are three sources of radiation approved for use on foods.

Is Irradiated Food Safe to Eat?

The FDA has evaluated the safety of irradiated food for more than 30 years and has found the process to be safe. The World Health Organization (WHO), the Centers for Disease Control and Prevention (CDC) and the U.S. Department of Agriculture (USDA) have also endorsed the safety of irradiated food.

The FDA has approved a variety of foods for irradiation in the United States including:


How Will I Know if My Food Has Been Irradiated?

The FDA requires that irradiated foods bear the international symbol for irradiation. Look for the Radura symbol along with the statement “Treated with radiation” or “Treated by irradiation” on the food label. Bulk foods, such as fruits and vegetables, are required to be individually labeled or to have a label next to the sale container. The FDA does not require that individual ingredients in multi-ingredient foods (e.g., spices) be labeled. It is important to remember that irradiation is not a replacement for proper food handling practices by producers, processors, and consumers. Irradiated foods need to be stored, handled, and cooked in the same way as non-irradiated foods, because they could still become contaminated with disease-causing organisms after irradiation if the rules of basic food safety are not followed.Food Irradiation. U.S. Food and Drug Administration. https://www.fda.gov/food/resourcesforyou/consumers/ucm261680.htm. Updated January 4, 2018. Accessed January 18, 2018.

Food Processing

Food processing includes the methods and techniques used to transform raw ingredients into packaged food. Workers in this industry use harvested crops or slaughtered and butchered livestock to create products that are marketed to the public. There are different ways in which food can be processed, from a one-off product, such as a wedding cake, to a mass-produced product, such as a line of cupcakes packaged and sold in stores.

The Pros and Cons of Food Processing

Image by Dean Hochman / CC BY 2.0

Food processing has a number of important benefits, such as creating products that have a much longer shelf life than raw foods. Also, food processing protects the health of the consumer and allows for easier shipment and the marketing of foods by corporations. However, there are certain drawbacks. Food processing can reduce the nutritional content of raw ingredients. For example, canning involves the use of heat, which destroys the vitamin C in canned fruit. Also, certain food additives that are included during processing, such as high fructose corn syrup, can affect the health of a consumer. However, the level of added sugar can make a major difference. Small amounts of added sugar and other sweeteners, about 6 to 9 teaspoons a day or less, are not considered harmful.Sugar and Carbohydrates. American Heart Association. http://www.heart.org/HEARTORG/GettingHealthy/NutritionCenter/HealthyDietGoals/Sugars-and-Carbohydrates_UCM_303296_Article.jsp#. Updated April 20, 2017. Accessed January 4, 2018.

Food Additives

If you examine the label for a processed food product, it is not unusual to see a long list of added materials. These natural or synthetic substances are food additives and there are more than three hundred used during food processing today. The most popular additives are benzoates, nitrites, sulfites, and sorbates, which prevent molds and yeast from growing on food.The Dangers of Food Additives. How Stuff Works. http://health.howstuffworks.com/wellness/food-nutrition/facts/dangers-of-food -additives.htm. Accessed October 5, 2011. Food additives are introduced in the processing stage for a variety of reasons. Some control acidity and alkalinity, while others enhance the color or flavor of food. Some additives stabilize food and keep it from breaking down, while others add body or texture. Table 17.1 “Food Additives” lists some common food additives and their uses:

Table 17.1 Food Additives

Additive Reason for Adding
Beta-carotene Adds artificial coloring to food
Caffeine Acts as a stimulant
Citric acid Increases tartness to prevent food from becoming rancid
Dextrin Thickens gravies, sauces, and baking mixes
Gelatin Stabilizes, thickens, or texturizes food
Modified food starch Keeps ingredients from separating and prevents lumps
MSG Enhances flavor in a variety of foods
Pectin Gives candies and jams a gel-like texture
Polysorbates Blends oil and water and keep them from separating
Soy lecithin Emulsifies and stabilizes chocolate, margarine, and other items
Sulfites Prevent discoloration in dried fruits
Xanthan gum Thickens, emulsifies, and stabilizes dairy products and dressings

Source: Chemical Cuisine: Learn about Food Additives. Center for Science in the Public Interest.http://www.cspinet.org/reports/chemcuisine.htm. Published 2012. Accessed January 20, 2018.

The Pros and Cons of Food Additives

The FDA works to protect the public from potentially dangerous additives. Passed in 1958, the Food Additives Amendment states that a manufacturer is responsible for demonstrating the safety of an additive before it can be approved. The Delaney Clause that was added to this legislation prohibits the approval of any additive found to cause cancer in animals or humans. However, most additives are considered to be “generally recognized as safe,” a status that is determined by the FDA and referred to as GRAS.

Food additives are typically included in the processing stage to improve the quality and consistency of a product. Many additives also make items more “shelf stable,” meaning they will last a lot longer on store shelves and can generate more profit for store owners. Additives can also help to prevent spoilage that results from changes in temperature, damage during distribution, and other adverse conditions. In addition, food additives can protect consumers from exposure to rancid products and foodborne illnesses.

Food additives aren’t always beneficial, however. Some substances have been associated with certain diseases if consumed in large amounts. For example, the FDA estimates that sulfites can cause allergic reactions in 1 percent of the general population and in 5 percent of asthmatics. Similarly, the additive monosodium glutamate, which is commonly known as MSG, may cause headaches, nausea, weakness, difficulty breathing, rapid heartbeat, and chest pain in some individuals.The Issues: Additives. Sustainable Table. http://www.sustainabletable.org/issues/additives/#fn14. Accessed October 10, 2011.

The Effect of New Technologies

As mentioned earlier, new technology has had a tremendous effect on the food we eat and the customs and culture related to food consumption. For example, microwaves are used to reduce cooking time or to heat up leftover food. Refrigerators and freezers allow produce to travel great distances and last longer. On the extreme end of making food last longer, there is special food for astronauts that is appropriate for consumption in space. It is safe to store, easy to prepare in the low-gravity environment of a spacecraft, and contains balanced nutrition to promote the health of people working in space. In the military, soldiers consume Meals Ready-to-Eat (MREs), which contain an entire meal in a single pouch.

Consumer Info About Food From Genetically Engineered Plants

FDA regulates the safety of food for humans and animals, including foods produced from genetically engineered (GE) plants. Foods from GE plants must meet the same food safety requirements as foods derived from traditionally bred plants. Read more at Consumer Info About Food From Genetically Engineered Plants.Foods from Genetically Engineered Plants. U.S. Food and Drug Administration.  https://www.fda.gov/food/ingredientspackaginglabeling/geplants/default.htm. Updated January 4, 2018. Accessed January 20, 2018.

Genetically Modified Foods

Genetically modified foods (also known as GM or GMO foods), are plants or animals that have undergone some form of genetic engineering. In the United States, much of the soybean, corn, and canola crop is genetically modified. The process involves the alteration of an organism’s DNA, which allows farmers to cultivate plants with desirable characteristics.What Are Genetically Modified Foods?. Genomics.Energy.gov. http://www.ornl.gov/sci/techresources/Human_Genome/elsi/gmfood.shtml.  Last modified November 5, 2008. Accessed October 11, 2011. For example, scientists could extract a gene that produces a chemical with antifreeze properties from a fish that lives in an arctic region (such as a flounder). They could then splice that gene into a completely different species, such as a tomato, to make it resistant to frost, which would enable farms to grow that crop year-round.Whitman DB. Genetically Modified Foods: Harmful or Helpful?. CSA Discovery Guides. 2000; 1-13. https://biomed.brown.edu/arise/resources/docs/GM%20foods%20review.pdf. Accessed January 20, 2018.

Certain modifications can be beneficial in resisting pests or pesticides, improving the ripening process, increasing the nutritional content of food, or providing resistance to common viruses. Although genetic engineering has improved productivity for farmers, it has also stirred up debate about consumer safety and environmental protection. Possible side effects related to the consumption of GM foods include an increase in allergenicity, or tendencies to provoke allergic reactions. There is also some concern related to the possible transfer of the genes used to create genetically engineered foods from plants to people. This could influence human health if antibiotic-resistant genes are transferred to the consumer. Therefore, the World Health Organization (WHO) and other groups have encouraged the use of genetic engineering without antibiotic-resistance genes. Genetically modified plants may adversely affect the environment as well and could lead to the contamination of non-genetically engineered organisms.Food Safety: 20 Questions on Genetically Modified Foods. World Health Organization. http://www.who.int/foodsafety/publications/biotech/20questions/en/. Updated May 2014. Accessed January 18, 2018.

Genetically modified foods fall under the purview of the EPA, the USDA, and the FDA. Each agency has different responsibilities and concerns in the regulation of GM crops. The EPA ensures that pesticides used for GM plants are safe for the environment. The USDA makes sure genetically engineered seeds are safe for cultivation prior to planting. The FDA determines if foods made from GM plants are safe to eat. Although these agencies act independently, they work closely together and many products are reviewed by all three.Whitman DB. Genetically Modified Foods: Harmful or Helpful?. CSA Discovery Guides. 2000; 1-13. https://biomed.brown.edu/arise/resources/docs/GM%20foods%20review.pdf. Accessed January 20, 2018.

Efforts on the Consumer Level: What You Can Do

Consumers can also take steps to prevent foodborne illness and protect their health. Although you can often detect when mold is present, you can’t see, smell, or taste bacteria or other agents of foodborne disease. Therefore, it is crucial to take measures to protect yourself from disease. The four most important steps for handling, preparing, and serving food areUS Department of Health and Human Services. “Keep Food Safe.” Food Safety.gov. Accessed December 21, 2011. http://www.foodsafety.gov/keep/index.html.:

Know when to keep food and when to throw it out. It can be helpful to check the website http://www.stilltasty.com, which explains how long refrigerated food remains fresh.

Buying Food

It is best to buy your food from reputable grocers with clean, sanitary facilities, that keep products at appropriate temperatures. Consumers should examine food carefully before they purchase it. It is important to look at food in glass jars, check the stems on fresh produce, and avoid bruised fruit. Do not buy canned goods with dents or bulges, which are at risk for contamination with Clostridium botulinum. Fresh meat and poultry are usually free from mold, but cured and cooked meats should be examined carefully. Also, avoid torn, crushed, or open food packages, and do not buy food with frost or ice crystals, which indicates that the product has been stored for a long time, or thawed and refrozen. It is also a good idea to keep meat, poultry, seafood, and eggs separate from other items in your shopping cart as you move through the grocery store.

Storing Food

Refrigerate perishable foods quickly; they should not be left out for more than two hours. The refrigerator should be kept at 40°F (or 4°C) or colder, and checked periodically with a thermometer. Store eggs in a carton on a shelf in the refrigerator, and not on the refrigerator door where the temperature is warmest. Wrap meat packages tightly and store them at the bottom of the refrigerator, so juices won’t leak out onto other foods. Raw meat, poultry, and seafood should be kept in a refrigerator for only two days. Otherwise, they should be stored in the freezer, which should be kept at 0°F (or −18°C). Store potatoes and onions in a cool, dark place, but not under a sink because leakage from pipes could contaminate them. Empty cans of perishable foods or beverages that have been opened into containers, and promptly place them in a refrigerator. Also, be sure to consume leftovers within three to five days, so mold does not have a chance to grow.

Preparing Food

Wash hands thoroughly with warm, soapy water for at least twenty seconds before preparing food and every time after handling raw foods. Washing hands is important for many reasons. One is to prevent cross-contamination between foods. Also, some pathogens can be passed from person to person, so hand washing can help to prevent this. Fresh fruits and vegetables should also be rinsed thoroughly under running water to clean off pesticide residueCalifornia Department of Pesticide Regulation. “Pesticides and Food: How We Test for Safety.” Pesticide Info: What You Should Know about Pesticides, no. #E09/REV. Accessed December 21, 2011. http://www.cdpr.ca.gov/docs/dept/factshts/residu2..

This is particularly important for produce that contains a high level of residue, such as apples, pears, spinach, and potatoes. Washing also removes most dirt and bacteria from the surface of produce.

Other tips to keep foods safe during preparation include defrosting meat, poultry, and seafood in the refrigerator, microwave, or in a water-tight plastic bag submerged in cold water. Never defrost at room temperature because that is an ideal temperature for bacteria to grow. Also, marinate foods in the refrigerator and discard leftover marinade after use because it contains raw juices. Always use clean cutting boards, which should be washed with soap and warm water by hand or in a dishwasher after each use. Another way to sanitize cutting boards is to rinse them with a solution of 5 milliliters (1 teaspoon) chlorine bleach to about 1 liter (1 quart) of water. If possible, use separate cutting boards for fresh produce and for raw meat. Also, wash the top before opening canned foods to prevent dirt from coming into contact with food.

Cooking Food

Cooked food is safe to eat only after it has been heated to an internal temperature that is high enough to kill bacteria. You cannot judge the state of “cooked” by color and texture alone. Instead, use a food thermometer to be sure. The appropriate minimum cooking temperature varies depending on the type of food. Seafood should be cooked to an internal temperature of 145°F, beef, lamb, and pork to 160°F, ground chicken and turkey to 165°F, poultry breasts to 165°F, and whole poultry and thighs to 180°F. When microwaving, rotate the dish and stir contents several times to ensure even cooking.

Serving Food

After food has been cooked, the possibility of bacterial growth increases as the temperature drops. So, food should be kept above the safe temperature of 140°F, using a heat source such as a chafing dish, warming tray, or slow cooker. Cold foods should be kept at 40°F or lower. When serving food, keep it covered to block exposure to any mold spores hanging in the air. Use plastic wrap to cover foods that you want to remain moist, such as fresh fruits, vegetables, and salads. After a meal, do not keep leftovers at room temperature for more than two hours. They should be refrigerated as promptly as possible. It is also helpful to date leftovers, so they can be used within a safe time, which is generally three to five days when stored in a refrigerator.

XVIII

Chapter 18. Nutritional Issues

Comparing Diets

Diet Trends and Health

In the past, health was regarded merely as the absence of illness. However, a growing understanding of the complexity and potential of the human condition has prompted a new way of thinking about health. Today, we focus on the idea of wellness, which involves a great deal more than just not being sick. Wellness is a state of optimal well-being that enables an individual to maximize their potential. This concept includes a host of dimensions—physical, mental, emotional, social, environmental, and spiritual—which affect one’s quality of life.Understanding Wellness. University of Illinois at Urbana-Champaign, McKinley Health Center.   2011 The Board of Trustees of the University of Illinois at Urbana-Champaign. https://mckinley.illinois.edu/health-education/wellness. Accessed April 15, 2018. Striving for wellness begins with an examination of dietary choices.

Dietary Food Trends

Hundreds of years ago, when food was less accessible and daily life required much more physical activity, people worried less about obesity and more about simply getting enough to eat. In today’s industrialized nations, conveniences have solved some problems and introduced new ones, including the hand-in-hand obesity and diabetes epidemics. Fad diets gained popularity as more North Americans struggled with excess pounds. However, new evidence-based approaches that emphasize more holistic measures are on the rise. These new dietary trends encourage those seeking to lose weight to eat healthy, whole foods first, while adopting a more active lifestyle. These sound practices put dietary choices in the context of wellness and a healthier approach to life.

Everyday Connections

In the past, people’s culture and location determined the foods they ate and the manner in which they prepared their meals. For example, in Hawai’i, taro was a staple complex carbohydrate that could be eaten in various ways such as poi and pa’ia’i. Today, most people have access to a wide variety of food and can prepare them any way they choose. However, customs and traditions still strongly influence diet and cuisine in most areas of the world. To learn more about the food and culture in the pacific, visit http://manoa.hawaii.edu/ctahr/pacificfoodguide/index.php/regional-information/

Functional Foods

Many people seek out foods that provide the greatest health benefits. This trend is giving rise to the idea of functional foods, which not only help meet basic nutritional needs but also are reported to fight illness and aging. According to the Academy of Nutrition and Dietetics (AND), formerly known as the The American  Dietetic Association, functional foods may reduce the risk of disease or promote optimal health. The AND recognizes four types of functional foods. They are: conventional foods, modified foods, medical foods, and special dietary use foods.Functional Foods. The Academy of Nutrition and Dietetics. https://www.eatright.org/food/nutrition/healthy-eating/functional-foods. Published July 5, 2018. Accessed April 15, 2018.

The first group, conventional foods, represents the simplest form of functional foods. They are whole foods that have not been modified. Examples include whole fruits and vegetables (which are abundant in phytochemicals and antioxidants), yogurt and kefir (which contain natural probiotic bacteria that can help maintain digestive system health), and moderate amounts of dark chocolate, made with 70% or more cacao (which contains antioxidants).

Modified foods have been fortified, enriched, or enhanced with additional nutrients or bioactive compounds. Foods are modified using biotechnology to improve their nutritional value and health attributes. Examples of modified foods include calcium-fortified orange juice, breads enriched with B vitamins, iodized salt, cereals fortified with vitamins and minerals, margarine enhanced with plant sterols, and energy drinks that have been enriched with herbs (ginseng or guarana) or amino acids (taurine). It is important to consider that the health claims of some modified foods may be debatable, or entirely fraudulent. Check with a health professional regarding the effects of modified foods on your health.

Medical foods are designed for enteric administration under the guidance of a medical professional. (During enteric administration, food is treated so that it goes through the stomach undigested. Instead, the food is broken down in the intestines only.) Medical foods are created to meet very specific nutritional requirements. Examples of medical foods include liquid formulas for people with kidney disease, liver disease, diabetes, or other health issues. Medical food is also given to comatose patients through a gastronomy tube because they cannot eat by mouth.

Special dietary use foods do not have to be administered under a doctor’s care and can be found in a variety of stores. Similar to medical foods, they address special dietary needs and meet the nutritional requirements of certain health conditions. For example, a bottled oral supplement administered under medical supervision is a medical food, but it becomes a special dietary use food when it is sold to retail customers. Examples of special dietary use foods include gluten-free foods, lactose-free dairy products, and formulas and shakes that promote weight loss.

Popular Diets

The concept of functional foods represents initiatives aimed at addressing health problems. Certain diet plans take this concept one step further, by striving to prevent or treat specific conditions. For example, it is widely understood that people with diabetes need to follow a particular diet. Although some of these diet plans may be nutritionally sound, use caution because some diets may be fads or be so extreme that they actually cause health problems.

Before experimenting with a diet, discuss your plans with your doctor or a registered dietitian. Throughout this section, we will discuss some of the more popular diets. Some fall under the category of fad diets, while others are backed by scientific evidence. Those that fall into the latter category provide a good foundation to build a solid regimen for optimal health.

The DASH Diet

The Dietary Approaches to Stop Hypertension, or DASH diet, focuses on reducing sodium intake to either 2,300 milligrams per day (as recommended by the Dietary Guidelines for Americans) or 1,500 milligrams per day for certain populations. The DASH diet is an evidence-based eating plan that can help reduce high blood pressure. This plan may also decrease the risk of heart attack, stroke, diabetes, osteoporosis, and certain cancers.DASH Diet Eating Plan. DASH Diet Oregon.  http://www.dashdietoregon.org/. Accessed April 12, 2018.

DASH tips to lower sodium include:

DASH dieters are recommended to consume a variety of whole grains and high-fiber fruits and vegetables, and moderate amounts of low-fat dairy products, lean meats, and heart-healthy fish. In addition, DASH limits the use of saturated fats to less than 7 percent of total calories, and limits the consumption of sweets and alcohol. The DASH diet also calls for consuming less added sugar and drinking fewer sugar-sweetened drinks. It replaces red meat with fish and legumes and calls for increased calcium, magnesium, potassium, and fiber. Also, even though some people on the DASH diet may find it lowers their HDL (good) cholesterol along with their LDL (bad) cholesterol, it still has a positive cumulative effect on heart health.DASH Diet Eating Plan. DASH Diet Oregon. http://www.dashdietoregon.org/. Accessed April 12, 2018.

The Gluten-Free Diet

The gluten-free diet helps people whose bodies cannot tolerate gluten, a protein found in wheat, barley, and rye. One of the most important ways to treat this condition is to avoid the problematic foods, which is not easy. Although following a gluten-free diet is challenging, it is prescribed for patients with gluten intolerance and celiac disease, an autoimmune disorder with a genetic link. People who have celiac disease cannot consume gluten products without damaging their intestinal lining. Eating a gluten-free diet means finding replacements for bread, cereal, pasta, and more. It also means emphasizing fresh fruits, vegetables, and other foods without gluten. However, it is important to note that the gluten-free trend has become something of a fad even for those without a gluten intolerance. Celiac disease is a relatively rare condition found in only 1 percent of the population. Therefore, a gluten-free diet should be followed only with a physician’s recommendation.

Low-Carb Diets

Low-carb diets, which include the Atkins Diet and the South Beach Diet, focus on limiting carbohydrates—such as grains, fruit, and starchy vegetables—to promote weight loss. The theory behind the low-carb diet is that insulin prevents the breakdown of fat by allowing sugar in the form of blood glucose to be used for energy. Proponents of this approach believe that because limiting carbs generally lowers insulin levels, it would then cause the body to burn stored fat instead. They believe this method not only brings about weight loss, but also reduces the risk factors for a number of conditions. However, some studies have shown that people who followed certain low-carb diet plans for two years lost an average of nearly 9 pounds, which is similar to the amount of weight lost on higher carbohydrate diets.Low-Carb Diet: Can It Help You Lose Weight?.The Mayo Clinic.  http://www.mayoclinic.com/health/low-carb-diet/NU00279. Accessed March 6, 2018.

The benefits of this kind of diet include an emphasis on whole, unprocessed foods and a de-emphasis of refined carbohydrates, such as white flour, white bread, and white sugar. However, there are a number of downsides. Typically, the first two weeks allow for only 20 grams of carbs per day, which can be dangerously low. In addition, dieters using the low-carb approach tend to consume twice as many saturated fats as people on a diet high in healthy carbohydrates. Low-carb diets are also associated with a higher energy intake, and the notion that “calories don’t count,” which is prevalent in this kind of diet, is not supported by scientific evidence.Steele V. Health and Nutritional Effects of Popular Diets. Kellogg Nutrition Symposium, The Team of Registered Dietitians & Nutrition Professionals at Kellogg Canada Inc. Insert to Canadian Journal of Dietetic Practice and Research 64, no. 3.

The Macrobiotic Diet

The macrobiotic diet is part of a health and wellness regimen based in Eastern philosophy. It combines certain tenets of Zen Buddhism with a vegetarian diet and supports a balance of the oppositional forces of yin and yang. Foods are paired based on their so-called yin or yang characteristics. Yin foods are thought to be sweet, cold, and passive, while yang foods are considered to be salty, hot, and aggressive.

Whole grains make up about 50 percent of the calories consumed and are believed to have the best balance of yin and yang. Raw and cooked vegetables comprise about 30 percent of the diet and include kale, cabbage, collards, bok choy, and broccoli on a daily basis, along with mushrooms and celery a few times a week. Bean or vegetable-based soups and broths can make up 5 to 10 percent of daily caloric intake. Additionally, the diet allows small amounts of fish and seafood several times a week, along with a few servings of nuts. The macrobiotic diet prohibits certain foods, such as chocolate, tropical fruits, and animal products, because they are believed to fall on the far end of the yin-yang spectrum, which would make it difficult to achieve a Zen-like balance.

The macrobiotic diet focuses on foods that are low in saturated fats and high in fiber, which can help to lower the risk of cardiovascular disease. Proponents of this diet also believe that it may protect against cancer. However, many nutritionists and healthcare providers express concerns, particularly if the diet is followed strictly. Extreme macrobiotic eating can be low in protein, low in calories, and pose a risk for starvation. In addition, the diet is also very low in essential vitamins and minerals.Zelman, KM. Macrobiotic Diet. http://www.webmd.com/diet/features/macrobiotic-diet. Updated February 9, 2018. Accessed April 12, 2018.

The Mediterranean Diet

The traditional Mediterranean diet incorporates many elements of the dietary choices of people living in Greece and southern Italy. The Mediterranean diet focuses on small portions of nutritionally-sound food. This diet features food from plant sources, including vegetables, fruits, whole grains, beans, nuts, seeds, breads and potatoes, and olive oil. It also limits the consumption of processed foods and recommends eating locally grown foods rich in micronutrients and antioxidants. Other aspects of this eating plan include consuming fish and poultry at least twice per week, eating red meat only a few times per month, having up to seven eggs per week, and drinking red wine in moderation. Unlike most diets, the Mediterranean diet does not cut fat consumption across the board. Instead, it incorporates low-fat cheese and dairy products, and it substitutes olive oil, canola oil, and other healthy oils for butter and margarine.

More than fifty years of nutritional and epidemiological research has shown that people who follow the Mediterranean diet have some of the lowest rates of chronic disease and the highest rates of longevity among the populations of the world. Studies have shown that the Mediterranean diet also helps to decrease excess body weight, blood pressure, blood fats, and blood sugar and insulin levels significantly.Robinson, K. The Mediterranean Diet. http://www.webmd.com/diet/features/the-mediterranean-diet. Published February 6, 2018. Accessed April 15, 2018.

Tools for Change

For six years, researchers from the University of Bordeaux in France followed the dietary habits of more than seven thousand individuals age sixty-five and over. Participants who described greater consumption of extra-virgin olive oil reportedly lowered their risk of suffering a stroke by 41 percent. The study controlled for stroke risk factors, such as smoking, alcohol intake, high blood pressure, and a sedentary lifestyle. To increase the amount of olive oil in your diet, try spreading olive oil instead of butter on your toast, making your own salad dressing using olive oil, vinegar or lemon juice, and herbs, cooking with olive oil exclusively, or simply adding a dose of it to your favorite meal.More Olive Oil in Diet Could Cut Stroke Risk: Study. MedicineNet.com. https://www.medicinenet.com/script/main/art.asp?articlekey=145823. Published 2011. Accessed April 15,2018.

The Raw Food Diet

The raw food diet is followed by those who avoid cooking as much as possible in order to take advantage of the full nutrient content of foods. The principle behind raw foodism is that plant foods in their natural state are the most wholesome for the body. The raw food diet is not a weight-loss plan, it is a lifestyle choice. People who practice raw foodism eat only uncooked and unprocessed foods, emphasizing whole fruits and vegetables. Staples of the raw food diet include whole grains, beans, dried fruits, seeds and nuts, seaweed, sprouts, and unprocessed produce. As a result, food preparation mostly involves peeling, chopping, blending, straining, and dehydrating fruits and vegetables.

The positive aspects of this eating method include consuming foods that are high in fiber and nutrients, and low in calories and saturated fat. However, the raw food diet offers little in the way of protein, dairy, or fats, which can cause deficiencies of the vitamins A, D, E, and K. In addition, not all foods are healthier uncooked, such as spinach and tomatoes. Also, cooking eliminates potentially harmful microorganisms that can cause foodborne illnesses. Therefore, people who primarily eat raw foods should thoroughly clean all fruit and vegetables before eating them. Poultry and other meats should always be cooked before eating.Raw Food Diet. WebMD.com.https://www.webmd.com/diet/a-z/raw-foods-diet. Published November 21, 2016. Accessed April 15, 2018.

Vegetarian and Vegan Diets

Vegetarian and vegan diets have been followed for thousands of years for different reasons, including as part of a spiritual practice, to show respect for living things, for health reasons, or because of environmental concerns. For many people, being a vegetarian is a logical outgrowth of “thinking green.” A meat-based food system requires more energy, land, and water resources than a plant-based food system. This may suggest that the plant-based diet is more sustainable than the average meat-based diet in the U.S.By avoiding animal flesh, vegetarians hope to look after their own health and that of the planet at the same time. Broadly speaking, vegetarians eat beans, grains, and fruits and vegetables, and do not eat red meat, poultry, seafood, or any other animal flesh. Some vegetarians, known as lacto vegetarians, will eat dairy products. Others, known as lacto-ovo vegetarians, will eat dairy products and eggs. A vegan diet is the most restrictive vegetarian diet—vegans do not eat dairy, eggs, or other animal products, and some do not eat honey.

Vegetarian diets have a number of benefits. Well-balanced eating plans can lower the risk of a number of chronic conditions, including heart disease, diabetes, and obesity. They also help to promote sustainable agriculture. However, if a vegetarian does not vary his or her food choices, the diet may be insufficient in calcium, iron, omega-3 fatty acids, zinc, and vitamin B12. Also, if people who follow these diets do not plan out their meals, they may gravitate toward foods high in fats.

Table 18.1 The Pros and Cons of Seven Popular Diets

Diet Pros Cons
DASH Diet
  • Recommended by the National Heart, Lung, and Blood Institute, the American Heart Association, and many physicians
  • Helps to lower blood pressure and cholesterol
  • Reduces risk of heart disease and stroke
  • Reduces risk of certain cancers
  • Reduces diabetes risk
  • There are very few negative factors associated with the DASH diet
  • Risk for hyponatremia
Gluten-Free Diet
  • Reduces the symptoms of gluten intolerance, such as chronic diarrhea, cramping, constipation, and bloating
  • Promotes healing of the small intestines for people with celiac disease, preventing malnutrition
  • May be beneficial for other autoimmune diseases, such as Parkinson’s disease, rheumatoid arthritis, and multiple sclerosis
  • Risk of folate, iron, thiamin, riboflavin, niacin, and vitamin B6 deficiencies
  • Special gluten-free products can be hard to find and expensive
  • Requires constant vigilance and careful food label reading, since gluten is found in many products
Low-Carb Diet
  • Restricts refined carbohydrates, such as white flour and white sugar
  • May temporarily improve blood sugar or blood cholesterol levels
  • Not entirely evidence-based
  • Results in higher fat and protein consumption
  • Does not meet the RDA for carbohydrates to provide glucose to the brain
Macrobiotic Diet
  • Low in saturated fats and high in fiber
  • Emphasizes whole foods and de-emphasizes processed foods
  • Rich in phytoestrogens, which may reduce the risk of estrogen-related cancers
  • Not entirely evidence-based
  • Lacks certain vitamins and minerals; supplements are often required
  • Can result in a very low caloric intake
  • Lack of energy may result from inadequate protein
Mediterranean Diet
  • A reduced risk of cardiovascular disease and mortality
  • A lower risk of cancer
  • De-emphasizes processed foods and emphasizes whole foods and healthy fats
  • Lower sodium intake, due to fewer processed foods
  • Emphasis on monosaturated fats leads to lower cholesterol
  • Highlighting fruits and vegetables raises consumption of antioxidants
  • Does not specify daily serving amounts
  • Potential for high fat and high calorie intake as nuts and oils are calorie-dense foods
  • Drinking one to two glasses of wine per day may not be healthy for those with certain conditions
Raw Food Diet
  • Emphasizes whole foods
  • Focuses on nutritionally-rich foods
  • Not entirely evidence-based
  • Very restrictive and limits protein and healthy fat intake
  • Could encourage the development of foodborne illness
  • Extremely difficult to follow
  • High in fiber which can cause essential nutrient deficiencies
Vegetarianism and Veganism
  • May reduce some chronic diseases such as cancer, heart disease, and Type 2 diabetes
  • May help with weight reduction and weight maintenance
  • Guidelines regarding fat and nutrient consumption must be followed
  • Higher risk for nutrient deficiencies such as protein, iron, zinc, omega-3, vitamin B12
  • Consumption of a high fiber diet interferes with mineral and nutrient bioavailability
  • Vegetarian and vegan protein sources are lower quality with majority missing at least one essential amino acids


Nutrition and Health and Disease

Disorders That Can Compromise Health

When nutrients and energy are in short supply, cells, tissues, organs, and organ systems do not function properly. Unbalanced diets can cause diseases and, conversely, certain illnesses and diseases can cause an inadequate intake and absorption of nutrients, simulating the health consequences of an unbalanced diet. Overeating high-fat foods and nutrient-poor foods can lead to obesity and exacerbate the symptoms of gastroesophageal reflux disease (GERD) and irritable bowel syndrome (IBS). Many diseases and illnesses, such as celiac disease, interfere with the body getting its nutritional requirements. A host of other conditions and illnesses, such as food allergies, cancer, stomach ulcers, Crohn’s disease, and kidney and liver disease, also can impair the process of digestion and/or negatively affect nutrient balance and decrease overall health. Some illnesses that can compromise health are chronic and persist for a long time, some are communicable and can be transmitted between people, and some are non-communicable and are not infectious.

Gastroesophageal Reflux Disease

Gastroesophageal reflux disease (GERD) is a persistent form of acid reflux that occurs more than two times per week. Acid reflux occurs when the acidic contents of the stomach leak backward into the esophagus and cause irritation. It is estimated that GERD affects 25 to 35 percent of the US population. An analysis of several studies published in the August 2005 issue of Annals of Internal Medicine concludes that GERD is much more prevalent in people who are obese.Hampel H, Abraham NS, El-Serag HB. Meta-Analysis: Obesity and the Risk for Gastroesophageal Reflux Disease and Its Complications. Ann Intern Med, 143(3), 199–211. http://www.ncbi.nlm.nih.gov/pubmed/16061918. Accessed April 12, 2018. The most common GERD symptom is heartburn, but people with GERD may also experience regurgitation (flow of the stomach’s acidic contents into the mouth), frequent coughing, and trouble swallowing.

There are other causative factors of GERD that may be separate from or intertwined with obesity. The sphincter that separates the stomach’s internal contents from the esophagus often does not function properly and acidic gastric contents seep upward. Sometimes the peristaltic contractions of the esophagus are also sluggish and compromise the clearance of acidic contents. In addition to having an unbalanced, high-fat diet, some people with GERD are sensitive to particular foods—chocolate, garlic, spicy foods, fried foods, and tomato-based foods—which worsen symptoms. Drinks containing alcohol or caffeine may also worsen GERD symptoms. GERD is diagnosed most often by a history of the frequency of recurring symptoms. A more proper diagnosis can be made when a doctor inserts a small device into the lower esophagus that measures the acidity of the contents during one’s daily activities. About 50 percent of people with GERD have inflamed tissues in the esophagus.

The first approach to GERD treatment is dietary and lifestyle modifications. Suggestions are to reduce weight if you are overweight or obese, avoid foods that worsen GERD symptoms, eat smaller meals, stop smoking, and remain upright for at least three hours after a meal. People with GERD may not take in the nutrients they need because of the pain and discomfort associated with eating. As a result, GERD can be caused by an unbalanced diet and its symptoms can lead to a worsening of nutrient inadequacy, a vicious cycle that further compromises health. Some evidence from scientific studies indicates that medications used to treat GERD may accentuate certain nutrient deficiencies, namely zinc and magnesium. When these treatment approaches do not work surgery is an option. The most common surgery involves reinforcing the sphincter that serves as a barrier between the stomach and esophagus.

Irritable Bowel Syndrome

Irritable bowel syndrome (IBS) is characterized by muscle spasms in the colon that result in abdominal pain, bloating, constipation, and/or diarrhea. Interestingly, IBS produces no permanent structural damage to the large intestine as often happens to patients who have Crohn’s disease or inflammatory bowel disease. It is estimated that one in five Americans displays symptoms of IBS. The disorder is more prevalent in women than men. Two primary factors that contribute to IBS are an unbalanced diet and stress.

Symptoms of IBS significantly decrease a person’s quality of life as they are present for at least twelve consecutive or nonconsecutive weeks in a year. Large meals and foods high in fat and added sugars, or those that contain wheat, rye, barley, peppermint, and chocolate intensify or bring about symptoms of IBS. Additionally, beverages containing caffeine or alcohol may worsen IBS. Stress and depression compound the severity and frequency of IBS symptoms. As with GERD, the first treatment approaches for IBS are diet and lifestyle modifications. People with IBS are often told to keep a daily food journal to help identify and eliminate foods that cause the most problems. Other recommendations are to eat slower, add more fiber to the diet, drink more water, and to exercise. There are some medications (many of which can be purchased over-the-counter) to treat IBS and the resulting diarrhea or constipation. Sometimes antidepressants and drugs to relax the colon are prescribed.

Celiac Disease

Celiac disease is an autoimmune disorder affecting between 0.5 and 1.0 percent of Americans—that is, one in every one- to two-hundred people. It is caused by an abnormal immune reaction of small intestine cells to a type of protein, called gluten. Gluten forms in the presence of water and is composed of two protein parts, glutenin and gliadin. Glutenin and gliadin are found in grains that are commonly used to make bread, such as wheat, rye, and barley. When bread is made, yeast eats the flour and makes a waste product, carbon dioxide, which forms bubbles in the dough. As the dough is kneaded, gluten forms and stretches. The carbon dioxide gas bubbles infiltrate the stretchy gluten, giving bread its porosity and tenderness. For those who are sensitive to gluten, it is good to know that corn, millet, buckwheat, and oats do not contain the proteins that make gluten. However, some people who have celiac disease also may have a response to products containing oats. This is most likely the result of cross-contamination of grains during harvest, storage, packaging, and processing.

Celiac disease is most common in people of European descent and is rare in people of African American, Japanese, and Chinese descent. It is much more prevalent in women and in people with Type 1 diabetes, autoimmune thyroid disease, and Down and Turner syndromes. Symptoms can range from mild to severe and can include pale, fatty, loose stools, gastrointestinal upset, abdominal pain, weight loss and, in children, a failure to grow and thrive. The symptoms can appear in infancy or much later in life, even by age seventy. Celiac disease is not always diagnosed because the symptoms may be mild. A large number of people have what is referred to as “silent” or “latent” celiac disease.

Celiac disease diagnosis requires a blood test and a biopsy of the small intestine. Because celiac disease is an autoimmune disease, antibodies produced by white blood cells circulate in the body and can be detected in the blood. When gluten-containing foods are consumed the antibodies attack cells lining the small intestine leading to a destruction of the small villi projections. This tissue damage can be detected with a biopsy, a procedure that removes a portion of tissue from the damaged organ. Villi destruction is what causes many of the symptoms of celiac disease. The destruction of the absorptive surface of the small intestine also results in the malabsorption of nutrients, so that while people with this disease may eat enough, nutrients do not make it to the bloodstream because absorption is reduced. The effects of nutrient malabsorption are most apparent in children and the elderly as they are especially susceptible to nutrient deficiencies. Over time these nutrient deficiencies can cause health problems. Poor absorption of iron and folic acid can cause anemia, which is a decrease in red blood cells. Anemia impairs oxygen transport to all cells in the body. Calcium and vitamin D deficiencies can lead to osteoporosis, a disease in which bones become brittle.

If you think you or someone close to you may have celiac disease, do not despair; it is a very treatable disease. Once diagnosed, a person follows a gluten-free diet for life. This requires dedication and careful detective work to seek out foods with hidden gluten, but some stores carry gluten-free foods. After eliminating gluten from the diet, the tissues of the small intestine rapidly repair themselves and heal in less than six months.

Food Allergies

Paying attention to the way individuals react to various foods is essential in determining what foods may specifically affect a person adversely. Food allergies are one of the many ways in which different body make-ups affect nutritional concerns. Although an estimated twelve million Americans have food allergies, there are likely many more people who say they have food allergies than actually do. This is because food sensitization is different from a medically-determined food allergy. When someone has a food allergy, the immune system mistakenly attacks a certain kind of food (usually the protein component of a food), such as peanuts, as if it were a threat and IgE antibodies are produced. Doctors sometimes test for food allergies by using skin-prick tests or blood tests to look for the presence of IgE antibodies. However, these types of tests are not always reliable as they can sometimes yield a false positive result. By far, the most valuable tests for determining a food allergy is the Double Blind Placebo Controlled Food Challenge (DBPCFC), which involves administering the food orally and then denoting the signs and symptoms of the allergic response.

Food allergy symptoms usually develop within a few minutes to two hours after a person has eaten a food to which they are allergic. These symptoms can range from the annoying to the potentially fatal, and include:

There are no clear treatments for food allergies. Epinephrine is sometimes used to control severe reactions, and individuals with known and dangerous allergies may get prescriptions for self-injectable devices. The only certain way to avoid allergic reactions to food is to avoid the foods that cause them. Beyond avoidance, this can mean reading food labels carefully, or even calling manufacturers for product information.

Ninety percent of food allergies are caused by these eight foods:

  1. Milk
  2. Eggs
  3. Peanuts
  4. Tree nuts
  5. Fish
  6. Shellfish
  7. Wheat
  8. Soy

The prevalence of food allergies is a complex and growing problem. In response to this situation, the National Institute of Allergy and Infectious Diseases (NIAID) collaborated with thirty-four professional organizations, federal agencies, and patient-advocacy groups to develop a comprehensive guide to diagnosing and managing food allergies and treating acute food allergy reactions. The guide defines various food allergies, allergens, and reactions, provides comprehensive information on the prevalence of different food allergies, tracks the history of food allergies, and reviews medical management techniques for people with food allergies.

Oral Disease

Oral health refers not only to healthy teeth and gums, but also to the health of all the supporting tissues in the mouth such as ligaments, nerves, jawbone, chewing muscles, and salivary glands. Over ten years ago the Surgeon General produced its first report dedicated to oral health, stating that oral health and health in general are not separate entities.Office of the Surgeon General (US). National Call To Action To Promote Oral Health. National Institute of Dental and Craniofacial Research (US). 2003; 03-5303. https://www.ncbi.nlm.nih.gov/books/NBK47472/. Accessed April 15, 2018.

Instead, oral health is an integral part of overall health and well-being. Soft drinks, sports drinks, candies, desserts, and fruit juices are the main sources of “fermentable sugars” in the American diet. (Fermentable sugars are those that are easily metabolized by bacteria in a process known as fermentation. Glucose, fructose, and maltose are three examples.) Bacteria that inhabit the mouth metabolize fermentable sugars and starches in refined grains to acids that erode tooth enamel and deeper bone tissues. The acid creates holes (cavities) in the teeth that can be extremely painful. Gums are also damaged by bacteria produced by acids, leading to gingivitis (characterized by inflamed and bleeding gums). Saliva is actually a natural mouthwash that neutralizes the acids and aids in building up teeth that have been damaged.

Figure 18.1 Gingivitis

According to Healthy People 2010, 23 percent of US children have cavities by the age of four, and by second grade, one-half of all children in this country have at least one cavity.Continuing MCH Education in Oral Health. Oral Health and Health Care. http://ccnmtl.columbia.edu/projects/otm/index.html. Accessed April 12, 2018.

Cavities are an epidemic health problem in the United States and are associated with poor diet, but other contributors include poor dental hygiene and the inaccessibility to regular oral health care. A review in Academic Pediatrics reports that “frequent consumption of fast-releasing carbohydrates, primarily in the form of dietary sugars, is significantly associated with increased dental caries risk.”Mobley C, Marshall T. The Contribution of Dietary Factors to Dental Caries and Disparities in Caries. Acad Pediatr. 2009; 9(6), 410–14. https://www.ncbi.nlm.nih.gov/pmc/articles/PMC2862385/. Accessed April 15, 2018. In regards to sugary soft drinks, the American Dental Association says that drinking sugary soft drinks increases the risk of decay formation.Foods that Affects your Teeth. American Dental Association. https://www.mouthhealthy.org/en/nutrition/food-tips. Accessed April 15, 2018.

Colon Health

A substantial health benefit of whole grain foods is that fiber actively supports digestion and optimizes colon health. (This can be more specifically attributed to the insoluble fiber content of whole grains.) There is good evidence supporting that insoluble fiber prevents the irritating problem of constipation and the development of diverticulosis and diverticulitis. Diverticulosis is a benign condition characterized by outpouches of the colon. Diverticulitis occurs when the outpouches in the lining of the colon become inflamed. Interestingly, diverticulitis did not make its medical debut until the early 1900s, and in 1971 was defined as a deficiency of whole-grain fiber. According to the National Digestive Diseases Information Clearinghouse, 10 percent of Americans over the age of forty have diverticulosis, and 50 percent of people over the age of sixty have the disorder.Diverticular Disease. National Institute of Diabetes and Digestive and Kidney Diseases, National Institute of Health. http://digestive.niddk.nih.gov/ddiseases/pubs/diverticulosis/. Accessed April 15, 2018. Ten to 25 percent of people who have diverticulosis go on to develop diverticulitis.Diverticular Disease. National Institute of Diabetes and Digestive and Kidney Diseases, National Institute of Health. http://digestive.niddk.nih.gov/ddiseases/pubs/diverticulosis/. Accessed April 15, 2018. Symptoms include lower abdominal pain, nausea, and alternating between constipation and diarrhea.

The chances of developing diverticulosis can be reduced with fiber intake because of what the breakdown products of the fiber do for the colon. The bacterial breakdown of fiber in the large intestine releases short-chain fatty acids. These molecules have been found to nourish colonic cells, inhibit colonic inflammation, and stimulate the immune system (thereby providing protection of the colon from harmful substances). Additionally, the bacterial indigestible fiber, mostly insoluble, increases stool bulk and softness increasing transit time in the large intestine and facilitating feces elimination. One phenomenon of consuming foods high in fiber is increased gas, since the byproducts of bacterial digestion of fiber are gases.

Figure 18.2 Diverticulitis: A Disease of Fiber Deficiency

Some studies have found a link between high dietary-fiber intake and a decreased risk for colon cancer. However an analysis of several studies, published in the Journal of the American Medical Association 2005, did not find that dietary-fiber intake was associated with a reduction in colon cancer risk.Park Y, Hunter DJ. Dietary Fiber Intake and Risk of Colorectal Cancer. JAMA. 2005; 294(22), 2849–57. https://www.ncbi.nlm.nih.gov/pubmed/16352792. Accessed April 15,2018. There is some evidence that specific fiber types (such as inulin) may protect against colon cancer, but more studies are needed to conclusively determine how certain fiber types (and at what dose) inhibit colon cancer development.

Osteoporosis

There are several factors that lead to loss of bone quality during aging, including a reduction in hormone levels, decreased calcium absorption, and increased muscle deterioration. It is comparable to being charged with the task of maintaining and repairing the structure of your home without having all of the necessary materials to do so. However, you will learn that there are many ways to maximize your bone health at any age.

Osteoporosis is the excessive loss of bone over time. It leads to decreased bone strength and an increased susceptibility to bone fracture. The Office of the Surgeon General (OSG) reports that approximately ten million Americans over age fifty are living with osteoporosis, and an additional thirty-four million have osteopenia, which is lower-than-normal bone mineral density.Office of the Surgeon General (US). Bone Health and Osteoporosis. 2004.  https://www.ncbi.nlm.nih.gov/books/NBK45513/. Accessed April 12,2018.

Osteoporosis is a debilitating disease that markedly increases the risks of suffering from bone fractures. A fracture in the hip causes the most serious consequences—and approximately 20 percent of senior citizens who have one will die in the year after the injury. Osteoporosis affects more women than men, but men are also at risk for developing osteoporosis, especially after the age of seventy. These statistics may appear grim, but many organizations—including the National Osteoporosis Foundation and the OSG—are disseminating information to the public and to health-care professionals on ways to prevent the disease, while at the same time, science is advancing in the prevention and treatment of this disease.Facts and Statistics. International Osteoporosis Foundation. https://www.iofbonehealth.org/facts-statistics#category-14. Accessed March 17, 2018.

As previously discussed, bones grow and mineralize predominantly during infancy, childhood, and puberty. During this time, bone growth exceeds bone loss. By age twenty, bone growth is fairly complete and only a small amount (about 10 percent) of bone mass accumulates in the third decade of life. By age thirty, bone mass is at its greatest in both men and women and then gradually declines after age forty. Bone mass refers to the total weight of bone tissue in the human body. The greatest quantity of bone tissue a person develops during his or her lifetime is called peak bone mass. The decline in bone mass after age forty occurs because bone loss is greater than bone growth. The increased bone degradation decreases the mineral content of bone tissue leading to a decrease in bone strength and increased fracture risk.

Osteoporosis is referred to as a silent disease, much like high blood pressure, because symptoms are rarely exhibited. A person with osteoporosis may not know he has the disease until he experiences a bone break or fracture. Detection and treatment of osteoporosis, before the occurrence of a fracture, can significantly improve the quality of life. To detect osteopenia or osteoporosis, BMD must be measured by the DEXA procedure.

During the course of osteoporosis, BMD decreases and the bone tissue microarchitecture is compromised. Excessive bone resorption in the trabecular tissue increases the size of the holes in the lattice-like structure making it more porous and weaker. A disproportionate amount of resorption of the strong cortical bone causes it to become thinner. The deterioration of one or both types of bone tissue causes bones to weaken and, consequently, become more susceptible to fractures. The American Academy of Orthopaedic Surgeons reports that one in two women and one in five men older than sixty-five will experience a bone fracture caused by osteoporosis.Osteoporosis. American Academy of Orthopaedic Surgeons.OrthoInfo. http://orthoinfo.aaos.org/topic.cfm?topic=a00232. Updated August 2009. Accessed April 16, 2018.

Figure 18.3 Osteoporosis in Vertebrae

When the vertebral bone tissue is weakened, it can cause the spine to curve. The increase in spine curvature not only causes pain, but also decreases a person’s height. Curvature of the upper spine produces what is called Dowager’s hump, also known as kyphosis. Severe upper-spine deformity can compress the chest cavity and cause difficulty breathing. It may also cause abdominal pain and loss of appetite because of the increased pressure on the abdomen.

Risk Factors for Osteoporosis

A risk factor is defined as a variable that is linked to an increased probability of developing a disease or adverse outcome. Recall that advanced age and being female increases the likelihood for developing osteoporosis. These factors present risks that should signal doctors and individuals to focus more attention on bone health, especially when the risk factors exist in combination. This is because not all risk factors for osteoporosis are out of your control. Risk factors such as age, gender, and race are biological risk factors, and are based on genetics that cannot be changed. By contrast, there are other risk factors that can be modified, such as physical activity, alcohol intake, and diet. The changeable risk factors for osteoporosis provide a mechanism to improve bone health even though some people may be genetically predisposed to the disease.


Physical Activity

Bone is a living tissue, like muscle, that reacts to exercise by gaining strength. Physical inactivity lowers peak bone mass, decreases BMD at all ages, and is linked to an increase in fracture risk, especially in the elderly. Recall that mechanical stress increases bone remodeling and leads to increased bone strength and quality. Weight-bearing exercise puts mechanical stress on bones and therefore increases bone quality. Weight-bearing exercises such as strength training with weights, and aerobic weight-bearing activities, such as walking, running, and stair climbing are the most helpful for maintaining BMD. Certain aerobic exercises such as biking and swimming do not build bones, although they are very good for cardiovascular fitness.The stimulation of new bone growth occurs when a person participates in weight-bearing or resistance activities that force the body to work against gravity. Research has shown that this is an excellent way to activate osteoblasts to build more new bone. Conversely, physical inactivity lowers peak bone mass, decreases BMD at all ages, and is linked to an increase in fracture risk, especially in the elderly.

Being Underweight

Being underweight significantly increases the risk for developing osteoporosis. This is because people who are underweight often also have a smaller frame size and therefore have a lower peak bone mass. Maintaining a normal, healthy weight is important and acts as a form of weight-bearing exercise for the skeletal system as a person moves about. Additionally, inadequate nutrition negatively impacts peak bone mass and BMD. The most striking relationship between being underweight and bone health is seen in people with the psychiatric illness anorexia nervosa. Anorexia nervosa is strongly correlated with low peak bone mass and a low BMD. In fact, more than 50 percent of men and women who have this illness develop osteoporosis and sometimes it occurs very early in life.Mehler PS, Weiner K. The Risk of Osteoporosis in Anorexia Nervosa. Eating Disorders Recovery Today.  http://www.eatingdisordersrecoverytoday.com/the-risk-of-osteoporosis-in-anorexia-nervosa/. Published May 14, 2017. Accessed April 15, 2018. Women with anorexia nervosa are especially at risk because they not only have inadequate nutrition and low body weight, but also the illness is also associated with estrogen deficiency.

Smoking, Alcohol, and Caffeine

Smoking cigarettes has long been connected to a decrease in BMD and an increased risk for osteoporosis and fractures. However, because people who smoke are more likely to be physically inactive and have poor diets, it is difficult to determine whether smoking itself causes osteoporosis. What is more, smoking is linked to earlier menopause and therefore the increased risk for developing osteoporosis among female smokers may also be attributed, at least in part, to having stopped estrogen production at an earlier age. A review of several studies, published in the British Medical Journal in 1997, reports that in postmenopausal women who smoked, BMD was decreased an additional 2 percent for every ten-year increase in age and that these women had a substantial increase in the incidence of hip fractures.Law MR, Hackshaw, AK. A Meta-Analysis of Cigarette Smoking, Bone Mineral Density and Risk of Hip Fracture: Recognition of a Major Effect. British Medical Journal. 1997.315 (7112), 841–6. http://www.ncbi.nlm.nih.gov/pubmed/9353503. Accessed April 15, 2018.

Alcohol intake’s effect on bone health is less clear. In some studies, excessive alcohol consumption was found to be a risk factor for developing osteoporosis, but the results of other studies suggests consuming two drinks per day is actually associated with an increase in BMD and a decreased risk for developing osteoporosis. The International Osteoporosis Foundation states that consuming more than two alcoholic drinks per day is a risk factor for developing osteoporosis and sustaining a hip fracture in both men and women.New IOF Report Shows Smoking, Alcohol, Being Underweight, and Poor Nutrition Harm Our Bones. International Osteoporosis Foundation. https://www.iofbonehealth.org/new-iof-report-shows-smoking-alcohol-being-underweight-and-poor-nutrition-harm-our-bones. Published October 19, 2007. Accessed April 15, 2018. Moreover, excessive alcohol intake during adolescence and young adulthood has a more profound effect on BMD and osteoporosis risk than drinking too much alcohol later in life.

Some studies have found that, similar to alcohol intake, excessive caffeine consumption has been correlated to decreased BMD, but in other studies moderate caffeine consumption actually improves BMD. Overall, the evidence that caffeine consumption poses a risk for developing osteoporosis is scant, especially when calcium intake is sufficient. Some evidence suggests that carbonated soft drinks negatively affect BMD and increase fracture risk. Their effects, if any, on bone health are not attributed to caffeine content or carbonation. It is probable that any effects of the excessive consumption of soft drinks, caffeinated or not, on bone health can be attributed to the displacement of milk as a dietary source of calcium.

Nutrition

Ensuring adequate nutrition is a key component in maintaining bone health. Having low dietary intakes of calcium and vitamin D are strong risk factors for developing osteoporosis. Another key nutrient for bone health is protein. Remember that the protein collagen comprises almost one third of bone tissue. A diet inadequate in protein is a risk factor for osteoporosis. Multiple large observational studies have shown that diets high in protein increase BMD and reduce fracture risk and that diets low in protein correlate to decreased BMD and increased fracture risk. There has been some debate over whether diets super high in animal protein decreases bone quality by stimulating bone resorption and increasing calcium excretion in the urine. A review in the May 2008 issue of the American Journal of Clinical Nutrition concludes that there is more evidence that diets adequate in protein play a role in maximizing bone health and there is little consistent evidence that suggests high protein diets negatively affect bone health when calcium intake is adequate.Heaney, RP, Layman DK. Amount and Type of Protein Influences Bone Health. The American Journal of Clinical Nutrition. 2008; 87(5), 1567S–70S. http://www.ajcn.org/content/87/5/1567S.long. Accessed April 15, 2018.

Osteoporosis Prevention and Treatment

Although the symptoms of osteoporosis do not occur until old age, osteoporosis is referred to as a childhood disease with old-age consequences. Thus, preventing osteoporosis in old age begins with building strong bones when you are growing. Remember, the more bone mass a person has to start with, the greater the loss a person can withstand without developing osteopenia or osteoporosis. Growing and maintaining healthy bones requires good nutrition, adequate intake of minerals and vitamins that are involved in maintaining bone health, and weight-bearing exercise.

Prevention extends throughout life, and people with one or more risk factors for osteoporosis should have their BMD measured. The National Osteoporosis Foundation recommends the following groups of people get BMD screening:Bone Density Exam/Test. National Osteoporosis Foundation. https://www.nof.org/patients/diagnosis-information/bone-density-examtesting/. Accessed April 15, 2018.

Threats to Health

Chronic Diseases

Chronic diseases are ongoing, life-threatening, and life-altering health challenges. They are the leading cause of death worldwide. Chronic conditions are increasing in frequency. They cause significant physical and emotional suffering and are an impediment to economic growth and vitality. It is important, now more than ever, to understand the different risk factors for chronic disease and to learn how to prevent their development.

The Risk Factors of Chronic Disease

A risk factor is a signal that your chances for acquiring a chronic disease may be increased. You might liken a risk factor to the flags that lifeguards sometimes set up at beaches. When you see these flags, you know immediately that swimming within the marked areas could be hazardous, and that if you choose to swim within these parameters anyway, you are doing so at your own risk. But, if you heed the warnings, you are taking the necessary step to protect your safety and health. Similarly, risk factors are warning signs that coincide with the development and progression of disease. However, risk factors are not a 100-percent guarantee that a person will develop a chronic disease, only that the conditions are right. For example, if a person gets sick with the flu, we can say with certainty that the illness was caused by a virus. However, we cannot say that a sedentary lifestyle caused the onset of cardiovascular disease in a patient, because a risk factor indicates a correlation, not a causation.

Chronic disease usually develops alongside a combination of the following risk factors: genetics, a prior disease such as obesity or hypertension, dietary and lifestyle choices, and environmental problems. Risk factors such as genetics and age cannot be changed. However, some risk factors can be altered to promote health and wellness,such as diet. For example, a person who continuously eats a diet high in sugars, saturated fats, and red meat is at risk for becoming obese and developing Type 2 diabetes, cardiovascular disease, or several other conditions. Making more healthy dietary choices can greatly reduce that risk. Being a woman over age sixty-five is a risk factor for developing osteoporosis, but that cannot be changed. Also, people without a genetic predisposition for a particular chronic illness can still develop it. Not having a genetic predisposition for a chronic disease is not a guarantee of immunity.

Identifying Your Risk Factors

To estimate your own risk factors for developing certain chronic diseases, search through your family’s medical history. What diseases do you note showing up among close blood relatives? At your next physical, pay attention to your blood tests and ask the doctor if any results are out of normal range. It is also helpful to note your vital signs, particularly your blood pressure and resting heart rate. In addition, you may wish to keep a food diary to make a note of the dietary choices that you make on a regular basis and be aware of foods that are high in saturated fat, among other unhealthy options. As a general rule, it is important to look for risk factors that you can modify to promote your health. For example, if you discover that your grandmother, aunt, and uncle all suffered from high blood pressure, then you may decide to avoid a high sodium diet. Identifying your risk factors can arm you with the information you need to help ward off disease.

The Crisis of Obesity

Excessive weight gain has become an epidemic. According to the National Institutes of Health, over two-thirds of American adults are overweight, and one in three is obese. Obesity in particular puts people at risk for a host of complications, including Type 2 diabetes, heart disease, high cholesterol, hypertension, osteoarthritis, and some forms of cancer. The more overweight a person is, the greater his or her risk of developing life-threatening complications. There is no single cause of obesity and no single way to treat it. However, a healthy, nutritious diet is generally the first step, including consuming more fruits and vegetables, whole grains, and lean meats and dairy products.Overweight and Obesity Statistics.National Institute of Diabetes and Digestive and Kidney Diseases. https://www.niddk.nih.gov/health-information/health-statistics/overweight-obesity. Accessed April 15, 2018.

Cardiovascular Disease

Throughout the remainder of this section, we will examine some of the more prevalent chronic diseases, their risk factors, and the choices that can help to discourage their development or progression. Let’s begin with cardiovascular disease. According to the Centers for Disease Control and Prevention (CDC), heart disease is the leading cause of death in the United States.Leading Causes of Death. CDC.gov. https://www.cdc.gov/nchs/fastats/leading-causes-of-death.htm. Updated March 17, 2017. Accessed April 15, 2018.

The disease generally starts with atherosclerosis, or a hardening of the arteries, a chronic condition so common that most people show signs of it by the time they turn thirty. Arteries start to narrow and harden when fats accumulate along their inner walls and form plaques. A plaque is made of fat, cholesterol, calcium, and other substances found in blood.

Plaque formation causes arteries to narrow and harden, which elevates blood pressure because the vessels can’t expand effectively to accommodate blood pulses. Higher blood pressure strains the heart and causes more damage. Arterial walls can become so weakened due to high blood pressure that they balloon and form what is known as an aneurysm. If the aneurysm bursts, it becomes a life-threatening event. The plaques themselves can also rupture due to a spike in blood pressure or a tremor along an arterial wall, and the body responds to this perceived injury by forming blood clots. These clots are serious health threats, whether they are stationary (a thrombus) or moving (an embolus). A stable clot can slowly kill off surrounding tissue, or grow so big that it blocks blood circulation and causes thrombosis. When a moving clot becomes stuck in an artery too small for its passage, it cuts off blood flow and causes cell death. This is referred to as an embolism. Blood clots in heart and brain arteries can cause heart attacks or strokes.

Table 18.2 The Risk Factors for Cardiovascular Disease

Unmodifiable Risk Factors Modifiable Risk Factors
  • Age. Risk increases for men at forty-five, and for women at fifty-five.
  • Sex. Men have a higher risk than women, though the risk for women steeply rises after menopause.
  • Family history. The more family members who have heart disease, the greater the risk.
  • Cigarette smoking. Nicotine constricts blood vessels, and carbon monoxide damages their inner lining, which increases the risk of atherosclerosis.
  • Obesity. Excess weight worsens other risk factors.
  • Diabetes. This condition is associated with an increased risk of heart disease. Both types have certain risk factors in common, including obesity and high blood pressure.
  • Physical inactivity. Lack of exercise is associated with heart disease.
  • Cholesterol levels. High levels of blood cholesterol can increase the risk. A high level of low-density lipoprotein (LDL), or the “bad” cholesterol, is a common contributing factor. However, a low level of high-density lipoprotein (HDL), or “good” cholesterol, can also promote atherosclerosis.

Steps to Reducing the Risk of Cardiovascular Disease

Diet and nutrition can play a significant role in reducing the risk of cardiovascular disease. It is helpful to lower sodium intake, increase consumption of dietary fiber, and limit consumption of saturated fat, which promotes plaque formation. In addition, it is important to replace refined starches and added sugar, which can boost triglycerides, with whole grains, fruits, and vegetables. Eating foods rich in omega-3 fatty acids, especially fish, using alcohol in moderation, and opting for low or no-fat dairy products can all help reduce your cardiovascular disease risk. Emphasizing vegetable-based sources of protein, such as beans and legumes, can be beneficial, as well as consuming more soy products. It is also important to maintain a healthy weight and avoid smoking or chewing tobacco.

Hypertension

Chronic high blood pressure, also known as hypertension, is a significant health hazard affecting one out of three adults in the United States.High Blood Pressure Facts. Center for Disease Control and Prevention. https://www.cdc.gov/bloodpressure/facts.htm. Updated April 5, 2018. Accessed April 15, 2018. This chronic condition is a major cause of heart attacks and strokes, yet it has no symptoms until blood pressure reaches very high levels, which is why it is known as “the silent killer.” The only way to find out if you have high blood pressure is to get an accurate reading of your resting blood pressure rate, which is best done by a medical professional and should be monitored regularly.

High blood pressure is such an important factor in cardiovascular disease, that keeping it within a healthy range is vitally important. Blood pressure readings consist of two numbers. The top number measures systolic pressure (when the heart contracts) and the bottom number measures diastolic pressure (when the heart is at rest). The key blood pressure numbers to keep in mind are:

Table 18.3 The Risk Factors for Hypertension

Unmodifiable Risk Factors Modifiable Risk Factors
  • Age. After fifty-five, the risk of developing high blood pressure is 90 percent.
  • Race. African-Americans are more likely to develop hypertension, manifest it at a younger age, and have higher blood pressure readings.
  • Family history. There is a strong genetic component to high blood pressure, and an individual’s risk goes up along with the number of family members who have hypertension.
  • Weight. Roughly 60 percent of people with hypertension are obese.
  • Sodium consumption. The more salt in a person’s diet, the more likely they are to have high blood pressure.
  • Alcohol. Drinking more than two drinks per day for men and one drink for women increases the likelihood of hypertension.
  • Diet. In addition to salt and alcohol consumption, other dietary factors increase chances of developing hypertension.

Steps to Reducing the Risk of High Blood Pressure

Although it is not possible to change one’s age or genetics, there are actions that people can take to decrease their risk of hypertension. Techniques to reduce blood pressure include becoming physically active, maintaining a healthy weight, reducing sodium intake below 2,400 milligrams per day (or below 1,500 milligrams if you are in a high-risk group or already have been diagnosed with hypertension), using alcohol moderately, and following the DASH diet. Additionally, vitamin C, calcium, and potassium have all been shown to promote healthy blood pressure. It is also vital to monitor your blood pressure levels on a regular basis. Prompt intervention when readings rise above the ideal level (120 over 80) can save lives, which is why everyone should know the status of their blood pressure.

Cancer

More than one hundred diseases are classified as different forms of cancer, all of them characterized by the uncontrolled growth of abnormal cells. Cancer is triggered by mutations in a cell’s genetic material. The cause of these changes may be inherited, or it may result from exposure to carcinogens, which are agents that can cause cancer. Carcinogens include chemicals, viruses, certain medical treatments such as radiation, pollution, or other substances and exposures that are known or suspected to cause cancer.Known and Probable Human Carcinogens. American Cancer Society.http://www.cancer.org/Cancer/CancerCauses/OtherCarcinogens/GeneralInformationaboutCarcinogens/known-and-probable -human-carcinogens. Updated November 3, 2016. Accessed April 15, 2018. The National Institutes of Health has classified fifty-four different compounds as known cancer-causing agents in humans.Israel B. How Many Cancers Are Caused by the Environment?. https://www.scientificamerican.com/article/how-many-cancers-are-caused-by-the-environment. Published May 10, 2010. Accessed April 15, 2018.

Under normal conditions, a healthy cell will either repair any damage that has been done or self destruct so that no future cells will be affected. Cells become cancerous when their DNA is damaged, but they do not self-destruct or stop reproducing as normal cells would. As these abnormal cells continue their rapid growth, in most cancers they coalesce in a mass called a tumor. Cancer cells can overwhelm healthy cells and interfere with the healthy functioning of the body. They can also invade other organs and spread throughout the body in a process known as metastasis. Scientists and the medical community are giving considerable attention to the early stages of cancer, from the moment a healthy cell is exposed to a carcinogen to the point where cells with damaged DNA are replicating out of control. Intervention at any of these early stages could prove to be quite beneficial, because it is thought that most cancers are the result of lifestyle choices and environmental exposure.

The risk factors for different cancers can vary. For example, exposure to ultraviolet radiation from the sun and from tanning beds is a risk factor for skin cancer, while exposure to asbestos is a risk factor for mesothelioma cancer. Table 18.4 “The Risk Factors for Cancer” shows some common risk factors for a number of different types of cancer.

Table 18.4 The Risk Factors for Cancer

Unmodifiable Risk Factors Modifiable Risk Factors
  • Age. Most cancers occur in people over the age of sixty-five. However, people of all ages, including children, can get cancer.
  • Family history. Certain types of cancer have a genetic link. However, environmental factors may also play a part.
  • Tobacco. Smoking or chewing tobacco greatly increases the risk for certain cancers, including cancer of the lungs, bladder, cervix, kidneys, mouth, and pancreas.
  • Alcohol. Drinking alcohol is linked to cancers of the mouth, throat, esophagus, and breast, as well as to cancers of the neck and head.
  • Obesity. Linked to cancers of the colon, uterus, pancreas, esophagus, kidney, and breast.
  • Cooking techniques. Grilling, smoking, and preparing meat at high temperatures forms carcinogens.
  • Red meat. The risk of colon cancer seems to increase with the consumption of red meat and processed meat.
  • Cured meats. According to a recent study, there is a mild risk of pancreatic cancer with the consumption of cured meats, such as sausage, pepperoni, bacon, ham, smoked turkey, salami, and hot dogs.
  • Physical inactivity. Linked to colon, breast, and other cancers.
  • Exposure to chemicals. People who have jobs that expose them to chemicals on a regular basis, such as construction workers and painters, have an increased risk of cancer.
  • Viruses or bacteria. Certain viruses or bacteria may increase the risk of developing cancer. For example, human papillomaviruses, which are sexually transmitted, are the primary cause of cervical cancer.

Steps to Reducing the Risk of Cancer

According to the American Cancer Society, half of all American men and one-third of American women will be diagnosed with some form of cancer in their lifetime.What Is Cancer? American Cancer Society. http://www.cancer.org/Cancer/CancerBasics/what-is-cancer. Updated December 8, 2015. Accessed April 15, 2018. Although cancer is one of the leading causes of death worldwide, ongoing research and innovations in treatment have improved the outlook for cancer patients to the point where millions now survive or live with cancer, making it a chronic disease.

The American Institute for Cancer Research (AICR) has published guidelines for preventing cancer and staying healthy. They include several dietary and lifestyle choices, such as participating in physical activity for thirty minutes per day or more, and maintaining a healthy weight. In addition, AICR recommends consuming a plant-based diet.Cancer Prevention and Early Detection Facts and Figures 2013. American Cancer Society. https://www.cancer.org/content/dam/cancer-org/research/cancer-facts-and-statistics/cancer-prevention-and-early-detection-facts-and-figures/cancer-prevention-and-early-detection-facts-and-figures-2013.pdf. Published 2013. Accessed April 15, 2018.

Several epidemiological studies have found a link between eating plenty of fruits and vegetables and a low incidence of certain cancers. Fruits and vegetables containing a wide variety of nutrients and phytochemicals may either prevent or reduce the oxidative damage to cell structures. Cruciferous vegetables, such as cauliflower, broccoli, and Brussels sprouts, may also reduce the risk of certain cancers, such as endometrial, esophageal, and others. Also, studies have shown that the more fiber you have in your diet, the lower your risk of colon cancer.

Supplementation may also be helpful to a limited degree. Vitamin D and antioxidants have been linked to lowering the risk of some cancers (however taking an iron supplement may promote others), but, obtaining vital nutrients from food first is the best way to help prevent or manage cancer. In addition, regular and vigorous exercise can lower the risk of breast and colon cancers, among others. Also, wear sunblock, stay in the shade, and avoid the midday sun to protect yourself from skin cancer, which is one of the most common kinds of cancer.Cancer Prevention: 7 Steps to Reduce Your Risk. Mayo Clinic. http://www.mayoclinic.com/health/cancer -prevention/CA00024. Updated November 29, 2017. Accessed April 15, 2018.

Diabetes

What Is Diabetes?

Diabetes is one of the top three diseases in America. It affects millions of people and causes tens of thousands of deaths each year. Diabetes is a metabolic disease of insulin deficiency and glucose over-sufficiency. Like other diseases, genetics, nutrition, environment, and lifestyle are all involved in determining a person’s risk for developing diabetes. One sure way to decrease your chances of getting diabetes is to maintain an optimal body weight by adhering to a diet that is balanced in carbohydrate, fat, and protein intake. There are three different types of diabetes: Type 1 diabetes, Type 2 diabetes, and gestational diabetes.

Type 1 Diabetes

Type 1 diabetes is a metabolic disease in which insulin-secreting cells in the pancreas are killed by an abnormal response of the immune system, causing a lack of insulin in the body. Its onset typically occurs before the age of thirty. The only way to prevent the deadly symptoms of this disease is to inject insulin under the skin.

A person with Type 1 diabetes usually has a rapid onset of symptoms that include hunger, excessive thirst and urination, and rapid weight loss. Because the main function of glucose is to provide energy for the body, when insulin is no longer present there is no message sent to cells to take up glucose from the blood. Instead, cells use fat and proteins to make energy, resulting in weight loss. If Type 1 diabetes goes untreated individuals with the disease will develop a life-threatening condition called ketoacidosis. This condition occurs when the body uses fats and not glucose to make energy, resulting in a build-up of ketone bodies in the blood. It is a severe form of ketosis with symptoms of vomiting, dehydration, rapid breathing, and confusion and eventually coma and death. Upon insulin injection these severe symptoms are treated and death is avoided. Unfortunately, while insulin injection prevents death, it is not considered a cure. People who have this disease must adhere to a strict diet to prevent the development of serious complications. Type 1 diabetics are advised to consume a diet low in the types of carbohydrates that rapidly spike glucose levels (high-GI foods), to count the carbohydrates they eat, to consume healthy-carbohydrate foods, and to eat small meals frequently. These guidelines are aimed at preventing large fluctuations in blood glucose. Frequent exercise also helps manage blood-glucose levels. Type 1 diabetes accounts for between 5 and 10 percent of diabetes cases.

Type 2 Diabetes

The other 90 to 95 percent of diabetes cases are Type 2 diabetes. Type 2 diabetes is defined as a metabolic disease of insulin insufficiency, but it is also caused by muscle, liver, and fat cells no longer responding to the insulin in the body (Figure 18.4 “Healthy Individuals and Type 2 Diabetes” . In brief, cells in the body have become resistant to insulin and no longer receive the full physiological message of insulin to take up glucose from the blood. Thus, similar to patients with Type 1 diabetes, those with Type 2 diabetes also have high blood-glucose levels.

Figure 18.4 Healthy Individuals and Type 2 Diabetes

For Type 2 diabetics, the onset of symptoms is more gradual and less noticeable than for Type 1 diabetics. The first stage of Type 2 diabetes is characterized by high glucose and insulin levels. This is because the insulin-secreting cells in the pancreas attempt to compensate for insulin resistance by making more insulin. In the second stage of Type 2 diabetes, the insulin-secreting cells in the pancreas become exhausted and die. At this point, Type 2 diabetics also have to be treated with insulin injections. Healthcare providers is to prevent the second stage from happening. As with Type 1 diabetes, chronically high-glucose levels cause big detriments to health over time, so another goal for patients with Type 2 diabetes is to properly manage their blood-glucose levels. The front-line approach for treating Type 2 diabetes includes eating a healthy diet and increasing physical activity.

The Centers for Disease Control Prevention (CDC) estimates that as of 2010, 25.8 million Americans have diabetes, which is 8.3 percent of the population.Diabetes Research and Statistics.Centers for Disease Control and Prevention. https://www.cdc.gov/diabetes/data/index.html. Updated March 14, 2018.  Accessed April 15, 2018. In 2007 the cost of diabetes to the United States was estimated at $174 billion.Diabetes Quick Facts. Centers for Disease Control and Prevention. https://www.cdc.gov/diabetes/basics/quick-facts.html. Updated July 24, 2017. Accessed April 15, 2018. The incidence of Type 2 diabetes has more than doubled in America in the past thirty years and the rise is partly attributed to the increase in obesity in this country. Genetics, environment, nutrition, and lifestyle all play a role in determining a person’s risk for Type 2 diabetes. We have the power to change some of the determinants of disease but not others. The Diabetes Prevention Trial that studied lifestyle and drug interventions in more than three thousand participants who were at high risk for Type 2 diabetes found that intensive lifestyle intervention reduced the chances of getting Type 2 diabetes by 58 percent.Knowler WC. Reduction in the Incidence of Type 2 Diabetes with Lifestyle Intervention or Metformin. The New England Journal of Medicine. 2002; 346(6), 393–403. http://www.nejm.org/doi/full/10.1056/NEJMoa012512. Accessed April 15, 2018.

Gestational Diabetes

During pregnancy some women develop gestational diabetes. Gestational diabetes is characterized by high blood-glucose levels and insulin resistance. The exact cause is not known but does involve the effects of pregnancy hormones on how cells respond to insulin. Gestational diabetes can cause pregnancy complications and it is common practice for healthcare practitioners to screen pregnant women for this metabolic disorder. The disorder normally ceases when the pregnancy is over, but the National Diabetes Information Clearing House notes that women who had gestational diabetes have between a 40 and 60 percent likelihood of developing Type 2 diabetes within the next ten years.Diabetes Overview. National Institute of Diabetes and Digestive and Kidney Disease. https://www.niddk.nih.gov/health-information/diabetes/overview. Accessed April 15, 2018.   Gestational diabetes not only affects the health of a pregnant woman but also is associated with an increased risk of obesity and Type 2 diabetes in her child.

Prediabetes

As the term infers, prediabetes is a metabolic condition in which people have moderately high glucose levels, but do not meet the criteria for diagnosis as a diabetic. Over seventy-nine million Americans are prediabetic and at increased risk for Type 2 diabetes and cardiovascular disease.Diabetes Overview. National Institute of Diabetes and Digestive and Kidney Disease. https://www.niddk.nih.gov/health-information/diabetes/overview. Accessed April 15, 2018.   The National Diabetes Information Clearing House reports that 35 percent of adults aged twenty and older, and 50 percent of those over the age of sixty-five have prediabetes.Diabetes Overview. National Institute of Diabetes and Digestive and Kidney Disease. https://www.niddk.nih.gov/health-information/diabetes/overview. Accessed April 15, 2018.  

Long-Term Health Consequences of Diabetes

The long-term health consequences of diabetes are severe. They are the result of chronically high glucose concentrations in the blood accompanied by other metabolic abnormalities such as high blood-lipid levels. People with diabetes are between two and four times more likely to die from cardiovascular disease. Diabetes is the number one cause of new cases of blindness, lower-limb amputations, and kidney failure. Many people with diabetes develop peripheral neuropathy, characterized by muscle weakness, loss of feeling and pain in the lower extremities. More recently, there is scientific evidence to suggest people with diabetes are also at increased risk for Alzheimer’s disease.

Diabetes Treatment

Keeping blood-glucose levels in the target range (70–130 mg/dL before a meal) requires careful monitoring of blood-glucose levels with a blood-glucose meter, strict adherence to a healthy diet, and increased physical activity. Type 1 diabetics begin insulin injections as soon as they are diagnosed. Type 2 diabetics may require oral medications and insulin injections to maintain blood-glucose levels in the target range. The symptoms of high blood glucose, also called hyperglycemia, are difficult to recognize, diminish in the course of diabetes, and are mostly not apparent until levels become very high. The symptoms are increased thirst and frequent urination. Having too low blood glucose levels, known as hypoglycemia, is also detrimental to health. Hypoglycemia is more common in Type 1 diabetics and is most often caused by injecting too much insulin or injecting it at the wrong time. The symptoms of hypoglycemia are more acute including shakiness, sweating, nausea, hunger, clamminess, fatigue, confusion, irritability, stupor, seizures, and coma. Hypoglycemia can be rapidly and simply treated by eating foods containing about ten to twenty grams of fast-releasing carbohydrates. If symptoms are severe a person is either treated by emergency care providers with an intravenous solution of glucose or given an injection of glucagon, which mobilizes glucose from glycogen in the liver. Some people who are not diabetic may experience reactive hypoglycemia. This is a condition in which people are sensitive to the intake of sugars, refined starches, and high GI foods. Individuals with reactive hypoglycemia have some symptoms of hypoglycemia. Symptoms are caused by a higher than normal increase in blood-insulin levels. This rapidly decreases blood-glucose levels to a level below what is required for proper brain function.

The major determinants of Type 2 diabetes that can be changed are overnutrition and a sedentary lifestyle. Therefore, reversing or improving these factors by lifestyle interventions markedly improve the overall health of Type 2 diabetics and lower blood-glucose levels. In fact it has been shown that when people are overweight, losing as little as nine pounds (four kilograms) decreases blood-glucose levels in Type 2 diabetics. The Diabetes Prevention Trial demonstrated that by adhering to a diet containing between 1,200 and 1,800 kilocalories per day with a dietary fat intake goal of less than 25 percent and increasing physical activity to at least 150 minutes per week, people at high risk for Type 2 diabetes achieved a weight loss of 7 percent and significantly decreased their chances of developing Type 2 diabetes.Knowler WC. Reduction in the Incidence of Type 2 Diabetes with Lifestyle Intervention or Metformin. The New England Journal of Medicine. 2002; 346(6), 393–403. http://www.nejm.org/doi/full/10.1056/NEJMoa012512. Accessed April 15, 2018.

The American Diabetes Association (ADA) has a website that provides information and tips for helping diabetics answer the question, “What Can I Eat”. In regard to carbohydrates the ADA recommends diabetics keep track of the carbohydrates they eat and set a limit. These dietary practices will help keep blood-glucose levels in the target range.

Figure 18.5 Metabolic Syndrome: A Combination of Risk Factors Increasing the Chances for Chronic Disease

Having more than one risk factor for Type 2 diabetes substantially increases a person’s chances for developing the disease. Metabolic syndrome refers to a medical condition in which people have three or more risk factors for Type 2 diabetes and cardiovascular disease. According to the International Diabetes Federation (IDF) people are diagnosed with this syndrome if they have central (abdominal) obesity and any two of the following health parameters: triglycerides greater than 150 mg/dL; high density lipoproteins (HDL) lower than 40 mg/dL; systolic blood pressure above 100 mmHg, or diastolic above 85 mmHg; fasting blood-glucose levels greater than 100 mg/dL.The IDF Consensus Worldwide Definition of the Metabolic Syndrome. International Diabetes Federation.https://www.idf.org/our-activities/advocacy-awareness/resources-and-tools/60:idfconsensus-worldwide-definitionof-the-metabolic-syndrome.html. Accessed April 15, 2018.    The IDF estimates that between 20 and 25 percent of adults worldwide have metabolic syndrome. Studies vary, but people with metabolic syndrome have between a 9 and 30 times greater chance for developing Type 2 diabetes than those who do not have the syndrome.The IDF Consensus Worldwide Definition of the Metabolic Syndrome. International Diabetes Federation.https://www.idf.org/our-activities/advocacy-awareness/resources-and-tools/60:idfconsensus-worldwide-definitionof-the-metabolic-syndrome.html. Accessed April 15, 2018.

Everyday Connection

In 2010, the Pacific Islands Health Officers Association declared a regional state of health emergency for the epidemic of chronic diseases in the United States Affiliated Pacific (USAP). Due to the high risk factors that many of these Pacific Islanders, the leading cause of mortality of adults in the USAP from chronic diseases. To learn more about this declaration, visit http://www.pihoa.org/fullsite/newsroom/wp-content/uploads/downloads/2012/06/NCD_Emergency_Declaration.pdf

Disease Prevention and Management

Eating fresh, healthy foods not only stimulates your taste buds, but also can improve your quality of life and help you to live longer. As discussed, food fuels your body and helps you to maintain a healthy weight. Nutrition also contributes to longevity and plays an important role in preventing a number of diseases and disorders, from obesity to cardiovascular disease. Some dietary changes can also help to manage certain chronic conditions, including high blood pressure and diabetes. A doctor or a nutritionist can provide guidance to determine the dietary changes needed to ensure and maintain your health.

Undernutrition, Overnutrition, and Malnutrition

For many, the word “malnutrition” produces an image of a child in a third-world country with a bloated belly, and skinny arms and legs. However, this image alone is not an accurate representation of the state of malnutrition. For example, someone who is 150 pounds overweight can also be malnourished.

Malnutrition refers to one not receiving proper nutrition and does not distinguish between the consequences of too many nutrients or the lack of nutrients, both of which impair overall health. Undernutrition is characterized by a lack of nutrients and insufficient energy supply, whereas overnutrition is characterized by excessive nutrient and energy intake. Overnutrition can result in obesity, a growing global health threat. Obesity is defined as a metabolic disorder that leads to an overaccumulation of fat tissue.

Although not as prevalent in America as it is in developing countries, undernutrition is not uncommon and affects many subpopulations, including the elderly, those with certain diseases, and those in poverty. Many people who live with diseases either have no appetite or may not be able to digest food properly. Some medical causes of malnutrition include cancer, inflammatory bowel syndrome, AIDS, Alzheimer’s disease, illnesses or conditions that cause chronic pain, psychiatric illnesses, such as anorexia nervosa, or as a result of side effects from medications. Overnutrition is an epidemic in the United States and is known to be a risk factor for many diseases, including Type 2 diabetes, cardiovascular disease, inflammatory disorders (such as rheumatoid arthritis), and cancer.

Health Risks of Being Underweight

The 2003–2006 National Health and Nutrition Examination Survey (NHANES) estimated that 1.8 percent of adults and 3.3 percent of children and adolescents in the United States are underweight.Prevalence of Underweight among Children and Adolescents: United States, 2003–2006. Centers for Disease Control and Prevention. http://www.cdc.gov/nchs/data/hestat/underweight/underweight_children.htm. Updated November 6, 2015. Accessed April 15, 2018.

Being underweight is linked to nutritional deficiencies, especially iron-deficiency anemia, and to other problems such as delayed wound healing, hormonal abnormalities, increased susceptibility to infection, and increased risk of some chronic diseases such as osteoporosis. In children, being underweight can stunt growth. The most common underlying cause of underweight in America is inadequate nutrition. Other causes are wasting diseases, such as cancer, multiple sclerosis, tuberculosis, and eating disorders. People with wasting diseases are encouraged to seek nutritional counseling, as a healthy diet greatly affects survival and improves responses to disease treatments. Eating disorders that result in underweight affect about eight million Americans (seven million women and one million men).

Anorexia Nervosa

Anorexia nervosa, more often referred to as “anorexia,” is a psychiatric illness in which a person obsesses about their weight and about food that they eat. Anorexia results in extreme nutrient inadequacy and eventually to organ malfunction. Anorexia is relatively rare—the National Institute of Mental Health (NIMH) reports that 0.9 percent of females and 0.3 percent of males will have anorexia at some point in their lifetime, but it is an extreme example of how an unbalanced diet can affect health.Eating Disorders. The National Institute of Mental Health. https://www.nimh.nih.gov/health/statistics/eating-disorders.shtml#part_155061. Accessed April 15, 2018.

Anorexia frequently manifests during adolescence and it has the highest rate of mortality of all mental illnesses. People with anorexia consume, on average, fewer than 1,000 kilocalories per day and exercise excessively. They are in a tremendous caloric imbalance. Moreover, some may participate in binge eating, self-induced vomiting, and purging with laxatives or enemas. The very first time a person starves him- or herself may trigger the onset of anorexia. The exact causes of anorexia are not completely known, but many things contribute to its development including economic status, as it is most prevalent in high-income families. It is a genetic disease and is often passed from one generation to the next. Pregnancy complications and abnormalities in the brain, endocrine system, and immune system may all contribute to the development of this illness.

The primary signs of anorexia are fear of being overweight, extreme dieting, an unusual perception of body image, and depression. The secondary signs and symptoms of anorexia are all related to the caloric and nutrient deficiencies of the unbalanced diet and include excessive weight loss, a multitude of skin abnormalities, diarrhea, cavities and tooth loss, osteoporosis, and liver, kidney, and heart failure. There is no physical test that can be used to diagnose anorexia and distinguish it from other mental illnesses. Therefore a correct diagnosis involves eliminating other mental illnesses, hormonal imbalances, and nervous system abnormalities. Eliminating these other possibilities involves numerous blood tests, urine tests, and x-rays. Coexisting organ malfunction is also examined. Treatment of any mental illness involves not only the individual, but also family, friends, and a psychiatric counselor. Treating anorexia also involves a dietitian, who helps to provide dietary solutions that often have to be adjusted over time. The goals of treatment for anorexia are to restore a healthy body weight and significantly reduce the behaviors associated with causing the eating disorder. Relapse to an unbalanced diet is high. Many people do recover from anorexia, however most continue to have a lower-than-normal body weight for the rest of their lives.

Bulimia

Bulimia, like anorexia, is a psychiatric illness that can have severe health consequences. The NIMH reports that 0.5 percent of females and 0.1 percent of males will have bulimia at some point in their lifetime.Eating Disorders. The National Institute of Mental Health. https://www.nimh.nih.gov/health/statistics/eating-disorders.shtml#part_155061. Accessed April 15, 2018.

Bulimia is characterized by episodes of eating large amounts of food followed by purging, which is accomplished by vomiting and with the use of laxatives and diuretics. Unlike people with anorexia, those with bulimia often have a normal weight, making the disorder more difficult to detect and diagnose. The disorder is characterized by signs similar to anorexia such as fear of being overweight, extreme dieting, and bouts of excessive exercise. Secondary signs and symptoms include gastric reflux, severe erosion of tooth enamel, dehydration, electrolyte imbalances, lacerations in the mouth from vomiting, and peptic ulcers. Repeated damage to the esophagus puts people with bulimia at an increased risk for esophageal cancer. The disorder is also highly genetic, linked to depression and anxiety disorders, and most commonly occurs in adolescent girls and young women. Treatment often involves antidepressant medications and, like anorexia, has better results when both the family and the individual with the disorder participate in nutritional and psychiatric counseling.

Binge-Eating Disorder

Similar to those who experience anorexia and bulimia, people who have a binge-eating disorder have lost control over their eating. Binge-eating disorder is not currently diagnosed as a distinct psychiatric illness, although there is a proposal from the American Psychiatric Association to categorize it more specifically. People with binge-eating disorder will periodically overeat to the extreme, but their loss of control over eating is not followed by fasting, purging, or compulsive exercise. As a result, people with this disorder are often overweight or obese, and their chronic disease risks are those linked to having an abnormally high body weight such as hypertension, cardiovascular disease, and Type 2 diabetes. Additionally, they often experience guilt, shame, and depression. Binge-eating disorder is commonly associated with depression and anxiety disorders. According to the NIMH, binge-eating disorder is more prevalent than anorexia and bulimia, and affects 3.5 percent of females and 2.0 percent of males at some point during their lifetime.Eating Disorders. The National Institute of Mental Health. https://www.nimh.nih.gov/health/statistics/eating-disorders.shtml#part_155061. Accessed April 15, 2018. Treatment often involves antidepressant medication as well as nutritional and psychiatric counseling.

The Healing Process

With all wounds, from a paper cut to major surgery, the body must heal itself. Healing is facilitated through proper nutrition while malnutrition inhibits and complicates this vital process. The following nutrients are important for proper healing:MacKay D, Miller AL. Nutritional Support for Wound Healing. Alternative Medicine Review. 2003 8(4),  359–77. https://www.ncbi.nlm.nih.gov/pubmed/14653765. Accessed April 15, 2018.


Food Insecurity

Addressing Hunger

Government agencies also play an important role in addressing hunger via federal food-assistance programs. The agencies provide debit cards (formerly distributed in the form of food vouchers or food stamps) to consumers to help them purchase food and they also provide other forms of aid to low-income adults and families who face hunger and nutritional deficits. This topic will be discussed in greater detail later in this chapter.

Hunger relates to appetite and is the body’s response to a need for nourishment. Through stomach discomfort or intestinal rumbling, the body alerts the brain that it requires food. This uneasy sensation is easily addressed with a snack or a full meal. However, the term “hunger” also relates to a weakened condition that is a consequence of a prolonged lack of food. People who suffer from this form of hunger typically experience malnourishment, along with poor growth and development.

Hunger

Adequate food intake that meets nutritional requirements is essential to achieve a healthy, productive lifestyle. However, millions of people in North America, not to mention globally, go hungry and are malnourished each year due to a recurring and involuntary lack of food. The economic crisis of 2008 caused a dramatic increase in hunger across the United States.Hunger in America: 2016 United States Hunger and Poverty Facts. World Hunger Education Service. Retrieved from http://www.worldhunger.org/articles/Learn/us_hunger_facts.htm. Accessed April 15, 2018.

In 2010, 925 million people around the world were classified as hungry. Although this was a decrease from a historic high of more than one billion people from the previous year, it is still an unbearable number. Every night, millions and millions of people go to sleep hungry due to a lack of the money or resources needed to acquire an adequate amount of food. This graph shows the division of hungry people around the globe. A number of terms are used to categorize and classify hunger. Two key terms, food security and food insecurity, focus on status and affect hunger statistics. Another term, malnutrition, refers to the deficiencies that a hungry person experiences.

Food Security

Most American households are considered to be food secure, which means they have adequate access to food and consume enough nutrients to achieve a healthy lifestyle. However, a minority of US households experiences food insecurity at certain points during the year, which means their access to food is limited due to a lack of money or other resources. This graphic shows the percentage of food-secure and food-insecure households in the United States during the year 2010.

Food Insecurity

Food insecurity is defined as not having adequate access to food that meets nutritional needs. According to the USDA, about 48.8 million people live in food-insecure households and have reported multiple indications of food access problems. About sixteen million of those have “very low food security,” which means one or more people in the household were hungry at some point over the course of a year due to the inability to afford enough food. The difference between low and very low food security is that members of low insecurity households have reported problems of food access, but have reported only a few instances of reduced food intake, if any.Coleman-Jensen A. Household Food Security in the United States in 2010. US Department of Agriculture, Economic Research Report, no. ERR-125. 2011.  https://www.ers.usda.gov/publications/pub-details/?pubid=44909. Accessed April 15, 2018. African American and Hispanic households experience food insecurity at much higher rates than the national average.Coleman-Jensen A. Household Food Security in the United States in 2010. US Department of Agriculture, Economic Research Report, no. ERR-125. 2011.  https://www.ers.usda.gov/publications/pub-details/?pubid=44909. Accessed April 15, 2018.

Households with limited resources employ a variety of methods to increase their access to adequate food. Some families purchase junk food and fast food—cheaper options that are also very unhealthy. Other families who struggle with food security supplement the groceries they purchase by participating in government assistance programs. They may also obtain food from emergency providers, such as food banks and soup kitchens in their communities.

Malnutrition

A person living in a food-insecure household may suffer from malnutrition, which results from a failure to meet nutrient requirements. This can occur as a result of consuming too little food or not enough key nutrients. There are two basic types of malnutrition. The first is macronutrient deficiency and relates to the lack of adequate protein, which is required for cell growth, maintenance, and repair. The second type of malnutrition is micronutrient deficiency and relates to inadequate vitamin and mineral intake.Hunger in America: 2016 United States Hunger and Poverty Facts. World Hunger Education Service. Retrieved from http://www.worldhunger.org/articles/Learn/us_hunger_facts.htm. Accessed April 15, 2018. Even people who are overweight or obese can suffer from this kind of malnutrition if they eat foods that do not meet all of their nutritional needs.

Worldwide, three main groups are most at risk of hunger: the rural poor in developing nations who also lack access to electricity and safe drinking water, the urban poor who live in expanding cities and lack the means to buy food, and victims of earthquakes, hurricanes, and other natural and man-made catastrophes.SOFI: Questions and Answers. Food and Agriculture Organization of the United Nations. http://www.fao.org/3/a-BT851E.pdf. Accessed April 15, 208.

In the United States, there are additional subgroups that are at risk and are more likely than others to face hunger and malnutrition. They include low-income families and the working poor, who are employed but have incomes below the federal poverty level.

Senior citizens are also a major at-risk group. Many elderly people are frail and isolated, which affects their ability to meet their dietary requirements. In addition, many also have low incomes, limited resources, and difficulty purchasing or preparing food due to health issues or poor mobility. As a result, more than six million senior citizens in the United States face the threat of hunger.About Meals on Wheels. Meals on Wheels. https://www.mealsonwheelsamerica.org/signup/aboutmealsonwheels. Accessed April 15, 2018.

One of the groups that struggles with hunger are the millions of homeless people across North America. According to a recent study by the US Conference of Mayors, the majority of reporting cities saw an increase in the number of homeless families.Hunger and Homelessness Survey: A Status Report on Hunger and Homelessness in America’s Cities, a 27-City Survey. The United States Conference of Mayors. https://endhomelessness.atavist.com/mayorsreport2016. Accessed April 15, 2018.    Hunger and homelessness often go hand-in-hand as homeless families and adults turn to soup kitchens or food pantries or resort to begging for food.

Rising hunger rates in the United States particularly affect children. Nearly one out of four children, or 21.6 percent of all American children, lives in a food-insecure household and spends at least part of the year hungry.Coleman-Jensen A. Household Food Security in the United States in 2010. US Department of Agriculture, Economic Research Report, no. ERR-125. 2011.  https://www.ers.usda.gov/publications/pub-details/?pubid=44909. Accessed April 15, 2018. Hunger delays their growth and development and affects their educational progress because it is more difficult for hungry or malnourished students to concentrate in school. In addition, children who are undernourished are more susceptible to contracting diseases, such as measles and pneumonia.2011 World Hunger and Poverty Facts and Statistics. World Hunger Education Service.https://www.worldhunger.org/articles/Learn/old/world%20hunger%20facts%202002in2011.htm. Accessed April 15, 2018.

Government Programs

The federal government has established a number of programs that work to alleviate hunger and ensure that many low-income families receive the nutrition they require to live a healthy life. A number of programs were strengthened by the passage of the Healthy, Hunger-Free Kids Act of 2010. This legislation authorized funding and set the policy for several key core programs that provide a safety net for food-insecure children across the United States.

The federal poverty level (FPL) is used to determine eligibility for food-assistance programs. This monetary figure is the minimum amount that a family would need to acquire shelter, food, clothing, and other necessities. It is calculated based on family size and is adjusted for annual inflation. Although many people who fall below the FPL are unemployed, the working poor can qualify for food programs and other forms of public assistance if their income is less than a certain percentage of the federal poverty level, along with other qualifications.

USDA Food Assistance Programs

Government food and nutrition assistance programs that are organized and operated by the USDA work to increase food security. They provide low-income households with access to food, the tools for consuming a healthy diet, and education about nutrition. The USDA monitors the extent and severity of food insecurity via an annual survey. This contributes to the efficiency of food assistance programs as well as the effectiveness of private charities and other initiatives aimed at reducing food insecurity.Coleman-Jensen A. Household Food Security in the United States in 2010. US Department of Agriculture, Economic Research Report, no. ERR-125. 2011.  https://www.ers.usda.gov/publications/pub-details/?pubid=44909. Accessed April 15, 2018.

The Supplemental Nutrition Assistance Program

Formerly known as the Food Stamp Program, the Supplemental Nutrition Assistance Program (SNAP) provides monthly benefits for low-income households to purchase approved food items at authorized stores. Clients qualify for the program based on available household income, assets, and certain basic expenses. In an average month, SNAP provides benefits to more than forty million people in the United States.Coleman-Jensen A. Household Food Security in the United States in 2010. US Department of Agriculture, Economic Research Report, no. ERR-125. 2011.  https://www.ers.usda.gov/publications/pub-details/?pubid=44909. Accessed April 15, 2018. The program provides Electronic Benefit Transfers (EBT) which work similarly to a debit card. Clients receive a card with a certain allocation of money for each month that can be used only for food. In 2010, the average benefit was about $134 per person, per month and total federal expenditures for the program were $68.2 billion.Coleman-Jensen A. Household Food Security in the United States in 2010. US Department of Agriculture, Economic Research Report, no. ERR-125. 2011.  https://www.ers.usda.gov/publications/pub-details/?pubid=44909. Accessed April 15, 2018.

The Special, Supplemental Program for Women, Infants, and Children

The Special, Supplemental Program for Women, Infants and Children (WIC) provides food packages to pregnant and breastfeeding women, as well as to infants and children up to age five, to promote adequate intake for healthy growth and development. Most state WIC programs provide vouchers that participants use to acquire supplemental packages at authorized stores. In 2010, WIC served approximately 9.2 million participants per month at an average monthly cost of about forty-two dollars per person.Coleman-Jensen A. Household Food Security in the United States in 2010. US Department of Agriculture, Economic Research Report, no. ERR-125. 2011.  https://www.ers.usda.gov/publications/pub-details/?pubid=44909. Accessed April 15, 2018.

The National School Lunch Program

The National School Lunch Program (NSLP) and School Breakfast Program (SBP) ensure that children in elementary and middle schools receive at least one healthy meal each school day, or two if both the NSLP and SBP are provided. According to the USDA, these programs operate in over 101,000 public and nonprofit private schools and residential child-care institutions.National School Lunch Program. US Department of Agriculture. https://www.fns.usda.gov/nslp/national-school-lunch-program-nslp. Accessed April 15, 2018. In 2010, the programs provided meals to an average of 31.6 million children each school day. Fifty-six percent of the lunches served were free, and an additional 10 percent were provided at reduced prices.

Meals on Wheels

An organization known as Meals on Wheels delivers meals to elderly people who have difficulty buying or making their own food because of poor health or limited mobility. It is the oldest and largest program dedicated to addressing the nutritional needs of senior citizens. Each day, Meals on Wheels volunteers deliver more than one million meals across the United States. The first Meals on Wheels program began in Philadelphia in the 1950s. In the decades since, the organization has expanded into a vast network that serves the elderly in all fifty states and several US territories. Today, Meals on Wheels remains committed to ending hunger among the senior citizen community.The Problem and Our Solution. Meals on Wheels. https://www.mealsonwheelsamerica.org/theissue/problemandsolution. Accessed April 15, 2018.

Nutrition and Your Health

The adage, “you are what you eat,” seems to be more true today than ever. In recent years, consumers have become more conscientious about the decisions they make in the supermarket. Organically grown food is the fastest growing segment of the food industry. Also, farmers’ markets and chains that are health-food-oriented are thriving in many parts of North America. Shoppers have begun to pay more attention to the effect of food on their health and well-being. That includes not only the kinds of foods that they purchase, but also the manner in which meals are cooked and consumed. The preparation of food can greatly affect its nutritional value. Also, studies have shown that eating at a table with family members or friends can promote both health and happiness.

Careers in Nutrition

If you are considering a career in nutrition, it is important to understand the opportunities that may be available to you. Both dietitians and nutritionists provide nutrition-related services to people in the private and public sectors. A dietitian is a healthcare professional who has registered credentials and can provide nutritional care in the areas of health and wellness for both individuals and groups. A nutritionist is an unregistered professional who may have the credentials of a dietitian, or may have acquired the knowledge via other avenues. People in both professions work to apply nutritional science, using evidence-based best practices, to help people nourish their bodies and improve their lives.

Becoming a registered dietitian requires a Bachelor’s or Master’s degree in dietetics, including courses in biology, chemistry, biochemistry, microbiology, anatomy and physiology, nutrition, and food-service management. Other suggested courses include economics, business, statistics, computer science, psychology, and sociology. In addition, people who pursue this path must complete a dietetic internship and pass a national exam. Also, some states have licensure that requires additional forms and documentation. To become a registered dietetic technician you must complete a dietetic technician program that involves supervised practice. Forty-seven states have licensure requirements for registered dietitians and nutritionists. A few remaining states do not have laws that regulate this profession.Dietitians and Nutritionists. Bureau of Labor Statistics. Occupational Outlook Handbook, 2010-11 Edition. https://www.bls.gov/ooh/healthcare/dietitians-and-nutritionists.htm. Updated April 13, 2018. Accessed April 15, 2018. Go to https://www.cdrnet.org/certifications to learn more.

Working in Nutrition

Dietitians and nutritionists plan food and nutrition programs, promote healthy eating habits, and recommend dietary modifications. For example, a dietitian might teach a patient with hypertension how to follow the DASH diet and reduce their sodium intake. Nutrition-related careers can be extremely varied. Some individuals work in the government, while others are solely in the private sector. Some jobs in nutrition focus on working with athletes, while others provide guidance to patients with long-term, life-threatening diseases. But no matter the circumstance or the clientele, working in the field of diet and nutrition focuses on helping people improve their dietary habits by translating nutritional science into food choices.

In the public sector, careers in nutrition span from government work to community outreach. Nutritionists and dietitians who work for the government may become involved with federal food programs, federal agencies, communication campaigns, or creating and analyzing public policy. On the local level, clinical careers include working in hospitals and nursing-care facilities. This requires creating meal plans and providing nutritional guidance to help patients restore their health or manage chronic conditions. Clinical dietitians also confer with doctors and other health-care professionals to coordinate dietary recommendations with medical needs. Nutrition jobs in the community often involve working in public health clinics, cooperative extension offices, and HMOs to prevent disease and promote the health of the local community. Nutrition jobs in the nonprofit world involve anti-hunger organizations, public health organizations, and activist groups.

Nutritionists and dietitians can also find work in the private sector. Increased public awareness of food, diet, and nutrition has led to employment opportunities in advertising, marketing, and food manufacturing. Dietitians working in these areas analyze foods, prepare marketing materials, or report on issues such as the impact of vitamins and herbal supplements. Consultant careers can include working in wellness programs, supermarkets, physicians’ offices, gyms, and weight-loss clinics. Consultants in private practice perform nutrition screenings for clients and use their findings to provide guidance on diet-related issues, such as weight reduction. Nutrition careers in the corporate world include designing wellness strategies and nutrition components for companies, working as representatives for food or supplement companies, designing marketing and educational campaigns, and becoming lobbyists. Others in the private sector work in food-service management at health-care facilities or at company and school cafeterias. Sustainable agricultural practices are also providing interesting private sector careers on farms and in food systems. There are employment opportunities in farm management, marketing and sales, compliance, finance, and land surveying and appraisal.

Working toward Tomorrow

Whether you pursue nutrition as a career or simply work to improve your own dietary choices, what you have learned in this course can provide a solid foundation for the future. Remember, your ability to wake up, to think clearly, communicate, hope, dream, go to school, gain knowledge, and earn a living are totally dependent upon one factor—your health. Good health allows you to function normally and work hard to pursue your goals. Yet, achieving optimal health cannot be underestimated. It is a complex process, involving multiple dimensions of wellness, along with your physical or medical reality. The knowledge you have now acquired is also key. However, it is not enough to pass this nutrition class with good grades. Nutrition knowledge must be applied to make a difference in your life, throughout your life.

Throughout this textbook, we have focused on the different aspects of nutritional science, which helps to optimize health and prevent disease. Scientific evidence provides the basis for dietary guidelines and recommendations. In addition, researchers in the field of nutrition work to advance our knowledge of food production and distribution. Nutritional science also examines the ill effects of malnutrition and food insecurity. The findings that are uncovered today will influence not only what we eat, but how we grow it, distribute it, prepare it, and even enjoy it tomorrow.

Introduction

Mai ka piko o ke po’o a ka poli o ka wāwae, a l’a ma na kihi ‘ehā o ke kino

From the crown of the head to the soles of the feet, and the four corners of the body


“Earth in Hand” Image from flickr.com

There are a multitude of diets across the globe, in all regions and cultures. Each is influenced by the traditions of the past, along with the produce and livestock available. Traditional diets around the globe, such as for Native Hawaiians, were comprised of foods low in fats like fresh fish, and high in complex carbohydrates such as kalo (taro) and ‘ulu (breadfruit). However, with modernization and the influence from other ethnic groups that have migrated to the Hawaiian Island chain, the diet has transitioned to be high in animal fat, processed meats, and simple carbohydrates. These changes have played a role in the shift in health issues that many Native Hawaiians are facing today. To learn more about the nutrition transition in the Pacific, visit http://manoa.hawaii.edu/ctahr/pacificfoodguide/index.php/regional-information/.

Good nutrition equates to receiving enough (but not too much) of the macronutrients (proteins, carbohydrates, fats, and water) and micronutrients (vitamins and minerals) so that the body can stay healthy, grow properly, and work effectively. The phrase “you are what you eat” means that  your body will respond to the food it receives, either good or bad. Processed, sugary, high-fat, and excessively salted foods leave the body unable to perform effectively. By contrast, eating a variety of foods from all food groups fuels the body by providing what it needs to produce energy, promote metabolic activity, prevent micronutrient deficiencies, ward off chronic disease, and  bolstering a sense of overall health and well-being.

1

This table compares the typical levels of recommended daily nutrient intake to the United States Tolerable Upper Intake Levels (ULs) and the United Kingdom’s Safe Upper Levels (SULs). The Recommended Dietary Allowance (RDA) and Adequate Intake (AI) values are considered to be levels of nutrient intake that meet or exceed the needs of practically all healthy people. The Daily Value amounts, that are currently used as reference values on food and supplement labels, are similar to the RDA/AI values, but differ in some cases. UL values are the amounts that are considered to be the maximum safe level of intake from food and supplements combined. SUL values are the maximum level of intake of a nutrient from dietary supplements that can be considered to be reasonably safe.

How much is too much?

Comparison of Dietary Reference Intake Values (for adult men and women) and Daily Values for Micronutrients with the Tolerable Upper Intake Levels (UL),a,c Safe Upper Levels (SUL),d and Guidance Levelsd

Nutrient
RDA/AIb (men / women) ages 31-50
Daily Value (Food Labels)
ULc
SUL or Guidance Leveld
Selected Potential Effects of Excess Intake
Vitamin A (mcg)
900 / 700
1500 (5000 IU)
3000
1500** (5000 IU)
Liver damage, bone & joint pain, dry skin, loss of hair, headache, vomiting
beta-Carotene (mg)
7 (11,655 IU)
Increased risk of lung cancer in smokers and those heavily exposed to asbestos
Vitamin D (mcg)
15 (600 IU)
10 (400 IU)
100
25 (1000 IU)
Calcification of brain, arteries, increased blood calcium, loss of appetite, nausea
Vitamin E (mg)
15
20 (30 IU)
1000
540 (800 IU)
Deficient blood clotting
Vitamin K (mcg)
120 / 90*
80
1000**
Red blood cell damage/anemia; liver damage
Thiamin (B1) (mg)
1.2 / 1.1
1.5
100**
Headache, nausea, irritability, insomnia, rapid pulse, weakness (7000+ mg dose)
Riboflavin (B2) (mg)
1.3 / 1.1
1.7
40**
Generally considered harmless; yellow discoloration of urine
Niacin (mg)
16 / 14
20
35
500**
Liver damage, flushing, nausea, gastrointestinal problems
Vitamin B6 (mg)
1.3
2
100
10
Neurological problems, numbness and pain in limbs
Vitamin B12 (mcg)
2.4
6
2000**
Folic acid (mcg)
400
400
1000
1000**
Masks B12 deficiency (which can cause neurological problems)
Pantothenic acid (mg)
5*
10
200**
Diarrhea & gastrointestinal disturbance (10,000+ mg/day)
Biotin (mcg)
30*
300
900**
No reports of toxicity from oral ingestion
Choline (mcg)
550/425*
3500
Fishy body odor (trimethylaminuria), hepatotoxicity
Vitamin C (mg)
90 / 75
60
2000
1000**
Nausea, diarrhea, kidney stones
Boron (mg)
20
9.6
Adverse effects on male and female reproductive system
Calcium (mg)
1000
1000
2500
1500**
Nausea, constipation, kidney stones
Chloride (mg)
2300*
3400
3600
Increased blood pressure in salt-sensitive individuals (when consumed as sodium chloride)
Chromium (mcg)
35/25*
120
10,000**
Potential adverse effects on liver and kidneys; picolinate form possibly mutagenic
Cobalt (mg)
1.4**
Cardiotoxic effects; not appropriate in a dietary supplement except as vitamin B-12
Copper (mcg)
900
2000
10000
10000
Gastrointestinal distress, liver damage
Fluoride (mg)
4 / 3*
10
Bone, kidney, muscle, and nerve damage; supplement with professional guidance
Germanium
zero**
Kidney toxin; should not be in a dietary supplement
Iodine (mcg)
150
150
1100
500**
Elevated thyroid hormone concentration
Iron (mg)
8 / 18
18
45
17**
Gastrointestinal distress, increased risk of heart disease, oxidative stress
Magnesium (mg)
420 / 320
400
350e
400**
Diarrhea
Manganese (mg)
2.3 / 1.8*
2
11
4**
Neurotoxicity
Molybdenum (mcg)
45
75
2000
zero**
Gout-like symptom; joint pains; increased uric acid
Nickel (mcg)
1000
260**
Increased sensitivity of skin reaction to nickel in jewelry
Phosphorus (mg)
700
1000
4000
250**
Alteration of parathyroid hormone levels; reduced bone mineral density
Potassium (mg)
4700*
3500
3700**
Gastrointestinal damage
Selenium (mcg)
55
70
400
450
Nausea, diarrhea, fatigue, hair and nail loss
Silicon (mg)
700
Low toxicity; possibility of kidney stones
Sodium (mg)
1500*
2400
2300
Increased blood pressure in salt-sensitive individuals (when consumed as sodium chloride)
Vanadium (mg)
1.8
zero
Gastrointestinal irritation; fatigue
Zinc (mg)
11 / 8
15
40
25
Impaired immune function, low HDL-cholesterol

aFood and Nutrition Board, Institute of Medicine (U.S.). Dietary Reference Intakes Tables.

b(RDA) = Recommended Dietary Allowance, AI = Adequate Intake, indicated with *

cUL = Tolerable Upper Intake Level (from food & supplements combined)

dSUL = Safe Upper Levels; SULs and Guidance Levels (indicated by **) set by the Expert Group on Vitamins and Minerals of the Food Standards Agency, United Kingdom. These are intended to be levels of daily intake of nutrients in dietary supplements that potentially susceptible individuals could take daily on a life-long basis without medical supervision in reasonable safety. When the evidence base was considered inadequate to set a SUL, Guidance Levels were set based on limited data. SULs and Guidance Levels tend to be conservative and it is possible that, for some vitamins and minerals, greater amounts could be consumed for short periods without risk to health. The values presented are for a 60 kg (132 lb) adult. Consult the full publication for values expressed per kg body weight. This FSA publication, Safe Upper Levels for Vitamins and Minerals, is available at: http://www.foodstandards.gov.uk/multimedia/pdfs/vitmin2003.pdf

eThe UL for magnesium represents intake specifically from pharmacological agents and/or dietary supplements in addition to dietary intake.