Scientific Inquiry in Social Work

Scientific Inquiry in Social Work

Matthew DeCarlo

Open Social Work Education

Roanoke, VA

Contents

1

Student and Instructor Resources

Opened lock with the words "open social work education" written underneath

https://www.opensocialworkeducation.com/

Navigating the web edition

If you’re looking at this in a web browser, you can navigate to each chapter by clicking the Contents button on the top left side of the screen.  If you’re looking at this on a mobile phone, click the Contents button at the top of the page.

Downloadable editions

If you prefer to read a downloadable copy of this textbook, please use the following links.

You can also purchase a print copy of the textbook from PrintMe1.  The author does not receive any compensation from these sales, as this is a non-commercial work.

Notice errors in the textbook? Is the language hard to understand? Could an example be better? You can use the Hypothes.is extension in Google Chrome or Firefox to provide annotations and comments. I’ve set up a Hypothes.is group for student feedback.  Using Hypothesis, you can set up your own groups to take notes on the textbook in collaboration with other students.

Instructor resources

If you are an instructor adopting this textbook, please help us understand a little more about your class by filling out this form.  We value your feedback on the textbook.  Please use the Hypothes.is annotation group for professors to provide comments that will be addressed in the next edition of the textbook, currently planned for Summer 2020.

The following ancillary resources for this textbook are available:

If you make changes to the ancillary resources you feel the community would benefit from or develop new resources, please consider sharing them with the author for inclusion in future editions of this textbook and on OER Commons or Merlot.  Please provide attribution following the best practices in the BCCampus guide.

Publisher information

For more information on open educational resources, open textbooks, and open pedagogy in social work, visit Open Social Work Education.  Our goal is to create open resources for each course in social work!

3

Acknowledgements and Contributors

This textbook would not be possible without the outstanding source textbooks.  Dr. Blackstone’s textbook is an engaging, approachable, and rigorous work on undergraduate research methods, and I am grateful for her scholarship and generosity. It is also important to recognize the work of the Saylor Foundation in creating and sharing Dr. Blackstone’s textbook. Similarly, the Dr. Frederiksen and Dr. Phelps’ textbook is an important resource for any student seeking to understand literature reviews.  The Rebus Community and Pressbooks are also invaluable contributors to the open textbook community.

I would like to thank two librarians who made this book project possible, Jackie Delong of Washington College and Anita Walz of Virginia Tech.  I would also like to thank my social work mentors and colleagues at Radford University and Virginia Commonwealth University, particularly Dr. Mary Katherine O’Connor and Dr. Sarah Kye Price, who fostered my interest in multi-paradigmatic research methods.  Additionally, the support of Radford University and the Waldron College of Health and Human Services were invaluable during the writing of this manuscript.

The creation of this textbook would not have been possible without the assistance of student researchers and graduate assistants, who helped in the writing, editing, and testing of this textbook.  In particular, I would like to thank Amanda Parsons, David Cacamis, Daniel Brooks, and Courtney Crenshaw.  Students in my research methods courses also contributed greatly to my understanding of how to teach this topic, in particular, Tommy Pennington who assisted with copyediting the final draft.

In addition, I would like to thank Melissa Ashman, an instructor of business communications at Kwantlen Polytechnic University, for her assistance in editing the textbook.

The Open Social Work Education logo was designed by Courtney Kupersmith.

I also would also like to dedicate this book to my wife, Emily, for carrying the weight of all of my academic projects, however crazy they are, and for carrying our future son.  And to our cat, Chloe, thanks for being the best administrative assistant in the world.

4

Acknowledgements: eCampusOntario

Share

If you adopt this book, as a core or supplemental resource, please report your adoption in order for us to celebrate your support of students’ savings. Report your commitment at www.openlibrary.ecampusontario.ca.

We invite you to adapt this book further to meet your and your students’ needs. Please let us know if you do! If you would like to use Pressbooks, the platform used to make this book, contact eCampusOntario for an account using open@ecampusontario.ca.

If this text does not meet your needs, please check out our full library at www.openlibrary.ecampusontario.ca. If you still cannot find what you are looking for, connect with colleagues and eCampusOntario to explore creating your own open education resource (OER).

About eCampusOntario

eCampusOntario is a not-for-profit corporation funded by the Government of Ontario. It serves as a centre of excellence in online and technology-enabled learning for all publicly funded colleges and universities in Ontario and has embarked on a bold mission to widen access to post-secondary education and training in Ontario. This textbook is part of eCampusOntario’s open textbook library, which provides free learning resources in a wide range of subject areas. These open textbooks can be assigned by instructors for their classes and can be downloaded by learners to electronic devices or printed for a low cost by our printing partner, The University of Waterloo. These free and open educational resources are customizable to meet a wide range of learning needs, and we invite instructors to review and adopt the resources for use in their courses.

5

Version Information

In January 2019, a set of small revisions to this textbook were made from the original version published in August 2018.  They include the following:

Future changes will be noted here.  The next edition of this book is planned for Summer 2020.

I

1. Introduction to research

1

1.0 Chapter introduction

How do social workers know the right thing to do?  It’s an important question.  Incorrect social work actions may actively harm clients and communities.  Timely and effective social work interventions further social justice and promote individual change.  To do make the right choices, we must have a basis of knowledge, the skills to understand it, and the commitment to growing that knowledge.  The source of social work knowledge is social science and this book is about how to understand and apply it to social work practice.

Chapter outline

Content advisory

This chapter discusses or mentions the following topics: stereotypes of people on welfare, sexual harassment and sexist job discrimination, sexism, poverty, homelessness, mental illness, and substance abuse.

2

1.1 How do social workers know what to do?

Learning Objectives

  • Reflect on how we know what to do as social workers
  • Differentiate between micro-, meso-, and macro-level analysis
  • Describe intuition, its purpose in social work, and its limitations
  • Identify specific types of cognitive biases and how the influence thought
  • Define scientific inquiry


What would you do?

Imagine you are a clinical social worker at a children’s mental health agency.  Today, you receive a referral from your town’s middle school about a client who often skips school, gets into fights, and is disruptive in class.  The school has suspended him and met with the parents multiple times, who say they practice strict discipline at home. Yet, the client’s behavior only gotten worse.  When you arrive at the school to meet with the boy, you notice he has difficulty maintaining eye contact with you, appears distracted, and has a few bruises on his legs.  At the same time, he is also a gifted artist, and you two spend the hour in which you assess him painting and drawing.

Imagine you are a social worker in an urban food desert, a geographic area in which there is no grocery store that sells fresh food.  Many of your low-income clients rely on food from the dollar store or convenience stores in order to live or simply order takeout.  You are becoming concerned about your clients’ health, as many of them are obese and say they are unable to buy fresh food.  Because convenience stores are more expensive and your clients mostly survive on minimum wage jobs or Supplemental Nutrition Assistance Program (SNAP) benefits, they often have to rely on food pantries towards the end of the month once their money runs out.  You have spent the past month building a coalition composed of members from your community, including non-profit agencies, religious groups, and healthcare workers to lobby your city council.

You are a social worker working at a public policy center focused on homelessness.  Your city is seeking a large federal grant to address the growing problem of homelessness in your city and has hired you as a consultant to work on the grant proposal.  After conducting a needs assessment in collaboration with local social service agencies and interviewing people who are homeless, you meet with city councilmembers to talk about your options to create a program.  Local agencies want to spend the money to build additional capacity at existing shelters in the community.  They also want to create a transitional housing program at an unused apartment complex where people can live after the shelter and learn independent living skills.  On the other hand, the clients you interview want to receive housing vouchers so they can rent an apartment from a landlord in the community.  They also fear the agencies running the shelter and transitional housing program would dictate how to live their lives and impose unnecessary rules, like restrictions on guests or quiet hours.  When you ask the agencies about client feedback, they state that clients could not be trusted to manage in their own apartments and need the structure and supervision provided by agency support workers.

Assuming you’ve taken a social work course before, you will notice that the case studies cover different levels of analysis in the social ecosystem—micro, meso, and macro.  At the micro-level, social workers examine the smallest levels of interaction; even in some cases, just “the self” alone. That is our misbehaving child in case 1.  When social workers investigate groups and communities, such as our food desert in case 2, their inquiry is at the meso-level. At the macro-level, social workers examine social structures and institutions. Research at the macro-level examines large-scale patterns, including culture and government policy, as in case 3. These domains interact with each other, and it is common for a social work research project to address more than one level of analysis. Moreover, research that occurs on one level is likely to have implications at the other levels of analysis.

How do social workers know what to do?

Welcome to social work research.  This chapter begins with three problems that social workers might face in practice and three questions about what a social worker should do next.  If you haven’t already, spend a minute or two thinking about how you would respond to each case and jot down some notes.  How would you respond to each of these cases?


woman staring off into window with hand on chin

I assume it is unlikely you are an expert in the areas of children’s mental health, community responses to food deserts, and homelessness policy.  Don’t worry, I’m not either.  In fact, for many of you this textbook will likely come at an early point in your social work education, so it may seem unfair for me to ask you what the right answers are.  And to disappoint you further, this course will not teach you the right answer to these questions.  It will, however, teach you how to answer these questions for yourself.  Social workers must learn how to examine the literature on a topic, come to a reasoned conclusion, and use that knowledge in their practice.  Similarly, social workers engage in research to make sure their interventions are helping, not harming, clients and to contribute to social science as well as social justice.

Again, assuming you did not have advanced knowledge of the topics  in the case studies, when you thought about what you might do in those practice situations, you were likely using intuition (Cheung, 2016). Cheung, J. C. S. (2016). Researching practice wisdom in social work. Journal of Social Intervention: Theory and Practice, 25(3), 24-38. Intuition is a way of knowing that is mostly unconscious.  You simply have a gut feeling about what you should do.  As you think about a problem such as those in the case studies, you notice certain details and ignore others.  Using your past experiences, you apply knowledge that seems to be relevant and make predictions about what might be true.

In this way, intuition is based on direct experience.  Many of us know things simply because we’ve experienced them directly. For example, you would know that electric fences can be pretty dangerous and painful if you touched one while standing in a puddle of water. We all probably have times we can recall when we learned something because we experienced it. If you grew up in Minnesota, you would observe plenty of kids learning each winter that it really is true that your tongue will stick to metal if it’s very cold outside. Similarly, if you passed a police officer on a two-lane highway while driving 20 miles over the speed limit, you would probably learn that that’s a good way to earn a traffic ticket.

Intuition and direct experience are powerful forces.  Uniquely, social work is a discipline that values intuition, though it will take quite a while for you to develop what social workers refer to as practice wisdom.  Practice wisdom is the “learning by doing” that develops as one practices social work over a period of time.  Social workers also reflect on their practice, independently and with colleagues, which sharpens their intuitions and opens their mind to other viewpoints.  While your direct experience in social work may be limited at this point, feel confident that through reflective practice you will attain practice wisdom.

However, it’s important to note that intuitions are not always correct.  Think back to the first case study.  What might be your novice diagnosis for this child’s behavior?  Does he have attention deficit hyperactivity disorder (ADHD) because he is distractible and getting into trouble at school?  Or are those symptoms of autism spectrum disorder or an attachment disorder?  Are the bruises on his legs an indicator of ADHD, or do they indicate possible physical abuse at home?  Even if you arrived at an accurate assessment of the situation, you would still need to figure out what kind of intervention to use with the client.  If he has a mental health issue, you might say, “give him therapy.”  Well…what kind of therapy?  Should we use cognitive-behavioral therapy, play therapy, art therapy, family therapy, or animal assisted therapy?  Should we try a combination of therapy and medication prescribed by a psychiatrist?

We could guess which intervention would be best…but in practice, that would be highly unethical.  If we guessed wrong, we could be wasting time, or worse, actively harming a client.  We need to ground our social work interventions with clients and systems with something more secure than our intuition and experience.

Cognitive biases

Although the human mind is a marvel of observation and data analysis, there are universal flaws in thinking that must be overcome.  We all rely on mental shortcuts to help us make sense of a continuous stream of new information.  All people, including me and you, must train our minds to be aware of predictable flaws in thinking, termed cognitive biases.  Here is a link to the Wikipedia entry on cognitive biases.  As you can see, it is quite long.  We will review some of the most important ones here, but take a minute and browse around to get a sense of how baked-in cognitive biases are to how humans think.


light bulb shattered

The most important cognitive bias for social scientists to be aware of is confirmation bias.  Confirmation bias involves observing and analyzing information in a way that confirms what you already think is true.  No person is a blank slate.  We all arrive at each moment with a set of beliefs, experiences, and models of how the world works that we develop over time.  Often, these are grounded in our own personal experiences.  Confirmation bias assumes these intuitions are correct and ignores or manipulates new information order to avoid challenging what we already believe to be true.

Confirmation bias can be seen in many ways.  Sometimes, people will only pay attention to the information that fits their preconceived ideas and ignore information that does not fit.  This is called selective observation.  Other times, people will make hasty conclusions about a broad pattern based on only a few observations.  This is called overgeneralization.  Let’s walk through an example and see how they each would function.

In our second case study, we are trying to figure out how to help people who receive SNAP (formerly Food Stamps) who live in a food desert.  Let’s say that we have arrived at a solution and are now lobbying the city council to implement it.  There are many people who have negative beliefs about people who are “on welfare.”  These people believe individuals who receive social welfare benefits spend their money irresponsibly, are too lazy to get a job, and manipulate the system to maintain or increase their government payout. People expressing this belief may provide an example like Louis Cuff, who bought steak and lobster with his SNAP benefits and resold them for a profit.

City council members who hold these beliefs may ignore the truth about your client population—that people experiencing poverty usually spend their money responsibly and genuinely need help accessing fresh and healthy food.  This would be an example of selective observation, only looking at the cases that confirm their biased beliefs about people in poverty and ignoring evidence that challenges that perspective.  Likely, these are grounded in overgeneralization, in which one example, like Mr. Cuff, is applied broadly to the population of people using social welfare programs.  Social workers in this situation would have to hope that city council members are open to another perspective and can be swayed by evidence that challenges their beliefs.  Otherwise, they will continue to rely on a biased view of people in poverty when they create policies.

But where do these beliefs and biases come from?  Perhaps, someone who the person considers an authority told them that people in poverty are lazy and manipulative.  Naively relying on authority can take many forms.  We might rely on our parents, friends, or religious leaders as authorities on a topic.  We might consult someone who identifies as an expert in the field and simply follow what they say.  We might hop aboard a “bandwagon” and adopt the fashionable ideas and theories of our peers and friends.

Now, it is important to note that experts in the field should generally be trusted to provide well-informed answers on a topic, though that knowledge should be receptive to skeptical critique and will develop over time as more scholars study the topic.  There are limits to skepticisim, however.  Disagreeing with experts about global warming, the shape of the earth, or the efficacy and safety of vaccines does not make one free of cognitive biases.  On the contrary, it is likely that the person is falling victim to the Dunning-Kruger effect, in which unskilled people overestimate their ability to find the truth.  As this comic illustrates, they are at the top of Mount Stupid.  Only through rigorous, scientific inquiry can they progress down the back slope and hope to increase their depth of knowledge about a topic.

Scientific Inquiry

Cognitive biases are most often expressed when people are using informal observation.  Until I asked at the beginning of this chapter, you may have had little reason to formally observe and make sense of information about children’s mental health, food deserts, or homelessness policy.  Because you engaged in informal observation, it is more likely that you will express cognitive biases in your responses.  The problem with informal observation is that sometimes it is right, and sometimes it is wrong. And without any systematic process for observing or assessing the accuracy of our observations, we can never really be sure that our informal observations are accurate.  In order to minimize the effect of cognitive biases and come up with the truest understanding of a topic, we must apply a systematic framework for understanding what we observe.

The opposite of informal observation is scientific inquiry, used interchangeably with the term research methods in this text.  These terms refer to an organized, logical way of knowing that involves both theory and observation.  Science accounts for the limitations of cognitive biases—not perfectly, though—by ensuring observations are done rigorously, following a prescribed set of steps.  Scientists clearly describe the methods they use to conduct observations and create theories about the social world.  Theories are tested by observing the social world, and they can be shown to be false or incomplete.  In short, scientists try to learn the truth.  Social workers use scientific truths in their practice and conduct research to revise and extend our understanding of what is true in the social world.  Social workers who ignore science and act based on biased or informal observation may actively harm clients.


Key Takeaways

  • Social work research occurs on the micro-, meso-, and macro-level.
  • Intuition is a power, though woefully incomplete, guide to action in social work.
  • All human thought is subject to cognitive biases.
  • Scientific inquiry accounts for cognitive biases by applying an organized, logical way of observing and theorizing about the world.


Glossary

  • Authority- learning by listening to what people in authority say is true
  • Cognitive biases- predictable flaws in thinking
  • Confirmation bias- observing and analyzing information in a way that confirms what you already think is true
  • Direct experience- learning through informal observation
  • Dunning-Kruger effect- when unskilled people overestimate their ability and knowledge (and experts underestimate their ability and knowledge)
  • Intuition- your “gut feeling” about what to do
  • Macro-level- examining social structures and institutions
  • Meso-level- examining interaction between groups
  • Micro-level- examining the smallest levels of interaction, usually individuals
  • Overgeneralization- using limited observations to make assumptions about broad patterns
  • Practice wisdom- “learning by doing” that guides social work intervention and increases over time
  • Research methods- an organized, logical way of knowing based on theory and observation


Image Attributions

Thinking woman by Free-Photos via Pixabay CC-0

Light bulb by MasterTux via Pixabay CC-0


3

1.2 Science and social work

Learning Objectives

  • Define science
  • Describe the the difference between objective and subjective truth(s)
  • Describe the role of ontology and epistemology in scientific inquiry


Science and social work

Science is a particular way of knowing that attempts to systematically collect and categorize facts or truths. A key word here is systematically–conducting science is a deliberate process. Scientists gather information about facts in a way that is organized and intentional, usually following a set of predetermined steps. More specifically, social work is informed by social science, the science of humanity, social interactions, and social structures. In other words, social work research uses organized and intentional procedures to uncover facts or truths about the social world. And social workers rely on social scientific research to promote individual and social change.


""


Philosophy of social science

This approach to finding truth probably sounds similar to something you heard in your middle school science classes.  When you learned about the gravitational force or the mitochondria of a cell, you were learning about the theories and observations that make up our understanding of the physical world.  These theories rely on an ontology, or a set of assumptions about what is real.  We assume that gravity is real and that the mitochondria of a cell are real.  Mitochondria are easy to spot with a powerful enough microscope and we can observe and theorize about their function in a cell.  The gravitational force is invisible, but clearly apparent from observable facts, like watching an apple fall.  The theories about gravity have changed over the years, but improvements in theory were made when observations could not be correctly interpreted using existing theories.

If we weren’t able to perceive mitochondria or gravity, they would still be there, doing their thing because they exist independent of our observation of them.  This is a philosophical idea called realism, and it simply means that the concepts we talk about in science really and truly exist.  Ontology in physics and biology is focused on objective truth.  Chances are you’ve heard of “being objective” before.  It involves observing and thinking with an open mind, pushing aside anything that might bias your perspective.  Objectivity also means we want to find what is true for everyone, not just what is true for one person.  Certainly, gravity is true for everyone and everywhere.  Let’s consider a social work example, though.  It is objectively true that children who are subjected to severely traumatic experiences will experience negative mental health effects afterwards.  A diagnosis of post-traumatic stress disorder (PTSD) is considered to be objective, referring to a real mental health issue that exists independent of the social worker observing it and that is highly similar in its presentation with our client as it would be with other clients.

So, an objective ontological perspective means that what we observe is true for everyone and true even when we aren’t there to observe it.  How do we come to know objective truths like these?  This is the study of epistemology, or our assumptions about how we come to know what is real and true.  The most relevant epistemological question in the social sciences is whether truth is better accessed using numbers or words.  Generally, scientists approaching research with an objective ontology and epistemology will use quantitative methods to arrive at scientific truth.  Quantitative methods examine numerical data to precisely describe and predict elements of the social world.  This is due to the epistemological assumption that mathematics can represent the phenomena and relationships we observe in the social world.

Mathematical relationships are uniquely useful, in that they allow comparisons across individuals as well as across time and space.  For example, while people can have different definitions for poverty, an objective measurement such as an annual income of less than $25,100 for a family of four provides (1) a precise measurement, (2) that can be compared to incomes from all other people in any society from any time period, (3) and refer to real quantities of money that exist in the world.  In this book, we will review survey and experimental methods, which are the most common designs that use quantitative methods to answer research questions.

It may surprise you to learn that objective facts, such as income or mental health diagnosis, are not the only facts in the social sciences.  Indeed, social science is not only concerned with objective truth.  Social science also describes subjective truth, or the truths that are unique to individuals, groups, and contexts.  Unlike objective truth, which is true for all people, subjective truths will vary based on who you are observing and the context in which you are observing them.  The beliefs, opinions, and preferences of people are actually truths that social scientists measure and describe.  Additionally, subjective truths do not exist independent of human observation because they are the product of the human mind.  We negotiate what is true in the social world through language, arriving at a consensus and engaging in debate.

Epistemologically, a scientist seeking subjective truth assumes that truth lies in what people say, their words.  A scientist uses qualitative methods to analyze words or other media to understand their meaning.  Humans are social creatures, and we give meaning to our thoughts and feelings through language.  Linguistic communication is unique.  We share ideas with each other at a remarkable rate.  In so doing, ideas come into and out of existence in a spontaneous and emergent fashion. Words are given a meaning by their creator.  But anyone who receives that communication can absorb, amplify, and even change its original intent.  Because social science studies human interaction, subjectivists argue that language is the best way to understand the world.

This epistemology is based on some interesting ontological assumptions. What happens when someone incorrectly interprets a situation?  While their interpretation may be wrong, it is certainly true to them that they are right.  Furthermore, they act on the assumption that they are right.  In this sense, even incorrect interpretations are truths, even though they are only true to one person.  This leads us to question whether the social concepts we think about really exist.  They might only exist in our heads, unlike concepts from the natural sciences which exist independent of our thoughts.  For example, if everyone ceased to believe in gravity, we wouldn’t all float away.  It has an existence independent of human thought.

Let’s think through an example.  In the Diagnositic and Statistical Manual (DSM) classification of mental health disorders, there is a list of culture-bound syndromes which only appear in certain cultures.  For example, susto describes a unique cluster of symptoms experienced by people in Latin American cultures after a traumatic event that focus on the body.  Indeed, many of these syndromes do not fit within a Western conceptualization of mental health because they differentiate less between the mind and body.  To a Western scientist, susto may seem less real than PTSD.  To someone from Latin America, their symptoms may not fit neatly into the PTSD framework developed within Western society.  This conflict raises the question–do either susto or PTSD really exist at all?  If your answer is “no,” you are adopting the ontology of anti-realism, that social concepts do not have an existence apart from human thought.  Unlike the realists who seek a single, universal truth, the anti-realists see a sea of truths, created and shared within a social and cultural environment.

Let’s consider another example: manels or all-male panel discussions at conferences and conventions.  Check out this National Public Radio article for some hilarious examples, ironically including panels about diversity and gender representation.  Manels are a problem in academic gatherings, Comic-Cons, and other large group events.  A holdover of sexist stereotypes and gender-based privilege, manels perpetuate the sexist idea that men are the experts who deserve to be listened to by other, less important and knowledgeable people.  At least, that’s what we’ve come to recognize over the past few decades thanks to feminist critique.  However, let’s take the perspective of a few different participants at a hypothetical conference and examine their individual, subjective truths.

When the conference schedule is announced, we see that of the ten panel discussions announced, there are only two that contain women.  Pamela, an expert on the neurobiology of child abuse, thinks that this is unfair and as she was excluded from a panel on her specialty.  Marco, an event organizer, feels that since the organizers simply went with who was most qualified to speak and did not consider gender, the results could not be sexist.  Dionne, a professor who specializes in queer theory and indigenous social work, agrees with Pamela that manels are sexist but also feels that the focus on gender excludes and overlooks the problems with race, disability, sexual and gender identity, and social class among the conference panel members.  Given these differing interpretations, how can we come to know what is true about this situation?

Honestly, there are a lot of truths here, not just one truth.  Clearly, Pamela’s truth is that manels are sexist.  Marco’s truth is that they are not necessarily sexist, as long as they were chosen in a sex-blind manner.  While none of these statements is objectively true—a single truth for everyone, in all possible circumstances—they are subjectively true to the people who thought them up.  Subjective truth consists of the the different meanings, understandings, and interpretations created by people and communicated throughout society.  The communication of ideas is important, as it is how people come to a consensus on how to interpret a situation, negotiating the meaning of events, and informing how people act.  Thus, as feminist critiques of society become more accepted, people will behave in less sexist ways.  From a subjective perspective, there is no magical number of female panelists conferences much reach to be sufficiently non-sexist.  Instead, we should investigate using language how people interpret the gender issues at the event, analyzing them within a historical and cultural context.  But how do we find truth when everyone had their own unique interpretation?  By finding patterns.


abstract image showing connections between points on a photo

Science means finding patterns in data

Regardless of whether you are seeking objective truth or subjective truths, research and scientific inquiry aim to find and explain patterns. Most of the time, a pattern will not explain every single person’s experience, a fact about social science that is both fascinating and frustrating. Even individuals who do not know each other and do not coordinate in any deliberate way can create patterns that persist over time. Those new to social science may find these patterns frustrating because they may believe that the patterns that describe their gender, age, or some other facet of their lives don’t really represent their experience. It’s true. A pattern can exist among your cohort without your individual participation in it. There is diversity within diversity.

Let’s consider some specific examples. One area that social workers commonly investigate is the impact of a person’s social class background on their experiences and lot in life. You probably wouldn’t be surprised to learn that a person’s social class background has an impact on their educational attainment and achievement. In fact, one group of researchers (Ellwood & Kane, 2000) Ellwood, D., & Kane, T. (2000). Who gets a college education? Family background and growing gaps in enrollment. In S. Danziger & J. Waldfogel (Eds.), Securing the future (p. 283–324). New York, NY: Russell Sage Foundation. in the early 1990s found that the percentage of children who did not receive any postsecondary schooling was four times greater among those in the lowest quartile (25%) income bracket than those in the upper quartile of income earners (i.e., children from high- income families were far more likely than low-income children to go on to college). Another recent study found that having more liquid wealth that can be easily converted into cash actually seems to predict children’s math and reading achievement (Elliott, Jung, Kim, & Chowa, 2010). Elliott, W., Jung, H., Kim, K., & Chowa, G. (2010). A multi-group structural equation model (SEM) examining asset holding effects on educational attainment by race and gender. Journal of Children & Poverty, 16, 91–121.

These findings—that wealth and income shape a child’s educational experiences—are probably not that shocking to any of us. Yet, some of us may know someone who may be an exception to the rule. Sometimes the patterns that social scientists observe fit our commonly held beliefs about the way the world works. When this happens, we don’t tend to take issue with the fact that patterns don’t necessarily represent all people’s experiences. But what happens when the patterns disrupt our assumptions?

For example, did you know that teachers are far more likely to encourage boys to think critically in school by asking them to expand on answers they give in class and by commenting on boys’ remarks and observations? When girls speak up in class, teachers are more likely to simply nod and move on. The pattern of teachers engaging in more complex interactions with boys means that boys and girls do not receive the same educational experience in school (Sadker & Sadker, 1994). Sadker, M., & Sadker, D. (1994). Failing at fairness: How America’s schools cheat girls. New York, NY: Maxwell Macmillan International. You and your classmates, of all genders, may find this news upsetting.

People who object to these findings tend to cite evidence from their own personal experience, refuting that the pattern actually exists. However, the problem with this response is that objecting to a social pattern on the grounds that it doesn’t match one’s individual experience misses the point about patterns. Patterns don’t perfectly predict what will happen to an individual person.  Yet, they are a reasonable guide that, when systematically observed, can help guide social work thought and action.

A final note on qualitative and quantitative methods

There is no one superior way to find patterns that help us understand the world.  As we will learn about in Chapter 6, there are multiple philosophical, theoretical, and methodological ways to approach uncovering scientific truths.  Qualitative methods aim to provide an in-depth understanding of a relatively small number of cases. Quantitative methods offer less depth on each case but can say more about broad patterns in society because they typically focus on a much larger number of cases.  A researcher should approach the process of scientific inquiry by formulating a clear research question and conducting research using the methodological tools best suited to that question.

Believe it or not, there are still significant methodological battles being waged in the academic literature on objective vs. subjective social science.  Usually, quantitative methods are viewed as “more scientific” and qualitative methods are viewed as “less scientific.”  Part of this battle is historical.  As the social sciences developed, they were compared with the natural sciences, especially physics, which rely on mathematics and statistics to find truth.  It is a hotly debated topic whether social science should adopt the philosophical assumptions of the natural sciences—with its emphasis on prediction, mathematics, and objectivity—or use a different set of tools—understanding, language, and subjectivity—to find scientific truth.

You are fortunate to be in a profession that values multiple scientific ways of knowing. The qualitative/quantitative debate is fueled by researchers who may prefer one approach over another, either because their own research questions are better suited to one particular approach or because they happened to have been trained in one specific method. In this textbook, we’ll operate from the perspective that qualitative and quantitative methods are complementary rather than competing. While these two methodological approaches certainly differ, the main point is that they simply have different goals, strengths, and weaknesses. A social work researcher should choose the methods that best match with the question they are asking.


Key Takeaways

  • Social work is informed by science.
  • Social science is concerns with both objective and subjective knowledge.
  • Social science research aims to understand patterns in the social world.
  • Social scientists use both qualitative and quantitative methods. While different, these methods are often complementary.


Glossary

  • Epistemology- a set of assumptions about how we come to know what is real and true
  • Objective truth- a single truth, observed without bias, that is universally applicable
  • Ontology- a set of assumptions about what is real
  • Qualitative methods- examine words or other media to understand their meaning
  • Quantitative methods- examine numerical data to precisely describe and predict elements of the social world
  • Science- a particular way of knowing that attempts to systematically collect and categorize facts or truth
  • Subjective truth- one truth among many, bound within a social and cultural context


Image Attributions

Science and Technology by Petr Kratochvil CC-0

Abstract art blur bright by Pixabay CC-0


4

1.3 Why should we care?

Learning Objectives

  • Describe and discuss four important reasons why students should care about social scientific research methods
  • Identify how social workers use research as part of evidence-based practice


At this point, you may be wondering about the relevance of research methods to your life. Whether or not you choose to become a social worker, you should care about research methods for two basic reasons: (1) research methods are regularly applied to solve social problems and issues that shape how our society is organized, thus you have to live with the results of research methods every day of your life, and (2) understanding research methods will help you evaluate the effectiveness of social work interventions, an important skill for future employment.

Consuming research and living with its results

Another New Yorker cartoon depicts two men chatting with each other at a bar. One is saying to the other, “Are you just pissing and moaning, or can you verify what you’re saying with data?” (https://condenaststore.com/featured/are-you-just-pissing-and-moaning-edward-koren.html). Which would you rather be, just a complainer or someone who can actually verify what you’re saying? Understanding research methods and how they work can help position you to actually do more than just complain. Further, whether you know it or not, research probably has some impact on your life each and every day. Many of our laws, social policies, and court proceedings are grounded in some degree of empirical research and evidence (Jenkins & Kroll-Smith, 1996). Jenkins, P. J., & Kroll-Smith, S. (Eds.). (1996). Witnessing for sociology: Sociologists in court. Westport, CT: Praeger. That’s not to say that all laws and social policies are good or make sense. However, you can’t have an informed opinion about any of them without understanding where they come from, how they were formed, and what their evidence base is. All social workers, from micro to macro, need to understand the root causes and policy solutions to social problems that their clients are experiencing.

A recent lawsuit against Walmart provides an example of social science research in action. A sociologist named Professor William Bielby was enlisted by plaintiffs in the suit to conduct an analysis of Walmart’s personnel policies in order to support their claim that Walmart engages in gender discriminatory practices. Bielby’s analysis shows that Walmart’s compensation and promotion decisions may indeed have been vulnerable to gender bias. In June 2011, the United States Supreme Court decided against allowing the case to proceed as a class-action lawsuit (Wal-Mart Stores, Inc. v. Dukes, 2011).  Wal-Mart Stores, Inc. v. Dukes, 564 U.S. (2011); The American Sociological Association filed an amicus brief in support of what would be the class of individuals claiming gender discrimination. You can read the brief at http://asanet.org/images/press/docs/pdf/Amicus_Brief_Wal-Mart_vDukes_et_al.pdf. For other recent amicus briefs filed by the ASA, see http://asanet.org/about/amicus_briefs.cfm. While a class-action suit was not pursued in this case, consider the impact that such a suit against one of our nation’s largest employers could have on companies and their employees around the country and perhaps even on your individual experience as a consumer. Want to know more about the suit against Walmart or about Bielby’s analysis for the case? Check out the following source: Hart, M., & Secunda, P. M. (2009). A matter of context: Social framework evidence in employment discrimination class actions. Fordham Law Review78, 37-70. (2009). A matter of context: Social framework evidence in employment discrimination class action. Fordham Law Review, 78, 37–70. Retrieved from: http://www.fordhamlawreview.org/assets/pdfs/Vol_78/Hart_Secunda_October_2009.pdf

In addition to having to live with laws and policies that have been crafted based on social science research, you are also a consumer of all kinds of research, and understanding methods can help you be a smarter consumer. Ever notice the magazine headlines that peer out at you while you are waiting in line to pay for your groceries? They are geared toward piquing your interest and making you believe that you will learn a great deal if you follow the advice in a particular article. However, since you would have no way of knowing whether the magazine’s editors had gathered their data from a representative sample of people like you and your friends, you would have no reason to believe that the advice would be worthwhile. By having some understanding of research methods, you can avoid wasting your money by buying the magazine and wasting your time by following inappropriate advice.

Pick up or log on to the website for just about any magazine or newspaper, or turn on just about any news broadcast, and chances are you’ll hear something about some new and exciting research results. Understanding research methods will help you read past any hype and ask good questions about what you see and hear. In other words, research methods can help you become a more responsible consumer of public and popular information. And who wouldn’t want to be more responsible?


a woman sitting at a desk listening to another woman in a chair

Evidence-based practice

Probably the most asked questions, though seldom asked directly, are “Why am I in this class?” or “When will I ever use this information?“ While it may seem strange, the answer is “pretty often.” Social work supervisors and administrators at agency-based settings will likely have to demonstrate that their agency’s programs are effective at achieving their goals. Most private and public grants will require evidence of effectiveness in order to continue receiving money and keep the programs running. Social workers at community-based organization commonly use research methods to target their interventions to the needs of their service area. Clinical social workers must also make sure that the interventions they use in practice are effective and not harmful to clients. Social workers may also want to track client progress on goals, help clients gather data about their clinical issues, or use data to advocate for change. All social workers in all practice situations must also remain current on the scientific literature to ensure competent and ethical practice.

In all of these cases, a social worker needs to be able to understand and evaluate scientific information. Evidence-based practice (EBP) for social workers involves making decisions on how to help clients based on the best available evidence. A social worker must examine the literature, understanding both the theory and evidence relevant to the practice situation. According to Rubin and Babbie (2017), Rubin, A., and Babbie, E. R. (2017). Research methods for social work (9th ed.). Belmont: Wadsworth. EBP also involves understanding client characteristics, using practice wisdom and existing resources, and adapting to environmental context. It is not simply “doing what the literature says,” but rather a process by which practitioners examine the literature, client, self, and context to inform interventions with clients and systems. As we discussed in Section 1.2, the patterns discovered by scientific research are not perfectly applicable to all situations. Instead, we rely on the critical thinking of social workers to apply scientific knowledge to real-world situations.

Let’s consider an example of a social work administrator at a children’s mental health agency. The agency uses private grant funds to fund a program that provides low-income children with bicycles, teaches the children how to repair and care for their bicycles, and leads group bicycle outings after school. Physical activity has been shown to improve mental health outcomes in scientific studies, but is this social worker’s program improving mental health in their clients? Ethically, the social worker should make sure that the program is achieving its goals. If the program is not beneficial, the resources should be spent on more effective programs. Practically, the social worker will also need to demonstrate to the agency’s funders that bicycling truly helps children deal with their mental health concerns.

The example above demonstrates the need for social workers to engage in evaluation research or research that evaluates the outcomes of a policy or program. She will choose from many acceptable ways to investigate program effectiveness, and those choices are based on the principles of scientific inquiry you will learn in this textbook. As the example above mentions, evaluation research is baked into how nonprofit human service agencies are funded. Government and private grants need to make sure their money is being spent wisely. If your program does not work, then the money should go to a program that has been shown to be effective or a new program that may be effective. Just because a program has the right goal doesn’t mean it will actually accomplish that goal. Grant reporting is an important part of agency-based social work practice. Agencies, in a very important sense, help us discover what approaches actually help clients.


a homeless man lays under a blanket on the street with bags of items around

In addition to engaging in evaluation research to satisfy the requirements of a grant, your agency may engage in evaluation research for the purposes of validating a new approach to treatment. Innovation in social work is incredibly important. Sam Tsemberis relates an “aha” moment from his practice in this Ted talk on homelessness (https://youtu.be/HsFHV-McdPo). A faculty member at the New York University School of Medicine, he noticed a problem with people cycling in and out of the local psychiatric hospital wards. Clients would arrive in psychiatric crisis, stabilize under medical supervision in the hospital, and end up back at the hospital back in psychiatric crisis shortly after discharge. When he asked the clients what their issues were, they said they were unable to participate in homelessness programs because they were not always compliant with medication for their mental health diagnosis and they continued to use drugs and alcohol. Collaboratively, the problem facing these clients was defined as a homelessness service system that was unable to meet clients where they were. Clients who were unwilling to remain completely abstinent from drugs and alcohol or who did not want to take psychiatric medications were simply cycling in and out of psychiatric crisis, moving from the hospital to the street and back to the hospital.

The solution that Sam Tsemberis implemented and popularized was called Housing First, and it is an approach to homelessness prevention that starts by, you guessed it, providing people with housing first. Similar to an approach to child and family homelessness created by Tanya Tull, Tsemberis created a model of addressing chronic homelessness with people with co-occurring disorders (substance abuse and mental illness). The Housing First model holds that housing is a human right, one that should not be denied based on substance use or mental health diagnosis. Clients are given housing as soon as possible. The Housing First agency provides wraparound treatment from an interdisciplinary team, including social workers, nurses, psychiatrists, and former clients who are in recovery. Over the past few decades, this program has gone from one program in New York City to the program of choice for federal, state, and local governments seeking to address homelessness in their communities.

The main idea behind Housing First is that once clients have an apartment of their own, they are better able to engage in mental health and substance abuse treatment. While this approach may seem logical to you, it is backwards from the traditional homelessness treatment model. The traditional approach began with the client stopping drug and alcohol use and taking prescribed medication. Only after clients achieved these goals were they offered group housing. If the client remained sober and medication compliant, they could then graduate towards less restrictive individual housing.

Evaluation research helps practitioners establish that their innovation is better than the alternatives and should be implemented more broadly. By comparing clients who were served through Housing First and traditional treatment, Tsemberis could establish that Housing First was more effective at keeping people housed and progressing on mental health and substance abuse goals. Starting first with smaller studies and graduating to much larger ones, Housing First built a reputation as an effective approach to addressing homelessness. When President Bush created the Collaborative Initiative to Help End Chronic Homelessness in 2003, Housing First was used in a majority of the interventions and demonstrated its effectiveness on a national scale. In 2007, it was acknowledged as an evidence-based practice in the Substance Abuse and Mental Health Services Administration’s (SAMHSA) National Registry of Evidence-Based Programs and Policies (NREPP). Substance Abuse and Mental Health Services Administration (2007). Pathways' housing first program. Retrieved from: https://nrepp.samhsa.gov/Legacy/ViewIntervention.aspx? id=365

I suggest browsing around the NREPP website (https://nrepp.samhsa.gov/landing.aspx) and looking for interventions on topics that interest you. Other sources of evidence-based practices include the Cochrane Reviews digital library (http://www.cochranelibrary.com/) and Campbell Collaboration (https://campbellcollaboration.org/). In the next few chapters, we will talk more about how to find literature about interventions in social work. The use of systematic reviews, meta-analyses, and randomized controlled trials are particularly important in this regard.

So why share the story of Housing First? Well, I want you think about what you hope to contribute to our knowledge on social work practice. What is your bright idea and how can it change the world? Practitioners innovate all the time, often incorporating those innovations into their agency’s approach and mission. Through the use of research methods, agency-based social workers can demonstrate to policymakers and other social workers that their innovations should be more widely used. Without this wellspring of new ideas, social services would not be able to adapt to the changing needs of clients. Social workers in agency-based practice may also participate in research projects happening at their agency. Partnerships between schools of social work and agencies are a common way of testing and implementing innovations in social work. Clinicians receive specialized training, clients receive additional services, agencies gain prestige, and researchers can study how an intervention works in the real world.

While you may not become a scientist in the sense of wearing a lab coat and using a microscope, social workers must understand science in order to engage in ethical practice. In this section, we reviewed many ways in which research is a part of social work practice, including:


Key Takeaways

  • Whether we know it or not, our everyday lives are shaped by social scientific research.
  • Understanding research methods is important for competent and ethical social work practice.
  • Understanding social science and research methods can help us become more astute and more responsible consumers of information.
  • Knowledge about social scientific research methods is important for ethical practice, as it ensures interventions are based on evidence.


Glossary

  • Evaluation research- research that evaluates the outcomes of a policy or program
  • Evidence-based practice- making decisions on how to help clients based on the best available evidence


Image Attributions

A peer counselor with mother by US Department of Agriculture CC-BY-2.0

Homeless man in New York 2008 by JMSuarez CC-BY-2.0


5

1.4 Understanding research

Learning Objectives

  • Describe common barriers to engaging with social work research
  • Identify alternative ways to thinking about research methods


I’ve been teaching research methods for six years and have found many students struggle to see the connection between research and social work practice. Most students enjoy a social work theory class because they can better understand the world around them. Students also like practice because it shows them how to conduct clinical work with clients—i.e., what most social work students want to do. However, while I typically have a few students each year who are interested in becoming researchers, it’s not very common. For this reason, I want to end this chapter on a more personal note. Most student barriers to research come from the following beliefs:

Research is useless!

Students who tell me that research methods is not a useful class to them are saying something important. As a scholar (or student), your most valuable asset is your time. You give your time to the subjects you consider important to you and your future practice. Because most social workers don’t become researchers or practitioner-researchers, students feel like a research methods class is a waste of time.

Our discussion of evidence-based practice and the ways in which social workers use research methods in practice brought home the idea that social workers play an important role in creating new knowledge about social services. On a more immediate level, research methods will also help you become a stronger social work student. The next few chapters of this textbook will review how to search for literature on a topic and write a literature review. These skills are relevant in every classroom during your academic career. The rest of the textbook will help you understand the mechanics of research methods so you can better understand the content of those pesky journal articles your professors force you to cite in your papers.

Research is too hard!

Research methods involves a lot of terminology that is entirely new to social workers. Other domains of social work, such as practice, are easier to apply your intuition towards. You understand how to be an empathetic person, and your experiences in life can help guide you through a practice situation or even theoretical or conceptual question. Research may seem like a totally new area in which you have no previous experience. It can seem like a lot to learn. In addition to the normal memorization and application of terms, research methods also has wrong answers. There are certain combinations of methods that just don’t work together.

The fear is entirely understandable. Research is not straightforward. As Figure 1.1 shows, it is a process that is non-linear, involving multiple revisions, wrong turns, and dead ends before you figure out the best question and research approach. You may have to go back to chapters after having read them or even peek ahead at chapters your class hasn’t covered yet.


research is more of a squiggle than a straight line
Figure 1.1 Research as a non-linear process

Untitled image created by Ohio State University Libraries (n.d.) Retrieved from: https://ohiostate.pressbooks.pub/choosingsources/front-matter/introduction/. Shared under a CC-BY 4.0 license. https://creativecommons.org/licenses/by/4.0/

Moreover, research is something you learn by doing…and stumbling a few times. It’s an iterative process, or one that requires lots of tries to get right. There isn’t a shortcut for learning research, but hopefully your research methods class is one in which your research project is broken down into smaller parts and you get consistent feedback throughout the process. No one just knows research. It’s something you pick up by doing it, reflecting on the experiences and results, redoing your work, and revising it in consultation with your professor.

Research is boring!

We’ve talked already about the arcane research terminology, so I won’t go into it again here. But research methods is sometimes seen as a boring topic by many students. Practice knowledge and even theory are fun to learn because they are easy to apply and give you insight into the world around you. Research just seems like its own weird, remote thing.

I completely understand where this perspective comes from and hope there are a few things you will take away from this course that aren’t boring to you. In the first section of this textbook, you will learn how to take any topic and learn what is known about it. It may seem trivial, but it is actually a superpower. Your social work education will present some generalist material, which is applicable to nearly all social work practice situations, and some applied material, which is applicable to specific social work practice situations. However, no education will provide you with everything you need to know. And certainly, no education will tell you what will be discovered over the next few decades of your practice. Our work on literature reviews in the next few chapters will help you in becoming a strong social work student and practitioner. Following that, our exploration of research methods will help you further understand how the theories, practice models, and techniques you learn in your other classes are created and tested scientifically.

Get out of your own way

Together, the beliefs of “research is useless, boring, and hard” can create a self-fulfilling prophecy for students. If you believe research is boring, you won’t find it interesting. If you believe research is hard, you will struggle more with assignments. If you believe research is useless, you won’t see its utility. While I certainly acknowledge that students aren’t going to love research as much as I do (it’s a career for me, so I like it a lot!), I suggest reframing how you think about research using these touchstones:

Structure of this textbook

While you may not have chosen this course, by reframing your approach to it, you increase the likelihood of getting a lot out of it. To that end, here is the structure of this book:

In Chapters 2-4, we’ll review how to begin a research project. This involves searching for relevant literature, academic journal articles specifically, and synthesizing what they say about your topic into a literature review.

In Chapters 5-9, you’ll learn about how research informs and tests theory. We’ll discuss how to conduct research in an ethical manner, create research questions, and measure concepts in the social world.

Chapters 10-14 will describe how to conduct research, whether it’s a quantitative survey or experiment, or alternately, a qualitative interview or focus group. We’ll also review how to analyze data that someone else has already collected.

Finally, Chapters 15 and 16 will review the types of research most commonly used in social work practice, including evaluation research and action research, and how to report the results of your research to various audiences.


Key Takeaways

  • Anxiety about research methods is a common experience for students.
  • Research methods will help you become a better scholar and practitioner.


II

2. Beginning a research project

6

2.0 Chapter introduction

Research methods is my favorite course to teach. It is somewhat less popular with students, but I’m working on that issue. Part of the excitement of teaching this class comes from the uniquely open framework—students get to design a research study about a topic that interests them. By reading my students’ papers every semester, I learn about a wide range of topics relevant to social work that I otherwise would not have known about. But what topic should you choose?

Chapter outline

Content advisory

This chapter discusses or mentions the following topics: racism and hate groups, police violence, substance abuse, and mental health.

7

2.1 Getting started

Learning Objectives

  • Find a topic to investigate
  • Create a working question


Choosing a social work research topic

According to the Action Network for Social Work Education and Research (ANSWER), social work research is conducted to benefit “consumers, practitioners, policymakers, educators, and the general public through the examination of societal issues” (ANSWER, n.d., para. 2). Action Network for Social Work Education and Research (n.d.). Advocacy. Retrieved from: https://www.socialworkers.org/Advocacy/answer Common social issues that are studied include “health care, substance abuse, community violence, family issues, child welfare, aging, well-being and resiliency, and the strengths and needs of underserved populations” (ANSWER, n.d., para. 2). This list is certainly not exhaustive. Social workers may study any area that impacts their practice. However, the unifying feature of social work research is its focus on promoting the wellbeing of target populations.


""

But as undergraduate social work students, you are likely not yet practicing social work. How do you identify researchable topics then? Part of the joy in being a social work student is figuring out what areas of social work are appealing to you. Perhaps there are certain theories that speak to you, based on your values or experiences. Perhaps there are social issues you wish to change. Perhaps there are certain groups of people you want to help. Perhaps there are clinical interventions that interest you. Any one of these is a good place to start. At the beginning of a research project, your main focus should be finding a social work topic that is interesting enough to spend a semester reading and writing about it.

A good topic selection plan begins with a general orientation into the subject you are interested in pursuing in more depth. Here are some suggestions when choosing a topic area:

How do you feel about your topic?

Perhaps you have started with a specific population in mind—for example, youth who identify as LGBTQ or visitors to a local health clinic. In other cases, you may start with a social problem, such as gang violence, or social policy or program, such as zero-tolerance policies in schools. Alternately, maybe there are interventions like dialectical behavioral therapy or applied behavior analysis about which you would like to learn more. Your motivation for choosing a topic does not have to be objective. Because social work is a values-based profession, social work researchers often find themselves motivated to conduct research that furthers social justice or fights oppression. Just because you think a policy is wrong or a group is being marginalized, for example, does not mean that your research will be biased. It means you must understand how you feel, why you feel that way, and what would cause you to feel differently about your topic.


drawn black arms reaching towards the word justice written in grey text on a white background

Start by asking yourself how you feel about your topic. Be totally honest, and ask yourself whether you believe your perspective is the only valid one. Perhaps yours isn’t the only perspective, but do you believe it is the wisest one? The most practical one? How do you feel about other perspectives on this topic? If you feel so strongly that certain findings would upset you or that either you would design a project to get only the answer you believe to be the best one or you might feel compelled to cover up findings that you don’t like, then you need to choose a different topic. For example, a researcher may want to find out whether there is any relationship between intelligence and political party affiliation—certain that members of her party are without a doubt the most intelligent. Her strong opinion would not be a problem by itself. However, if she feels rage when considering the possibility that the opposing party’s members are more intelligent than those of her party, the topic is probably too near and dear for her to use it to conduct unbiased research.

Of course, just because you feel strongly about a topic does not mean that you should not study it. Sometimes the best topics to research are those about which you do feel strongly. What better way to stay motivated than to study something that you care about? You must be able to accept that people will have a different perspective than you do, and try to represent their viewpoints fairly in your research. If you feel prepared to accept all findings, even those that may be unflattering to or distinct from your personal perspective, then perhaps you should intentionally study a topic about which you have strong feelings.

Kathleen Blee (2002) Blee, K. (2002). Inside organized racism: Women and men of the hate movement. Berkeley, CA: University of California Press; Blee, K. (1991). Women of the Klan: Racism and gender in the 1920s. Berkeley, CA: University of California Press. has taken this route in her research. Blee studies hate movement participants, people whose racist ideologies she studies but does not share. You can read her accounts of this research in two of her most well-known publications, Inside Organized Racism and Women of the Klan. Blee’s research is successful because she was willing to report her findings and observations honestly, even those about which she may have strong feelings. Unlike Blee, if you think about it and conclude that you cannot accept or share with others findings with which you disagree, then you should study a different topic. Knowing your own hot-button issues is an important part of self-knowledge and reflection in social work.

Social workers often use personal experience as a starting point for what topics are interesting to cover. As we’ve discussed here, personal experience can be a powerful motivator to study a topic in detail. However, social work researchers should be mindful of their own mental health during the research process. A social worker who has experienced a mental health crisis or traumatic event should approach researching related topics cautiously. There is no need to retraumatize yourself or jeopardize your mental health for a research paper. For example, a student who has just experienced domestic violence may want to know about Eye Movement Desensitization and Reprocessing (EMDR) therapy. While the student might gain some knowledge about potential treatments for domestic violence, they will likely have to read through many stories and reports about domestic violence. Unless the student’s trauma has been processed in therapy, conducting a research project on this topic may negatively impact the student’s mental health. Nevertheless, she will acquire skills in research methods that will help her understand the EMDR literature and whether to begin treatment in that modality.

Whether you feel strongly about your topic or not, you will also want to consider what you already known about it. There are many ways we know what we know. Perhaps your mother told you something is so. Perhaps it came to you in a dream. Perhaps you took a class last semester and learned something about your topic there. Or you may have read something about your topic in your local newspaper or in People magazine. We discussed the strengths and weaknesses associated with some of these different sources of knowledge in Chapter 1, and we’ll talk about other sources of knowledge, such as prior research in the next few sections. For now, take some time to think about what you know about your topic from all possible sources. Thinking about what you already know will help you identify any biases you may have, and it will help as you begin to frame a question about your topic.


""

What do you want to know?

Once you have a topic, begin to think about it in terms of a question. What do you really want to know about the topic? As a warm-up exercise, try dropping a possible topic idea into one of the blank spaces below. The questions may help bring your subject into sharper focus and provide you with the first important steps towards developing your topic.

  1. What does ___ mean? (Definition)
  2. What are the various features of ___? (Description)
  3. What are the component parts of ___? (Simple analysis)
  4. How is ___ made or done? (Process analysis)
  5. How should ___ be made or done? (Directional analysis)
  6. What is the essential function of ___? (Functional analysis)
  7. What are the causes of ___? (Causal analysis)
  8. What are the consequences of ___? (Causal analysis)
  9. What are the types of ___? (Classification)
  10. How is ___ like or unlike ___? (Comparison)
  11. What is the present status of ___? (Comparison)
  12. What is the significance of ___? (Interpretation)
  13. What are the facts about ___? (Reportage)
  14. How did ___ happen? (Narration)
  15. What kind of person is ___? (Characterization/Profile)
  16. What is the value of ___? (Evaluation)
  17. What are the essential major points or features of ___? (Summary)
  18. What case can be made for or against ___? (Persuasion)
  19. What is the relationship between _____ and the outcome of ____? (Explorative)

Take a minute right now and write down a question you want to answer. Even if it doesn’t seem perfect, everyone needs a place to start. Make sure your research topic is relevant to social work. You’d be surprised how much of the world that encompasses. It’s not just research on mental health treatment or child welfare services. Social workers can study things like the pollution of irrigation systems and entrepreneurship in women, among infinite other topics. The only requirement is your research must inform action to fight social problems faced by target populations.

Your question is only a starting place, as research is an iterative process, one that subject to constant revision.  As we progress in this textbook, you’ll learn how to refine your question and include the necessary components for proper qualitative and quantitative research questions. Your question will also likely change as you engage with the literature on your topic. You will learn new and important concepts that may shift your focus or clarify your original ideas. Trust that a strong question will emerge from this process.


Key Takeaways

  • Many researchers choose topics by considering their own personal experiences, knowledge, and interests.
  • Researchers should be aware of and forthcoming about any strong feelings they might have about their research topics.
  • There are benefits and drawbacks associated with studying a topic about which you already have some prior knowledge or experience. Researchers should be aware of and consider both.
  • Writing a question down will help guide your inquiry.


Image Attributions

Transportation/Traffic by Max Pixel CC-0

Justice by Geralt CC-0

Question by Max Pixel CC-0


8

2.2 Sources of information

Learning Objectives

  • Explain how information is created and how it evolves over time
  • Select appropriate sources for your inquiry
  • Describe the strengths and limitations of each type of source


Because a literature review is a summary and analysis of the relevant publications on a topic, we first have to understand what is meant by “the literature.” In this case, “the literature” is a collection of all of the relevant written sources on a topic.


the word knowledge is written in blue and white chalk on a black background with white arrows going in different directions

Disciplines of knowledge

When drawing boundaries around an idea, topic, or subject area, it helps to think about how and where the information for the field is produced. For this, you need to identify the disciplines of knowledge production in a subject area.

Information does not exist in the environment like some kind of raw material. It is produced by individuals working within a particular field of knowledge who use specific methods for generating new information. Disciplines consume, produce, and disseminate knowledge. Looking through a university’s course catalog gives clues to disciplinary structure. Fields such as political science, biology, history, and mathematics are unique disciplines, as is social work, with its own logic for how and where new knowledge is introduced and made accessible.

You will need to become comfortable with identifying the disciplines that might contribute information to any search. When you do this, you will also learn how to decode the way how people talk about a topic within a discipline. This will be useful to you when you begin a review of the literature in your area of study.

For example, think about the disciplines that might contribute information to a topic such as the role of sports in society. Try to anticipate the type of perspective each discipline might have on the topic. Consider the following types of questions as you examine what different disciplines might contribute:

In this example, we identify two disciplines that have something to say about the role of sports in society: the human service professions of nursing and social work. What would each of these disciplines raise as key questions or issues related to that topic? A nursing researcher might study how sports affect individuals’ health and well-being, how to assess and treat sports injuries, or the physical conditioning required for athletics. A social work researcher might study how schools privilege or punish student athletes, how athletics impact social relationships and hierarchies, or the differences between boys’ and girls’ participation in organized sports. In this example, we see that a single topic can be approached from many different perspectives depending on how the disciplinary boundaries are drawn and how the topic is framed. Nevertheless, it is useful for a social worker to be aware of the nursing literature, as they could better appreciate the physical toll that sports take on athletes’ bodies and how that may interact with other issues. An interdisciplinary perspective is usually a more comprehensive perspective.

Types of sources

“The literature” consists of the published works that document a scholarly conversation on a specific topic within and between disciplines. You will find in “the literature” documents that explain the background of your topic. You will also find controversies and unresolved questions that can inspire your own project. By now in your social work academic career, you’ve probably heard that you need to get “peer-reviewed journal articles.” But what are those exactly? How do they differ from news articles or encyclopedias? That is the focus of this section of the text—the different types of literature.

First, let’s discuss periodicals. Periodicals include journals, trade publications, magazines, and newspapers. While they may appear similar, particularly online, each of these periodicals has unique features designed for a specific purpose. Magazine and newspaper articles are usually written by journalists, are intended to be short and understandable for the average adult, contain color images and advertisements, and are designed as commodities sold to an audience. Magazines may contain primary or secondary literature depending on the article in question. The New Social Worker is an excellent magazine for social workers. An article that is a primary source would gather information as an event happened, like an interview with a victim of a local fire, or relate original research done by the journalists, like the Guardian newspaper’s The Counted webpage which tracks how many people were killed by police officers in the United States. The Guardian (n.d.). The counted: People killed by police in the US. Retrieved from: https://www.theguardian.com/us-news/ng-interactive/2015/jun/01/the-counted-police-killings-us-database


a screenshot of the yahoo! homepage showing news items

Is it okay to use a magazine or newspaper as a source in your research methods class? If you were in my class, the answer is “probably not.” There are some exceptions like the Guardian page mentioned above or breaking news about a policy or community, but most of what newspapers and magazines publish is secondary literature. Secondary sources interpret, discuss, and summarize primary sources. Often, news articles will summarize a study done in an academic journal. Your job in this course is to read the original source of the information, in this case, the academic journal article itself. Journalists are not scientists. If you have seen articles about how chocolate cures cancer or how drinking whiskey can extend your life, you should understand how journalists can exaggerate or misinterpret results. Careful scholars will critically examine the primary source, rather than relying on someone else’s summary. Many newspapers and magazines also contain opinion articles, which are even less reputable as the author will choose facts to support their viewpoint and exclude facts that contract their viewpoint. Nevertheless, newspaper and magazine articles are excellent places to start your journey into the literature, as they do not require specialized knowledge to understand and may inspire deeper inquiry.

Unlike magazines and newspapers, trade publications may take some specialized knowledge to understand. Trade publications or trade journals are periodicals directed to members of a specific profession. They often have information about industry trends and practical information for people working in the field. Because of this trade publications are somewhat more reputable than newspapers or magazines, as the authors are specialists on their field. NASW News is a good example a trade publication in social work, published by the National Association of Social Workers. Its intended audience is social work practitioners who want to know about important practice issues. They report news and trends in a field but not scholarly research. They may also provide product or service reviews, job listings, and advertisements.

So, can you use trade publications in a formal research proposal? Again, if you’re in my class, the answer would be “probably not.” A main shortcoming trade publication is the lack of peer review. Peer review refers to a formal process in which other esteemed researchers and experts ensure your work meets the standards and expectations of the professional field. While trade publications do contain a staff of editors, the level of review is not as stringent as academic journal articles. On the other hand, if you are doing a study about practitioners, then trade publications may be quite relevant sources for your proposal. Peer review is part of the cycle of publication illustrated below and acts as a gatekeeper, ensuring that only top-quality articles are published. While peer review is far from perfect, the process provides for stricter scrutiny of scientific publications.

In summary, newspapers and other popular press publications are useful for getting general topic ideas. Trade publications are useful for practical application in a profession and may also be a good source of keywords for future searching. Scholarly journals are the conversation of the scholars who are doing research in a specific discipline and publishing their research findings.

Types of journal articles

As you’ve probably heard by now, academic journal articles are considered to be the most reputable sources of information, particularly in research methods courses. Journal articles are written by scholars with the intended audience of other scholars (like you!) interested in the subject matter. The articles are often long and contain extensive references for the arguments made by the author. The journals themselves are often dedicated to a single topic, like violence or child welfare, and include articles that seek to advance the body of knowledge about their chosen topic.


print editions of journals in the economics discipline on a desk stacked on a desk

Most journals are peer-reviewed or refereed, which means a panel of scholars reviews articles to decide if they should be accepted into a specific publication. Scholarly journals provide articles of interest to experts or researchers in a discipline. An editorial board of respected scholars (peers) reviews all articles submitted to a journal. Editors and volunteer reviewers decide if the article provides a noteworthy contribution to the field and should be published. For this reason, journal articles are the main source of information for researchers and for literature reviews. You can tell whether a journal is peer reviewed by going to its website. Usually, under the “About Us” section, the website will list the editorial board or otherwise note its procedures for peer review. If a journal does not provide such information, you may have found a “predatory journal.” These journals will publish any article—no matter how bad it is—as long as the author pays them. Not all journals are created equal!

A kind of peer review also occurs after publication. Scientists regularly read articles and use them to inform their research. A seminal article is “a classic work of research literature that is more than 5 years old and is marked by its uniqueness and contribution to professional knowledge” (Houser, 2018, p. 112). Houser, J., (2018). Nursing research reading, using, and creating evidence (4th ed.). Burlington, MA: Jones & Bartlett. Basically, it is a really important article. Seminal articles are cited a lot in the literature. You can see how many authors have cited an article using Google Scholar’s citation count feature when you search for the article. Generally speaking, articles that have been cited more often are considered more reputable. There is nothing wrong with citing an article with a low citation count, but it is an indication that not many other scholars have found the source to be useful or important.

Journal articles fall into a few different categories. Empirical articles apply theory to a behavior and reports the results of a quantitative or qualitative data analysis conducted by the author. Just because an article includes quantitative or qualitative results does not mean it is an empirical journal article. Since most articles contain a literature review with empirical findings, you need to make sure the finds reported in the study are from the author’s own analysis. Fortunately, empirical articles follow a similar structure—introduction, method, results, and discussion sections appear in that order. While the exact headings may differ slightly from publication to publication and other sections like conclusions, implications, or limitations may appear, this general structure applies to nearly all empirical journal articles.

Theoretical articles, by contrast, do not follow a set structure. They follow whatever format the author finds most useful to organize their information. Theoretical articles discuss a theory, conceptual model, or framework for understanding a problem. They may delve into philosophy or values, as well. Theoretical articles help you understand how to think about a topic and may help you make sense of the results of empirical studies. Practical articles describe “how things are done” (Wallace & Wray, 2016, p. 20). Wallace, M., & Wray, A. (2016). Critical reading and writing for postgraduates (3rd ed.). Thousand Oaks, CA: Sage Publications. They are usually shorter than other types of articles and are intended to inform practitioners of a discipline on current issues. They may also provide a reflection on a “hot topic” in the practice domain, a complex client situation, or an issue that may affect the profession as a whole.

No one type of article is better than the other, as each serves a different purpose. Seminal articles relevant to your topic area are important to read because of their influence on the field. Theoretical articles will help you understand the social theory behind your topic. Empirical articles should test those theories quantitatively or create those theories qualitatively, a process we will discuss in greater detail later in this book.  Practical articles will help you understand a practitioner’s perspective, though these are less useful when writing a literature review as they only present a single person’s opinions on a topic.

Other sources of information

As I mentioned previously, newspaper and magazine articles are good places to start your search (though they should not be the end of your search!). Another source students go to almost immediately is Wikipedia. Wikipedia is a marvel of human knowledge. It is a digital encyclopedia to which anyone can contribute. The entries for each Wikipedia article are overseen by skilled and specialized editors who volunteer their time and knowledge to making sure their articles are correct and up to date. Wikipedia is an example of a tertiary source. We reviewed primary and secondary sources in the previous section. Tertiary sources synthesize or distill primary and secondary sources. Examples of tertiary sources include encyclopedias, directories, dictionaries, and textbooks like this one. Tertiary sources are an excellent place to start (but are not a good place to end your search). A student might consult Wikipedia or the Encyclopedia of Social Work (available at http://socialwork.oxfordre.com/) to get a general idea of the topic.

The difference between secondary and tertiary sources is not exact, and as we’ve discussed, using one or both at the beginning of a project is a good idea. As your study of the topic progresses, you will naturally have to transition away from secondary and tertiary sources and towards primary sources. We’ve already talked about one particular kind of primary source—the academic journal article. We will spend more time on this primary source than any other in this textbook. However, it is important to understand how other types of sources can be used as well.


a small metal door surrounded by bookcases stuffed with books

Books contain important scholarly information. They are particularly helpful for theoretical, philosophical, and historical inquiry. For example, in my research on self-determination for individuals with intellectual and developmental disabilities, I needed to define and explore the concept of self-determination. I learned how to define it from the philosophical literature on self-determination and the advocacy literature contained in books. You can use books to learn definitions, key concepts, and keywords you can use to find additional sources. They will help you understand the scope and foundations of a topic and how it has changed over time. Some books contain chapters that look like academic journal articles. These are called edited volumes, and they contain articles that may not have made it into academic journals or seminal articles that are republished in the book. Edited volumes are considered less reputable than journal articles, as they do not have as strong of a peer review process. However, papers in social science journals will often include references to books and edited volumes.

Conferences are a great source of information. At conferences such as the Council on Social Work Education’s Annual Program Meeting or your state’s NASW conference, researchers present papers on their most recent research and obtain feedback from the audience. The papers presented at conferences are sometimes published in a volume called a conference proceeding. Conference proceedings highlight current discussion in a discipline and can lead you to scholars who are interested in specific research areas. A word about conference papers: several factors contribute to making these documents difficult to find. It is not unusual that papers delivered at professional conferences are not published in print or electronic form, although an abstract may be available. In these cases, the full paper may only be available from the author or authors. The most important thing to remember is that if you have any difficulty finding a conference proceeding or paper, ask a librarian for assistance.

Another source of information is the gray literature, which is research and information released by non-commercial publishers, such as government agencies, policy organizations, and think-tanks. If you have already taken a policy class, perhaps you’ve come across the Center on Budget and Policy Priorities (https://www.cbpp.org/). CBPP is a think tank or a group of scholars that conduct research and perform advocacy on social issues. Similarly, students often find the Centers for Disease Control website helpful for understanding the prevalence of social problems like mental illness and child abuse.  Think tanks and policy organizations often have a specific viewpoint they support. There are conservative, liberal, and libertarian think tanks, for example. Policy organizations may be funded by private businesses to push a given message to the public. Government agencies are generally more objective, though they may be less critical of government programs than other sources might be. The main shortcoming of gray literature is the lack of peer review that is found in academic journal articles, though many gray literature sources are of good quality.

Dissertations and theses can be rich sources of information and have extensive reference lists to scan for resources. They are considered gray literature because they are not peer reviewed. The accuracy and validity of the paper itself may depend on the school that awarded the doctoral or master’s degree to the author. Having completed a dissertation, they take a long time to write and a long time to read. If you come across a dissertation that is relevant, it is a good idea to read the literature review and plumb the sources the author uses in your literature search. However, the data analysis from these sources is considered less reputable as it has not passed through peer review yet. Consider searching for journal articles by the author to see if any of the results passed peer review. You will also be thankful that journal articles are much shorter than dissertations and theses!

The final source of information we must talk about is webpages. My graduate research focused on substance abuse and drugs, and I was fond of reading Drug War Rant (http://www.drugwarrant.com/), a blog about drug policy. It provided me with breaking news about drug policy and editorial opinion about the drug war. I would never cite the blog in a research proposal, but it was an excellent source of information that warranted further investigation. Webpages will also help you locate professional organizations and human service agencies that address your problem. Looking at their social media feeds, reports, publications, or “news” sections on an organization’s webpage can clue you into important topics to study. Because anyone can begin their own webpage, they are usually not considered scholarly sources to use in formal writing, but they are still useful when you are first learning about a topic. Additionally, many advocacy webpages will provide references for the facts they site, providing you with the primary source of the information.

As you think about each source, remember:

All information sources are not created equal. Sources can vary greatly in terms of how carefully they are researched, written, edited, and reviewed for accuracy. Common sense will help you identify obviously questionable sources, such as tabloids that feature tales of alien abductions, or personal websites with glaring typos. Sometimes, however, a source’s reliability—or lack of it—is not so obvious…You will consider criteria such as the type of source, its intended purpose and audience, the author’s (or authors’) qualifications, the publication’s reputation, any indications of bias or hidden agendas, how current the source is, and the overall quality of the writing, thinking, and design. (Writing for Success, 2015, p. 448). Writing for Success (2015). Strategies for gathering reliable information. http://open.lib.umn.edu/writingforsuccess/chapter/11-4-strategies-for-gathering-reliable-information/

While each of these sources is an important part of how we learn about a topic, your research should focus on finding academic journal articles about your topic. These are the primary sources of the research world. While it may be acceptable and necessary to use other primary sources—like books, government reports, or an investigative article by a newspaper or magazine—academic journal articles are preferred. Finding these journal articles is the topic of the next section.


Key Takeaways

  • Social work involves reading research from a variety of disciplines.
  • While secondary and tertiary sources are okay to start with, primary sources provide the most accurate and authoritative information about a topic.
  • Peer-reviewed journal articles are considered the best source of information for literature reviews, though other sources are often used.
  • Peer review is the process by which other scholars evaluate the merits of an article before publication.
  • Social work research requires critical evaluation of each source in a literature review


Glossary

  • Empirical articles- apply theory to a behavior and reports the results of a quantitative or qualitative data analysis conducted by the author
  • Gray literature- research and information released by non-commercial publishers, such as government agencies, policy organizations, and think-tanks
  • Peer review- a formal process in which other esteemed researchers and experts ensure your work meets the standards and expectations of the professional field
  • Practical articles- describe “how things are done” in practice (Wallace & Wray, 2016, p. 20)
  • Primary source- published results of original research studies
  • Secondary source- interpret, discuss, summarize original sources
  • Seminal articles– classic work noted for its contribution to the field and high citation count
  • Tertiary source- synthesize or distill primary and secondary sources, such as Wikipedia
  • Theoretical articles – articles that discuss a theory, conceptual model or framework for understanding a problem


Image Attributions

Knowledge by geralt CC-0

Yahoo news portal by Simon CC-0

Research journals by M. Imran CC-0

Books door entrance culture by ninocare CC-0


9

2.3 Finding literature

Learning Objectives

  • Describe useful strategies to employ when searching for literature
  • Identify how to narrow down search results to the most relevant sources


One of the drawbacks (or joys, depending on your perspective) of being a researcher in the 21st century is that we can do much of our work without ever leaving the comfort of our recliners. This is certainly true of familiarizing yourself with the literature. Most libraries offer incredible online search options and access to important databases of academic journal articles.

A literature search usually follows these steps:

  1. Building search queries
  2. Finding the right database
  3. Skimming the abstracts of articles
  4. Looking at authors and journal names
  5. Examining references
  6. Searching for meta-analyses and systematic reviews

Step 1: Building a search query with keywords

What do you type when you are searching for something on Google? Are you a question-asker? Do you type in full sentences or just a few keywords? What you type into a database or search engine like Google is called a query. Well-constructed queries get you to the information you need faster, while unclear queries will force you to sift through dozens of irrelevant articles before you find the ones you want.


Google logo with a magnifying glass on top of the two o's

The words you use in your search query will determine the results you get. Unfortunately, different studies often use different words to mean the same thing. A study may describe its topic as substance abuse, rather than addiction. Think of different keywords that are relevant to your topic area and write them down. Often in social work research, there is a bit of jargon to learn in crafting your search queries. If you wanted to learn more about people of low-income who do not have access to a bank account, you may need to learn the jargon term “unbanked,” which refers to people without bank accounts, and include “unbanked” in your search query. If you wanted to learn about children who take on parental roles in families, you may need to include “parentification” as part of your search query. As undergraduate researchers, you are not expected to know these terms ahead of time. Instead, start with the keywords you already know. Once you read more about your topic, start including new keywords that will return the most relevant search results for you.

Google is a “natural language” search engine, which means it tries to use its knowledge of how people to talk to better understand your query. Google’s academic database, Google Scholar, incorporates that same approach. However, other databases that are important for social work research—such as Academic Search Complete, PSYCinfo, and PubMed—will not return useful results if you ask a question or type a sentence or phrase as your search query. Instead, these databases are best used by typing in keywords. Instead of typing “the effects of cocaine addiction on the quality of parenting,” you might type in “cocaine AND parenting” or “addiction AND child development.” Note: you would not actually use the quotation marks in your search query for these examples.

These operators (AND, OR, NOT) are part of what is called Boolean searching. Boolean searching works like a simple computer program. Your search query is made up of words connected by operators. Searching for “cocaine AND parenting” returns articles that mention both cocaine and parenting. There are lots of articles on cocaine and lots of articles on parenting, but fewer articles on both of those topics. In this way, the AND operator reduces the number of results you will get from your search query because both terms must be present. The NOT operator also reduces the number of results you get from your query. For example, perhaps you wanted to exclude issues related to pregnancy. Searching for “cocaine AND parenting NOT pregnancy” would exclude articles that mentioned pregnancy from your results. Conversely, the OR operator would increase the number of results you get from your query. For example, searching for “cocaine OR parenting” would return not only articles that mentioned both words but also those that mentioned only one of your two search terms. This relationship is visualized in Figure 2.1 below.


three venn diagrams showing the function of the and, or, and not operators. And is the middle area shared by the two circles. Or highlights all parts of both circles. Not highlights only the non-overlapping parts of one circle.
Figure 2.1 Boolean queries

Figure 2.1 copied from image “Search operators” by TU Delft Libraries (2017).  Shared using a CC-BY 4.0 license (https://creativecommons.org/licenses/by/4.0/). Retrieved from: https://tulib.tudelft.nl/searching-resources/search-operators/

As my students have said in the past, probably the most frustrating part about literature searching is looking at the number of search results for your query. How could anyone be expected to look at hundreds of thousands of articles on a topic? Don’t worry. You don’t have to read all those articles to know enough about your topic area to produce a good research study. A good search query should bring you to at least a few relevant articles to your topic, which is more than enough to get you started. However, an excellent search query can narrow down your results to a much smaller number of articles, all of which are specifically focused on your topic area. Here are some tips for reducing the number of articles in your topic area:

  1. Use quotation marks to indicate exact phrases, like “mental health” or “substance abuse.”
  2. Search for your keywords in the ABSTRACT. A lot of your results may be from articles about irrelevant topics simply that mention your search term once. If your topic isn’t in the abstract, chances are the article isn’t relevant. You can be even more restrictive and search for your keywords in the TITLE. Academic databases provide these options in their advanced search tools.
  3. Use multiple keywords in the same query. Simply adding “addiction” onto a search for “substance abuse” will narrow down your results considerably.
  4. Use a SUBJECT heading like “substance abuse” to get results from authors who have tagged their articles as addressing the topic of substance abuse. Subject headings are likely to not have all the articles on a topic but are a good place to start.
  5. Narrow down the years of your search. Unless you are gathering historical information about a topic, you are unlikely to find articles older than 10-15 years to be useful. They no longer tell you the current knowledge on a topic. All databases have options to narrow your results down by year.
  6. Talk to a librarian. They are professional knowledge-gatherers, and there is often a librarian assigned to your department. Their job is to help you find what you need to know.

Step 2: Finding the right database

The big four databases you will probably use for finding academic journal articles relevant to social work are: Google Scholar, Academic Search Complete, PSYCinfo, and PubMed. Each has distinct advantages and disadvantages.

Because Google Scholar is a natural language search engine, you are more likely to get what you want without having to fuss with wording. It can be linked via Library Links to your university login, allowing you to access journal articles with one click on the Google Scholar page. Google Scholar also allows you to save articles in folders and provides a (somewhat correct) APA citation for each article. However, Google Scholar also will automatically display not only journal articles, but books, government and foundation reports, and gray literature. You need to make sure that the source you are using is reputable. Look for the advanced search feature to narrow down your results further.

Academic Search Complete is available through your school’s library, usually under page titled databases. It is similar to Google Scholar in its breadth, as it contains a number of smaller databases from a variety of social science disciplines (including Social Work Abstracts). You have to use Boolean searching techniques, and there are a number of advanced search features to further narrow down your results.

PSYCinfo and PubMed focus on specific disciplines. PSYCinfo indexes articles on psychology, and PubMed indexes articles related to medical science. Because these databases are more narrowly targeted, you are more likely to get the specific psychological or medical knowledge you desire. If you were to use a more general search engine like Google Scholar, you may get more irrelevant results. Finally, it is worth mentioning that many university libraries have a meta-search engine which searches all the databases to which they have access.

Step 3: Skimming abstracts and downloading articles

Once you’ve settled on your search query and database, you should start to see articles that might be relevant to your topic. Rather than read every article, skim through the abstract and see if that article is really one you need to read. If you like the article, make sure to download the full text PDF to your computer so you can read it later. Part of the tuition and fees your university charges you goes to paying major publishers of academic journals for the privilege of accessing their articles. Because access fees are incredibly costly, your school likely does not pay for access to all the journals in the world. While you are in school, you should never have to pay for access to an academic journal article. Instead, if your school does not subscribe to a journal you need to read, try using inter-library loan to get the article. On your university library’s homepage, there is likely a link to inter-library loan. Just enter the information for your article (e.g. author, publication year, title), and a librarian will work with librarians at other schools to get you the PDF of the article that you need. After you leave school, getting a PDF of an article becomes more challenging. However, you can always ask an author for a copy of their article. They will usually be happy to hear someone is interested in reading and using their work.


older female librarian sorting a cart catalog

What do you do with all of those PDFs? I usually keep mine in folders on my cloud storage drive, arranged by topic. For those who are more ambitious, you may want to use a reference manager like Mendeley or RefWorks, which can help keep your sources and notes organized. At the very least, take notes on each article and think about how it might be of use in your study.

Step 4: Searching for author and journal names

As you scroll through the list of articles in your search results, you should begin to notice that certain authors keep appearing. If you find an author that has written multiple articles on your topic, consider searching the AUTHOR field for that particular author. You can also search the web for that author’s Curriculum Vitae or CV (an academic resume) that will list their publications. Many authors maintain personal websites or host their CV on their university department’s webpage. Just type in their name and “CV” into a search engine. For example, you may find Michael Sherraden’s name often if your search terms are about assets and poverty. You can find his CV on the Washington University of St. Louis website.

Another way to narrow down your results is by journal name. As you are scrolling, you should also notice that many of the articles you’ve skimmed come from the same journals. Searching with that journal name in the JOURNAL field will allow you to narrow down your results to just that journal. For example, if you are searching for articles related to values and ethics in social work, you might want to search within the Journal of Social Work Values and Ethics. You can also navigate to the journal’s webpage and browse the abstracts of the latest issues.

Step 5: Examining references

As you begin to read your articles, you’ll notice that the authors cite additional articles that are likely relevant to your topic area. This is called archival searching. Unfortunately, this process will only allow you to see relevant articles from before the publication date. That is, the reference section of an article from 2014 will only have references from pre-2014. You can use Google Scholar’s “cited by” feature to do a future-looking archival search. Look up an article on Google Scholar and click the “cited by” link. This is a list of all the articles that cite the article you just read. Google Scholar even allows you to search within the “cited by” articles to narrow down ones that are most relevant to your topic area. For a brief discussion about archival searching check out this article by Hammond & Brown (2008): http://www.infotoday.com/cilmag/may08/Hammond_Brown.shtmlHammond, C. C. & Brown, S. W. (2008, May 14). Citation searching: Searching smarter & find more. Computers in libraries. Retrieved from: http://www.infotoday.com/cilmag/may08/Hammond_Brown.shtml

Step 6: Searching for systematic reviews and other sources

Another way to save time in literature searching is to look for articles that synthesize the results of other articles. Systematic reviews provide a summary of the existing literature on a topic. If you find one on your topic, you will be able to read one person’s summary of the literature and go deeper by reading their references. Similarly, meta-analyses and meta-syntheses have long reference lists that are useful for finding additional sources on a topic. They use data from each article to run their own quantitative or qualitative data analysis. In this way, meta-analyses and meta-syntheses provide a more comprehensive overview of a topic. To find these kinds of articles, include the term “meta-analysis,” “meta-synthesis,” or “systematic review” to your search terms. Another way to find systematic reviews is through the Cochrane Collaboration or Campbell Collaboration. These institutions are dedicated to producing systematic reviews for the purposes of evidence-based practice.

Putting it all together

Familiarizing yourself with research that has already been conducted on your topic is one of the first stages of conducting a research project and is crucial for coming up with a good research design. But where to start? How to start? Earlier in this chapter you learned about some of the most common databases that house information about published social work research. As you search for literature, you may have to be fairly broad in your search for articles. Let’s walk through an example. Dr. Blackstone, one of the original authors of this textbook, relates an example from her research methods class: On a college campus nearby, much to the chagrin of a group of student smokers, smoking was recently banned. These students were so upset by the idea that they would no longer be allowed to smoke on university grounds that they staged several smoke-outs during which they gathered in populated areas around campus and enjoyed a puff or two together.


cigarette with a line through it

A student in her research methods class wanted to understand what motivated this group of students to engage in activism centered on what she perceived to be, in this age of smoke-free facilities, a relatively deviant act. Were the protesters otherwise politically active? How much effort and coordination had it taken to organize the smoke-outs? The student researcher began her research by attempting to familiarize herself with the literature on her topic. Yet her search in Academic Search Complete for “college student activist smoke-outs,” yielded no results. Concluding there was no prior research on her topic, she informed her professor that she would not be able to write the required literature review since there was no literature for her to review. How do you suppose her professor responded to this news? What went wrong with this student’s search for literature?

In her first attempt, the student had been too narrow in her search for articles. But did that mean she was off the hook for completing a literature review? Absolutely not. Instead, she went back to Academic Search Complete and searched again using different combinations of search terms. Rather than searching for “college student activist smoke-outs” she tried, among other sets of terms, “college student activism.” This time her search yielded a great many articles. Of course, they were not focused on pro-smoking activist efforts, but they were focused on her population of interest, college students, and on her broad topic of interest, activism. Her professor suggested that reading articles on college student activism might give her some idea about what other researchers have found in terms of what motivates college students to become involved in activist efforts. Her professor also suggested she could play around with her search terms and look for research on activism centered on other sorts of activities that are perceived by some as deviant, such as marijuana use or veganism. In other words, she needed to be broader in her search for articles.

While this student found success by broadening her search for articles, her reading of those articles needed to be narrower than her search. Once she identified a set of articles to review by searching broadly, it was time to remind herself of her specific research focus: college student activist smoke-outs. Keeping in mind her particular research interest while reviewing the literature gave her the chance to think about how the theories and findings covered in prior studies might or might not apply to her particular point of focus. For example, theories on what motivates activists to get involved might tell her something about the likely reasons the students she planned to study got involved. At the same time, those theories might not cover all the particulars of student participation in smoke-outs. Thinking about the different theories then gave the student the opportunity to focus her research plans and even to develop a few hypotheses about what she thought she was likely to find.


Key Takeaways

  • When identifying and reading relevant literature, be broad in your search for articles, but be narrower in your reading of articles.
  • Conducting a literature search involves the skillful use of keywords to find relevant articles.
  • It is important to narrow down the number of articles in your search results to only those articles that are most relevant to your inquiry.


Glossary

  • Query- search terms used in a database to find sources


III

3. Reading and evaluating literature

10

3.0 Chapter introduction

I can spend hours looking for articles online. I love browsing around and searching on Google Scholar for articles to download and read. Unfortunately, once I have acquired a dozen or so articles I start to feel overwhelmed that I actually have to read these articles. It certainly takes a lot of time to do it right, even for faculty. In this chapter, we will learn how to understand and evaluate the sources you find. We will also review how your research questions might change as you start reading in your area of interest and learn more.

Chapter outline

Content advisory

This chapter discusses or mentions the following topics: sexual harassment and gender-based violence, mental health, pregnancy, and obesity.

11

3.1 Reading an empirical journal article

Learning Objectives

  • Identify the key components of empirical journal articles
  • Define the basic elements of the results section in a journal article
  • Describe statistical significance and confidence intervals


Reading scholarly articles can be a more challenging than reading a book, magazine, news article—or even some textbooks. Theoretical and practical articles are, generally speaking, easier to understand. Empirical articles, because they add new knowledge, must go through great detail to demonstrate that the information they offer is based on solid science. Empirical articles can be challenging to read, and this section is designed to make that process easier for you.


a man in an army uniform reads a book in a library

Nearly all articles will have an abstract, the short paragraph at the beginning of an article that summarizes the author’s research question, methods used to answer the question, and key findings. The abstract may also give you some idea about the theoretical perspective of the author. So, reading the abstract gives you both a framework for understanding the rest of the article and its punch line–what the author(s) found and whether the article is relevant to your area of inquiry. For this reason, I suggest skimming abstracts as part of the literature search process.

As you will recall from Chapter 2, theoretical articles have no set structure and will look similar to reading a chapter of a book. Empirical articles contain the following sections (although exact section names vary): introduction, methods, results, and discussion. The introduction contains the literature review for the article and is an excellent source of information as you build your own literature review. The methods section reviews how the author gathered their sample, how they measured their variables, and how the data were analyzed. The results section provides an in-depth discussion of the findings of the study. The discussion section reviews the main findings and addresses how those findings fit in with the existing literature. Of course, there will also be a list of references (which you should read!) and there may be a few tables, figures, or appendices at the end of the article as well.

While you should get into the habit of familiarizing yourself with each part of the articles you wish to cite, there are strategic ways to read journal articles that can make them a little easier to digest. Once you have read the abstract for an article and determined it is one you’d like to read in full, read through the introduction and discussion sections next. Because your own review of literature is likely to emphasize findings from previous literature, you should mine the article you’re reading for what’s important to know about your topic. Reading the introduction helps you see the findings and articles the author considers to be significant in the topic area. Reading an article’s discussion section helps you understand what the author views as their study’s major findings and how the author perceives those findings to relate to other research.

As you progress through your research methods course, you will pick up additional research elements that are important to understand. You will learn how to identify qualitative and quantitative methods, the criteria for establishing causality, different types of causality, as well as exploratory, explanatory, and descriptive research. Subsequent chapters of this textbook will address other elements of journal articles, including choices about measurement, sampling, and design. As you learn about these additional items, you will find that the methods and results sections begin to make more sense and you will understand how the authors reached their conclusions.

As you read a research report, there are several questions you can ask yourself about each section, from abstract to conclusion. Those questions are summarized in Table 3.1. Keep in mind that the questions covered here are designed to help you, the reader, to think critically about the research you come across and to get a general understanding of the strengths, weaknesses, and key takeaways from a given study. I hope that by considering how you might respond to the following questions while reading research reports, you’ll gain confidence in describing the report to others and discussing its meaning and impact with them.

Table 3.1 Questions worth asking while reading research reports
Report section Questions worth asking
Abstract What are the key findings? How were those findings reached? What framework does the researcher employ?
Acknowledgments Who are this study’s major stakeholders? Who provided feedback? Who provided support in the form of funding or other resources?
Problem statement (introduction) How does the author frame their research focus? What other possible ways of framing the problem exist? Why might the author have chosen this particular way of framing the problem?
Literature review
(introduction)
How selective does the researcher appear to have been in identifying relevant literature to discuss? Does the review of literature appear appropriately extensive? Does the researcher provide a critical review?
Sample (methods) Where was the data collected?  Did the researcher collect their own data or use someone else’s data?  What population is the study trying to make claims about, and does the sample represent that population well?  What are the sample’s major strengths and major weaknesses?
Data collection (methods) How were the data collected? What do you know about the relative strengths and weaknesses of the method employed? What other methods of data collection might have been employed, and why was this particular method employed? What do you know about the data collection strategy and instruments (e.g., questions asked, locations observed)? What don’t you know about the data collection strategy and instruments?
Data analysis (methods) How were the data analyzed? Is there enough information provided for you to feel confident that the proper analytic procedures were employed accurately?
Results What are the study’s major findings? Are findings linked back to previously described research questions, objectives, hypotheses, and literature? Are sufficient amounts of data (e.g., quotes and observations in qualitative work, statistics in quantitative work) provided in order to support conclusions drawn? Are tables readable?
Discussion/conclusion Does the author generalize to some population beyond her/his/their sample? How are these claims presented? Are claims made supported by data provided in the results section (e.g., supporting quotes, statistical significance)? Have limitations of the study been fully disclosed and adequately addressed? Are implications sufficiently explored?

Understanding the results section

As mentioned previously in this chapter, reading the abstract that appears in most reports of scholarly research will provide you with an excellent, easily digestible review of a study’s major findings and of the framework the author is using to position their findings. Abstracts typically contain just a few hundred words, so reading them is a nice way to quickly familiarize yourself with a study. If the study seems relevant to your paper, it’s probably worth reading more. If it’s not, then you have only spent a minute or so reading the abstract. Another way to get a snapshot of the article is to scan the headings, tables, and figures throughout the report (Green & Simon, 2012). Green, W. & Simon, B. L. (2012). The Columbia guide to social work writing. New York, NY: Columbia University Press.

At this point, I have read hundreds of literature reviews written by students. One of the challenges I have noted is that students will report the summarized results from the abstract, rather than the detailed findings in the results section of the article. This is a problem when you are writing a literature review because you need to provide specific and clear facts that support your reading of the literature. The abstract may say something like: “we found that poverty is associated with mental health status.” For your literature review, you want the details, not the summary. In the results section of the article, you may find a sentence that states: “for households in poverty, children are three times more likely to have a mental health diagnosis.” This more detailed information provides a stronger basis on which to build a literature review.

Using the summarized results in an abstract is an understandable mistake to make. The results section often contains diagrams and symbols that are challenging to understand. Often, without having completed more advanced coursework on statistical or qualitative analysis, some of the terminology, symbols, or diagrams may be difficult to comprehend. To that end, the purpose of this section is to improve reading comprehension by providing an introduction to the basic components of a results section.

Journal articles often contain tables, and scanning them is a good way to begin reading an article. A table provides a quick, condensed summary of the report’s key findings. The use of tables is not limited to one form or type of data, though they are used most commonly in quantitative research. Tables are a concise way to report large amounts of data. Some tables present descriptive information about a researcher’s sample, which is often the first table in a results section. These tables will likely contain frequencies (N) and percentages (%). For example, if gender happened to be an important variable for the researcher’s analysis, a descriptive table would show how many and what percent of all study participants are women, men, or other genders. Frequencies or “how many” will probably be listed as N, while the percent symbol (%) might be used to indicate percentages.

In a table presenting a causal relationship, two sets of variables are represented. The independent variable, or cause, and the dependent variable, the effect. We’ll go into more detail on variables in Chapter 6. The independent variable attributes are typically presented in the table’s columns, while dependent variable attributes are presented in rows. This allows the reader to scan across a table’s rows to see how values on the dependent variable attributes change as the independent variable attribute values change. Tables displaying results of quantitative analysis will also likely include some information about the strength and statistical significance of the relationships presented in the table. These details tell the reader how likely it is that the relationships presented will have occurred simply by chance.

Let’s look at a specific example. Table 3.2, which is based on data from a study of older workers conducted by Dr. Blackstone, an original author of this textbook. It presents the causal relationship between gender and experiencing harassing behaviors at work. In this example, gender is the independent variable (the cause) and the harassing behaviors listed are the dependent variables (the effects). It wouldn’t make any sense to say that people’s workplace experiences cause their gender, so in this example, the question of which is the independent variable and which are the dependent variables has a pretty obvious answer. Therefore, we place gender in the table’s columns and harassing behaviors in the table’s rows.

Reading across the table’s top row, we see that 2.9% of women in the sample reported experiencing subtle or obvious threats to their safety at work, while 4.7% of men in the sample reported the same. We can read across each of the rows of the table in this way. Reading across the bottom row, we see that 9.4% of women in the sample reported experiencing staring or invasion of their personal space at work while just 2.3% of men in the sample reported having the same experience. We’ll discuss p value later in this section.

Table 3.2 Percentage reporting harassing behaviors at work
Behavior Experienced at work Women Men p value
Subtle or obvious threats to your safety 2.9% 4.7% 0.623
Being hit, pushed, or grabbed 2.2% 4.7% 0.480
Comments or behaviors that demean your gender 6.5% 2.3% 0.184
Comments or behaviors that demean your age 13.8% 9.3% 0.407
Staring or invasion of your personal space 9.4% 2.3% 0.039
Note: Sample size was 138 for women and 43 for men.

These statistics represent what the researchers found in their sample, and they are using their sample to make conclusions about the true population of all employees in the real world. Because the methods we use in social science are never perfect, there is some amount of error in that value. The researchers in this study estimated the true value we would get if we asked every employee in the world the same questions on our survey. Researchers will often provide a confidence interval, or a range of values in which the true value is likely to be, to provide a more accurate description of their data. For example, at the time I’m writing this, my wife and I are expecting our first child next month. The doctor told us our due date was August 15th. But the doctor also told us that August 15th was only their best estimate. They were actually 95% sure our baby might be born any time between August 1st and September 1st. Confidence intervals are often listed with a percentage, like 90% or 95%, and a range of values, such as between August 1st and Setptember 1st. You can read that as: we are 95% sure your baby will be born between August 1st and September 1st. So, while we get a due date of August 15th, the uncertainty about the exact date is reflected in the confidence interval provided by our doctor.

Of course, we cannot assume that these patterns didn’t simply occur by chance. How confident can we be that the findings presented in the table did not occur by chance? This is where tests of statistical significance come in handy. Statistical significance tells us the likelihood that the relationships we observe could be caused by something other than chance. While your statistics class will give you more specific details on tests of statistical significance and reading quantitative tables, the important thing to be aware of as a non-expert reader of tables is that some of the relationships presented will be statistically significant and others may not be. Tables should provide information about the statistical significance of the relationships presented. When reading a researcher’s conclusions, pay attention to which relationships are statistically significant and which are not.

In Table 3.2, you may have noticed that a p value is noted in the very last column of the table. A p value is a statistical measure of the probability that there is no relationship between the variables under study. Another way of putting this is that the p value provides guidance on whether or not we should reject the null hypothesis. The null hypothesis is simply the assumption that no relationship exists between the variables in question. In Table 3.2, we see that for the first behavior listed, the p value is 0.623. This means that there is a 62.3% chance that the null hypothesis is correct in this case. In other words, it seems likely that any relationship between observed gender and experiencing threats to safety at work in this sample is simply due to chance.

In the final row of the table, however, we see that the p value is 0.039. In other words, there is a 3.9% chance that the null hypothesis is correct. Thus, we can be somewhat more confident than in the preceding example that there may be some relationship between a person’s gender and their experiencing the behavior noted in this row. Statistical significance is reported in reference to a value, usually 0.05 in the social science. This means that the probability that the relationship between gender and experiencing staring or invasion of personal space at work is due to random chance is less than 5 in 100. Social science often uses 0.05, but other values are used. Studies using 0.1 are using a more forgiving standard of significance, and therefore, have a higher likelihood of error (10%). Studies using 0.01 are using a more stringent standard of significance, and therefore, have a lower likelihood of error (1%).

Notice that I’m hedging my bets here by using words like somewhat and may be. When testing hypotheses, social scientists generally phrase their findings in terms of rejecting the null hypothesis rather than making bold statements about the relationships observed in their tables. You can learn more about creating tables, reading tables, and tests of statistical significance in a class focused exclusively on statistical analysis. For now, I hope this brief introduction to reading tables will improve your confidence in reading and understanding the quantitative tables you encounter while reading reports of social science research.

A final caveat is worth noting here. The previous discussion of tables and reading the results section is applicable to quantitative articles. Quantitative articles will contain a lot of numbers and the results of statistical tests demonstrating association between those numbers. Qualitative articles, on the other hand, will consist mostly of quotations from participants. For most qualitative articles, the authors want to put their results in the words of their participants, as they are the experts. The results section may be organized by theme, with each paragraph or subsection illustrating through quotes how the authors interpret what people in their study said.\


Key Takeaways

  • Reading a research article requires reading beyond the abstract.
  • In tables presenting causal relationships, the independent variable is typically presented in the table’s columns while the dependent variables are presented in the table’s rows.
  • When reading a research report, there are several key questions you should ask yourself for each section of the report.


Glossary

  • Abstract- the short paragraph at the beginning of an article that summarizes the its main point
  • Confidence interval- a range of values in which the true value is likely to be
  • Null hypothesis- the assumption that no relationship exists between the variables in question
  • P-value- a statistical measure of the probability that there is no relationship between the variables under study
  • Statistical significance- the likelihood that the relationships that are observed could be caused by something other than chance
  • Table- a quick, condensed summary of the report’s key findings


Image Attributions

CSAF releases 2009 reading list by Master Sgt. Steven Goetsch public domain


12

3.2 Evaluating sources

Learning Objectives

  • Critically evaluate the sources of the information you have found
  • Apply the information from each source to your research proposal
  • Identify how to be a responsible consumer of research


In Chapter 2, you developed a “working question” to guide your inquiry and learned how to use online databases to find sources. By now, you’ve hopefully collected a number of academic journal articles relevant to your topic area. It’s now time to evaluate the information you found. Not only do you want to be sure of the source and the quality of the information, but you also want to determine whether each item is an appropriate fit for your literature review.

This is also the point at which you make sure you have searched for and obtained publications for all areas of your research question and that you go back into the literature for another search, if necessary. You may also want to consult with your professor or the syllabus for your class to see what is expected for your literature review. In my class, I have specific questions I will ask students to address in their literature reviews.


checking off qualifications on a piece of paper using a pen

It is likely that most of the resources you locate for your review will be from the scholarly literature of your discipline or in your topic area. As we have already seen, peer-reviewed articles are written by and for experts in a field. They generally describe formal research studies or experiments with the purpose of providing insight on a topic. You may have located these articles through the four databases in Chapter 2 or through archival searching. You now may want to know how to evaluate the usefulness for your research.

In general, when we discuss evaluation of sources, we are talking about quality, accuracy, relevance, bias, reputation, currency, and credibility factors in a specific work, whether it’s a book, ebook, article, website, or blog posting. Before you include a source in your literature review, you should clearly understand what it is and why you are including it. According to Bennard et al. (2014), “Using inaccurate, irrelevant, or poorly researched sources can affect the quality of your own work” (para. 4). When evaluating a work for inclusion in, or exclusion from, your literature review, ask yourself a series of questions about each source.

    1. Is the information outdated? Is the source more than 5-10 years old? If so, it will not provide what we currently know about the topic–just what we used to know. Older sources are helpful for historical information, but unless historical analysis is the focus of your literature review, try to limit your sources to those that are current.
    2. How old are the sources used by the author? If you are reading an article from 10 years ago, they are likely citing material from 15-20 years ago. Again, this does not reflect what we currently know about a topic.
    3. Does the author have the credentials to write on the topic? Search the author’s name in a general web search engine like Google. What are the researcher’s academic credentials? What else has this author written? Search by author in the databases and see how much they have published on any given subject.
    4. Who published the source? Books published under popular press imprints (such as Random House or Macmillan) will not present scholarly research in the same way as Sage, Oxford, Harvard, or the University of Washington Press. For grey literature and websites, check the About Us page to learn more about potential biases and funding of the organization who wrote the report.
    5. Is the source relevant to your topic? How does the article fit into the scope of the literature on this topic? Does the information support your thesis or help you answer your question, or is it a challenge to make some kind of connection? Does the information present an opposite point of view, so you can show that you have addressed all sides of the argument in your paper? Many times, literature searches will include articles that ultimately are not that relevant to your final topic. You don’t need to read everything!
    6. How important is this source in the literature? If you search for the article on Google Scholar (see Figure 3.1 for an example of a search result from Google Scholar), you can see how many other sources cited this information. Generally, the higher the number of citations, the more important the article. This is a way to find seminal articles – “A classic work of research literature that is more than 5 years old and is marked by its uniqueness and contribution to professional knowledge” (Houser, 2018, p. 112).
      a google scholar search result with the cited by link circled in red ink
      Figure 3.1 Google Scholar

      Figure 3.1 “The anatomy of the grid” was created by Palreeparit, I. (2008). Shared under a CC BY-NC 2.0 license (https://creativecommons.org/licenses/by-nc/2.0/). Retrieved from: https://www.flickr.com/photos/isriya/2189574180/in/photolist-a9Aag6-dkHnih-a9AaeP-8Zp6Uj-aPaf9T-dnWd4t-akvThj-aGy9Un-bkTacm-3GRVMW-nQvuoX-6tZCiK-s6vUhN-fmnN9M-6S5See-tokn5N-nETnGy-nEUyTv-4ku97Y

    7. Is the source accurate? Check the facts in the article. Can statistics be verified through other sources? Does this information seem to fit with what you have read in other sources?
    8. Is the source reliable and objective? Is a particular point of view or bias immediately obvious, or does it seem objective at first glance? What point of view does the author represent? Are they clear about their point of view? Is the article an editorial that is trying to argue a position? Is the article in a publication with a particular editorial position?
    9. What is the scope of the article? Is it a general work that provides an overview of the topic or is it specifically focused on only one aspect of your topic?
    10. How strong is the evidence in the article? What are the research methods used in the article? Where does the method fall in the hierarchy of evidence?
      • Meta-analysis and meta-synthesis: a systematic and scientific review that uses quantitative or qualitative methods (respectively) to summarize the results of many studies on a topic.
      • Experiments and quasi-experiments: include a group of patients in an experimental group, as well as a control group. These groups are monitored for the variables/outcomes of interest. Randomized control trials are the gold standard.
      • Longitudinal surveys: follow a group of people to identify how variables of interest change over time.
      • Cross-sectional surveys: observe individuals at one point in time and discover relationships between variables.
      • Qualitative studies: use in-depth interviews and analysis of texts to uncover the meaning of social phenomen

The last point above comes with some pretty strong caveats, as no study is really better than another. Foremost, your research question should guide which kinds of studies you collect for your literature review. If you are conducting a qualitative study, you should include some qualitative studies in your literature review so you can understand how others have studied the topic before you. Even if you are conducting a quantitative study, qualitative research is important for understanding processes and the lived experience of people. Any article that demonstrates rigor in thought and methods is appropriate to use in your inquiry.

At the beginning of a project, you may not know what kind of research project you will ultimately propose. It is at this point that consulting a meta-analysis, meta-synthesis, or systematic review might be especially helpful as these articles try to summarize an entire body of literature into one article. Every type of source listed here is reputable, but some have greater explanatory power than others.

Thinking about your project

Thinking about the overarching goals of your research project and finding and reviewing the existing literature on your topic are two of the initial steps you’ll take when designing a research project. Forming a working research question, as discussed in section 2.1, is another crucial step. Creating and refining your research question will help you identify the key concepts you will study. Once you have identified those concepts, you’ll need to decide how to define them, and how you’ll know that you’re observing them when it comes time to collect your data. Defining your concepts, and knowing them when you see them, relates to conceptualization and operationalization. Of course, you also need to know what approach you will take to collect your data. Thus, identifying your research method is another important part of research design.

You also need to think about who your research participants will be and what larger group(s) they may represent. Last, but certainly not least, you should consider any potential ethical concerns that could arise during the course of your research project. These concerns might come up during your data collection, but they might also arise when you get to the point of analyzing or sharing your research results.

Decisions about the various research components do not necessarily occur in sequential order. In fact, you may have to think about potential ethical concerns even before zeroing in on a specific research question. Similarly, the goal of being able to make generalizations about your population of interest could shape the decisions you make about your method of data collection. Putting it all together, the following list shows some of the major components you’ll need to consider as you design your research project. Make sure you have information that will help inform how you think about each component.

Being a responsible consumer of research

Being a responsible consumer of research requires you to take seriously your identity as a social scientist. Now that you are familiar with how to conduct research and how to read the results of others’ research, you have some responsibility to put your knowledge and skills to use. Doing so is in part a matter of being able to distinguish what you do know based on the information provided by research findings from what you do not know. It is also a matter of having some awareness about what you can and cannot reasonably know as you encounter research findings.

When assessing social scientific findings, think about what information has been provided to you. In a scholarly journal article, you will presumably be given a great deal of information about the researcher’s method of data collection, her sample, and information about how the researcher identified and recruited research participants. All of these details provide important contextual information that can help you assess the researcher’s claims. If, on the other hand, you come across some discussion of social scientific research in a popular magazine or newspaper, chances are that you will not find the same level of detailed information that you would find in a scholarly journal article. In this case, what you do and do not know is more limited than in the case of a scholarly journal article. If the research appears in popular media, search for the author or study title in an academic database.

Also, take into account whatever information is provided about a study’s funding source. Most funders want, and in fact require, that recipients acknowledge them in publications. But more popular press may leave out a funding source. In this Internet age, it can be relatively easy to obtain information about how a study was funded. If this information is not provided in the source from which you learned about a study, it might behoove you to do a quick search on the web to see if you can learn more about a researcher’s funding. Findings that seem to support a particular political agenda, for example, might have more or less weight once you know whether and by whom a study was funded.

There is some information that even the most responsible consumer of research cannot know. Because researchers are ethically bound to protect the identities of their subjects, for example, we will never know exactly who participated in a given study. Researchers may also choose not to reveal any personal stakes they hold in the research they conduct. While researchers may “start where they are,” we cannot know for certain whether or how researchers are personally connected to their work unless they choose to share such details. Neither of these “unknowables” is necessarily problematic, but having some awareness of what you may never know about a study does provide important contextual information from which to assess what one can “take away” from a given report of findings.


Key Takeaways

  • Not all published articles are the same. Evaluating sources requires a careful investigation of each source.
  • Being a responsible consumer of research means giving serious thought to and understanding what you do know, what you don’t know, what you can know, and what you can’t know.

Image attributions

130329-A-XX000-001 by Master Sgt. Michael Chann public domain


13

3.3 Refining your question

Learning Objectives

  • Develop and revise questions that focus your inquiry
  • Create a concept map that demonstrates the relationships between concepts


Once you have selected your topic area and reviewed literature related to it, you may need to narrow it to something that can be realistically researched and answered. In the last section, we learned about asking who, what, when, where, why, and how questions. As you read more about your topic area you the focus of your inquiry should become more specific and clear. As a result, you might begin to ask to begin to ask questions that describe a phenomenon, compare one phenomenon with another, or probe the relationship between two concepts.

You might begin by asking a series of PICO questions. Although the PICO method is used primarily in the health sciences, it can also be useful for narrowing/refining a research question in the social sciences as well.  A way to formulate an answerable question using the PICO model could look something like this:

Some examples of how the PICO method is used to refine a research question include:

Another mnemonic technique used in the social sciences for narrowing a topic is SPICE. An example of how SPICE factors can be used to develop a research question is given below:

Setting – for example, a college campus
Perspective – for example, college students
Intervention – for example, text message reminders
Comparisons – for example, telephone message reminders
Evaluation – for example, number of cigarettes used after text message reminder compared to the number of cigarettes used after a telephone reminder

Developing a concept map

Likewise, developing a concept map or mind map around your topic may help you analyze your question and determine more precisely what you want to research. Using this technique, start with the broad topic, issue, or problem, and begin writing down all the words, phrases and ideas related to that topic that come to mind and then ‘map’ them to the original idea. This technique is illustrated in Figure 3.2.


concept map linking storytelling to media character and other concepts. the main block is storytelling, which branches, to narrative structure, which itself branches to open world. Multiple connections between concept boxes are possible and the directionality of the relationship is indicated by arrows.
Figure 3.2 Basic concept map

Figure 3.2 image “gaming and narrative discussion” created by Bryan Alexander (2012). Shared under a CC-BY 2.0 license (https://creativecommons.org/licenses/by/2.0/) and retrieved from: https://www.flickr.com/photos/bryanalexander/6737919649

Concept mapping aims to improve the “description of the breadth and depth of literature in a domain of inquiry. It also facilitates identification of the number and nature of studies underpinning mapped relationships among concepts, thus laying the groundwork for systematic research reviews and meta-analyses” (Lesley, Floyd, & Oermann, 2002, p. 229). Leslie, M., Floyd, J., & Oermann, M. (2002). Use of MindMapper software for research domain mapping. Computers, informatics, nursing, 20(6), 229-235. Its purpose, like the other methods of question refining, is to help you organize, prioritize, and integrate material into a workable research area; one that is interesting, answerable, feasible, objective, scholarly, original, and clear.

In addition to helping you get started with your own literature review, the concept mapping will give you some keywords and concepts that will be useful when you begin searching the literature for relevant studies and publications on your topic. Concept mapping can also be helpful when creating a topical outline or drafting your literature review, as it demonstrates the important of each concept and sub-concepts as well as the relationships between each concept.

For example, perhaps your initial idea or interest is how to prevent obesity. After an initial search of the relevant literature, you realize the topic of obesity is too broad to adequately cover in the time you have to do your literature review. You decide to narrow your focus to causes of childhood obesity. Using PICO factors, you further narrow your search to the influence of family factors on overweight children. A potential research question might then be “What maternal factors are associated with toddler obesity in the United States?” You’re now ready to begin searching the literature for studies, reports, cases, and other information sources that relate to this question.

Similarly, for a broad topic like school performance or grades, and after an initial literature search that provides some variables, examples of a narrow research question might be:

In either case, your literature search, working question, and understanding of the topic are constantly changing as your knowledge of the topic deepens. A literature review is an iterative process, one that stops, starts, and loops back on itself multiple times before completion. As research is a practice behavior of social workers, you should apply the same type of critical reflection to your inquiry as you would to your clinical or macro practice.


Key Takeaways

  • As you read more articles, you should revise your original question to make it more focused and clear.
  • You can further develop the important concepts and relationships for your project by using concept maps and the PICO/SPICE frameworks.


IV

4. Conducting a literature review

14

4.0 Chapter introduction

Whether you plan to engage in clinical, administrative, or policy practice, all social workers must be able to look at the available literature on a topic and synthesize the relevant facts into a coherent review. Literature reviews can have a powerful effect, for example by providing the factual basis for a new program or policy in an agency or government. In your own research proposal, conducting a thorough literature review will help you build strong arguments for why your topic is important and why your research question must be answered.

Chapter outline

Content advisory

This chapter discusses or mentions the following topics: homelessness, suicide, depression, LGBTQ oppression, drug use, and psychotic disorders.

15

4.1 What is a literature review?

Learning Objectives

  • Describe the components of a literature review
  • Recognize commons errors in literature reviews


Pick up nearly any book on research methods and you will find a description of a literature review. At a basic level, the term implies a survey of factual or nonfiction books, articles, and other documents published on a particular subject. Definitions may be similar across the disciplines, with new types and definitions continuing to emerge. Generally speaking, a literature review is a:

Literature reviews are indispensable for academic research. “A substantive, thorough, sophisticated literature review is a precondition for doing substantive, thorough, sophisticated research…A researcher cannot perform significant research without first understanding the literature in the field” (Boote & Beile, 2005, p. 3). Boote, D., & Beile, P. (2005). Scholars before researchers: On the centrality of the dissertation literature review in research preparation. Educational Researcher 34(6), 3-15. In the literature review, a researcher shows she is familiar with a body of knowledge and thereby establishes her credibility with a reader. The literature review shows how previous research is linked to the author’s project, summarizing and synthesizing what is known while identifying gaps in the knowledge base, facilitating theory development, closing areas where enough research already exists, and uncovering areas where more research is needed. (Webster & Watson, 2002, p. xiii). Webster, J., & Watson, R. (2002). Analyzing the past to prepare for the future: Writing a literature review. MIS Quarterly, 26(2), xiii-xxiii. https://web.njit.edu/~egan/Writing_A_Literature_Review.pdf They are often necessary for real world social work practice. Grant proposals, advocacy briefs, and evidence-based practice rely on a review of the literature to accomplish practice goals.


old books on a shelf

A literature review is a compilation of the most significant previously published research on your topic. Unlike an annotated bibliography or a research paper you may have written in other classes, your literature review will outline, evaluate, and synthesize relevant research and relate those sources to your own research question. It is much more than a summary of all the related literature. A good literature review lays the foundation for the importance of the problem your research project addresses defines the main ideas in your research question and their interrelationships.

Literature review basics

All literature reviews, whether they focus on qualitative or quantitative data, will at some point:

  1. Introduce the topic and define its key terms.
  2. Establish the importance of the topic.
  3. Provide an overview of the important literature on the concepts in the research question and other related concepts.
  4. Identify gaps in the literature or controversies.
  5. Point out consistent finding across studies.
  6. Arrive at a synthesis that organizes what is known about a topic, rather than just summarizing.
  7. Discusses possible implications and directions for future research.

There are many different types of literature reviews, including those that focus solely on methodology, those that are more conceptual, and those that are more exploratory. Regardless of the type of literature review or how many sources it contains, strong literature reviews have similar characteristics. Your literature review is, at its most fundamental level, an original work based on an extensive critical examination and synthesis of the relevant literature on a topic. As a study of the research on a particular topic, it is arranged by key themes or findings, which should lead up to or link to the research question.

A literature review is a mandatory part of any research project. It demonstrates that you can systematically explore the research in your topic area, read and analyze the literature on the topic, use it to inform your own work, and gather enough knowledge about the topic to conduct a research project. Literature reviews should be reasonably complete, and not restricted to a few journals, a few years, or a specific methodology or research design. A well-conducted literature review should indicate to you whether your initial research questions have already been addressed in the literature, whether there are newer or more interesting research questions available, and whether the original research questions should be modified or changed in light of findings of the literature review. The review can also provide some intuitions or potential answers to the questions of interest and/or help identify theories that have previously been used to address similar questions and may provide evidence to inform policy or decision-making (Bhattacherjee, 2012). Bhattacherjee, A., (2012). Social science research: Principles, methods, and practices. Textbooks Collection. 3. http://scholarcommons.usf.edu/oa_textbooks/3

Literature reviews are also beneficial to you as a researcher and scholar in social work. By reading what others have argued and found in their work, you become familiar with how people talk about and understand your topic. You will also refine your writing skills and your understanding of the topic you have chosen. The literature review also impacts the question you want to answer. As you learn more about your topic, you will clarify and redefine the research question guiding your inquiry. Literature reviews make sure you are not “reinventing the wheel” by repeating a study done so many times before or making an obvious error that others have encountered. The contribution your research study will have depends on what others have found before you. Try to place the study you wish to do in the context of previous research and ask, “Is this contributing something new?” and “Am I addressing a gap in knowledge or controversy in the literature?”

In summary, you should conduct a literature review to:

Common literature review errors

Literature reviews are more than a summary of the publications you find on a topic. As you have seen in this brief introduction, literature reviews are a very specific type of research, analysis, and writing. We will explore these topics more in the next chapters. As you begin your literature review, here are some common errors to avoid:

 For a quick review of some of the pitfalls and challenges a new researcher faces when she begins work, see “Get Ready: Academic Writing, General Pitfalls and (oh yes) Getting Started!”.


Key Takeaways

  • Literature reviews are the first step in any research project, as they help you learn about the topic you chose to study.
  • You must do more than summarize sources for a literature review. You must have something to say about them and demonstrate you understand their content.


Glossary

  • Literature review- a survey of factual or nonfiction books, articles, and other documents published on a particular subject


Image attributions

Book library by MVA CC-0


16

4.2 Synthesizing literature

Learning Objectives

  • Connect the sources you read with key concepts in your research question and proposal
  • Systematize the information and facts from each source you read

Putting the pieces together

Combining separate elements into a whole is the dictionary definition of synthesis. It is a way to make connections among and between numerous and varied source materials. A literature review is not an annotated bibliography, organized by title, author, or date of publication. Rather, it is grouped by topic and argument to create a whole view of the literature relevant to your research question.


puzzle pieces on a table, unassembled

Your synthesis must demonstrate a critical analysis of the papers you collected, as well as your ability to integrate the results of your analysis into your own literature review. Each source you collect should be critically evaluated and weighed based on the criteria from Chapter 3 before you include it in your review.

Begin the synthesis process by creating a grid, table, or an outline where you will summarize your literature review findings, using common themes you have identified and the sources you have found. The summary, grid, or outline will help you compare and contrast the themes, so you can see the relationships among them as well as areas where you may need to do more searching. A basic summary table is provided in Figure 4.2. Whichever method you choose, this type of organization will help you to both understand the information you find and structure the writing of your review. Remember, although “the means of summarizing can vary, the key at this point is to make sure you understand what you’ve found and how it relates to your topic and research question” (Bennard et al., 2014, para. 10). Bernnard, D., Bobish, G., Hecker, J., Holden, I., Hosier, A., Jacobson, T., Loney, T., & Bullis, D. (2014). Presenting: Sharing what you’ve learned. In Bobish, G., & Jacobson, T. (eds.) The information literacy users guide: An open online textbook. https://milnepublishing.geneseo.edu/the-information-literacy-users-guide-an-open-online-textbook/chapter/present-sharing-what-youve-learned/


table with research question on top, numbered sources in the rows and purpose, methods, and results in the columns
Figure 4.2 Summary table

Figure 4.2 copied from Frederiksen, L. & Phelps, S. F. (2018). Literature reviews for education and nursing graduate students. Shared under a CC-BY 4.0 license (https://creativecommons.org/licenses/by/4.0/).

As you read through the material you gather, look for common themes as they may provide the structure for your literature review. And, remember, research is an iterative process. It is not unusual to go back and search academic databases for more sources of information as you read the articles you’ve collected.

Literature reviews can be organized sequentially or by topic, theme, method, results, theory, or argument. It’s important to develop categories that are meaningful and relevant to your research question. Take detailed notes on each article and use a consistent format for capturing all the information each article provides. These notes and the summary table can be done manually using note cards. However, given the amount of information you will be recording, an electronic file created in a word processing or spreadsheet is more manageable. Examples of fields you may want to capture in your notes include:

Other fields that will be useful when you begin to synthesize the sum total of your research:

An example of how to organize summary tables by author or theme is shown in Table 4.1.


Table 4.1: Summary table
Author/Year Research Design Participants or Population Studied Comparison Outcome
Smith/2010 Mixed methods Undergraduates Graduates Improved access
King/2016 Survey Females Males Increased representation
Miller/2011 Content analysis Nurses Doctors New procedure

For a summary table template, see http://blogs.monm.edu/writingatmc/files/2013/04/Synthesis-Matrix-Template.pdf

Creating a topical outline

An alternative way to organize your articles for synthesis it to create an outline. After you have collected the articles you intend to use (and have put aside the ones you won’t be using), it’s time to extract as much as possible from the facts provided in those articles. You are starting your research project without a lot of hard facts on the topics you want to study, and by using the literature reviews provided in academic journal articles, you can gain a lot of knowledge about a topic in a short period of time.


a person writing down notes in a journal while seated

As you read an article in detail, I suggest copying the information you find relevant to your research topic in a separate word processing document. Copying and pasting from PDF to Word can be a pain because PDFs are image files not documents. To make that easier, use the HTML version of the article, convert the PDF to Word in Adobe Acrobat or another PDF reader, or use “paste special” command to paste the content into Word without formatting. If it’s an old PDF, you may have to simply type out the information you need. It can be a messy job, but having all of your facts in one place is very helpful for drafting your literature review.

You should copy and paste any fact or argument you consider important. Some good examples include definitions of concepts, statistics about the size of the social problem, and empirical evidence about the key variables in the research question, among countless others. It’s a good idea to consult with your professor and the syllabus for the course about what they are looking for when they read your literature review. Facts for your literature review are principally found in the introduction, results, and discussion section of an empirical article or at any point in a non-empirical article. Copy and paste into your notes anything you may want to use in your literature review.

Importantly, you must make sure you note the original source of that information. Nothing is worse than searching your articles for hours only to realize you forgot to note where your facts came from. If you found a statistic that the author used in the introduction, it almost certainly came from another source that the author cited in a footnote or internal citation. You will want to check the original source to make sure the author represented the information correctly. Moreover, you may want to read the original study to learn more about your topic and discover other sources relevant to your inquiry.

Assuming you have pulled all of the facts out of multiple articles, it’s time to start thinking about how these pieces of information relate to each other. Start grouping each fact into categories and subcategories as shown in Figure 4.3. For example, a statistic stating that homeless single adults are more likely to be male may fit into a category of gender and homelessness. For each topic or subtopic you identified during your critical analysis of each paper, determine what those papers have in common. Likewise, determine which ones in the group differ. If there are contradictory findings, you may be able to identify methodological or theoretical differences that could account for the contradiction. For example, one study may sample only high-income earners or those in a rural area. Determine what general conclusions you can report about the topic or subtopic, based on all of the information you’ve found.

Create a separate document containing a topical outline that combines your facts from each source and organizes them by topic or category. As you include more facts and more sources into your topical outline, you will begin to see how each fact fits into a category and how categories are related to each other. Your category names may change over time, as may their definitions. This is a natural reflection of the learning you are doing.


Table 4.2 Topical outlineThis table was adapted from the work of Amanda Parsons. For more of Amanda's work see the exemplars for assignments linked in the front matter of this textbook.
Facts copied from an article Topical outline: Facts organized by category
  • Accumulating evidence indicates that adolescents who have same-sex sexual attractions, who have had sexual or romantic relationships with persons of the same sex, or who identify as lesbian, gay, or bisexual are more likely than heterosexual adolescents to experience depressive symptoms, suicidal ideation, and to make suicide attempts (Remafedi et al. 1998; Russell and Joyner 2001; Safren and Heimberg 1999).
  • Youth Risk Behavior Surveillance (YRBS) system showed that 40% of youth who reported a minority sexual orientation indicated feeling sad or hopeless in the past 2 weeks, compared to 26% of heterosexual youth (District of Columbia Public Schools, 2007). Those data also showed that lesbian, gay, and bisexual youth were more than twice as likely as heterosexual youth to have considered attempting suicide in the past year (31% vs. 14%). This body of research demonstrates that lesbian, gay, and bisexual youth have high levels of emotional distress.
  • A much smaller body of research suggests that adolescents who identify as transgendered or transsexual also experience increased emotional distress (Di Ceglie et al. 2002; Grossman and D’Augelli 2006, 2007).
  • In a study based on a convenience sample of 55 transgendered youth aged to 15–21 years, the authors found that more than one fourth reported a prior suicide attempt (Grossman and D’Augelli 2007).
  • LGB adolescents and suicide
    • Accumulating evidence indicates that adolescents who have same-sex sexual attractions, who have had sexual or romantic relationships with persons of the same sex, or who identify as lesbian, gay, or bisexual are more likely than heterosexual adolescents to experience depressive symptoms, suicidal ideation, and to make suicide attempts (Remafedi et al. 1998; Russell and Joyner 2001; Safren and Heimberg 1999).
  • LGB adolescents and emotional distress
    • Youth Risk Behavior Surveillance (YRBS) system showed that 40% of youth who reported a minority sexual orientation indicated feeling sad or hopeless in the past 2 weeks, compared to 26% of heterosexual youth (District of Columbia Public Schools, 2007). Those data also showed that lesbian, gay, and bisexual youth were more than twice as likely as heterosexual youth to have considered attempting suicide in the past year (31% vs. 14%). This body of research demonstrates that lesbian, gay, and bisexual youth have high levels of emotional distress.
  • Transgender adolescents and emotional distress
    • A much smaller body of research suggests that adolescents who identify as transgendered or transsexual also experience increased emotional distress (Di Ceglie et al. 2002; Grossman and D’Augelli 2006, 2007).
    • In a study based on a convenience sample of 55 transgendered youth aged to 15–21 years, the authors found that more than one fourth reported a prior suicide attempt (Grossman and D’Augelli 2007).

A complete topical outline is a long list of facts, arranged by category about your topic. As you step back from the outline, you should understand the topic areas where you have enough information to make strong conclusions about what the literature says. You should also assess in what areas you need to do more research before you can write a robust literature review. The topical outline should serve as a transitional document between the notes you write on each source and the literature review you submit to your professor. It is important to note that they contain plagiarized information that is copied and pasted directly from the primary sources. That’s okay because these are just notes and are not meant to be turned in as your own ideas. For your final literature review, you must paraphrase these sources to avoid plagiarism. More importantly, you should keep your voice and ideas front-and-center in what you write as this is your analysis of the literature. Make strong claims and support them thoroughly using facts you found in the literature. We will pick up the task of writing your literature review in section 4.3.

Additional resources for synthesizing literature

There are many ways to approach synthesizing literature. We’ve reviewed two examples here: summary tables and topical outlines. Other examples you may encounter include annotated bibliographies and synthesis matrixes. As you are learning research, find a method that works for you. Reviewing the literature is a core component of evidence-based practice in social work at any level. See the resources below if you need some additional help:

Literature Reviews: Using a Matrix to Organize Research / Saint Mary’s University of Minnesota

Literature Review: Synthesizing Multiple Sources / Indiana University

Writing a Literature Review and Using a Synthesis Matrix / Florida International University

Sample Literature Reviews Grid / Complied by Lindsay Roberts

Killam, Laura (2013). Literature review preparation: Creating a summary table. Includes transcript. https://www.youtube.com/watch?v=nX2R9FzYhT0


Key Takeaways

  • It is necessary to take notes on research articles as you read. Try to develop a system that works for you to keep your notes organized, such as a summary table.
  • Summary tables and topical outlines help researchers synthesize sources for the purpose of writing a literature review.


Image attributions

Pieces of the puzzle by congerdesign CC-0

Adult diary by Pexels CC-0


17

4.3 Writing the literature review

Learning Objectives

  • Begin to write your literature review
  • Identify the purpose of a problem statement
  • Apply the components of a formal argument to your topic
  • Use elements of formal writing style, including signposting and transitions


Congratulations! By now, you should have discovered, retrieved, evaluated, synthesized, and organized the information you need for your literature review. It’s now time to turn that stack of articles, papers, and notes into a literature review–it’s time to start writing!


a person typing on a laptop with a magazine open on the side

If you’ve followed the steps in this chapter, you likely have an outline from which you can begin the writing process. But what do you need to include in your literature review? We’ve mentioned it before here, but just to summarize, a literature review should:

…clearly describe the questions that are being asked. They also locate the research within the ongoing scholarly dialogue. This is done by summarizing current understandings and by discussing why what we already knows leads to the need for the present research. Literature reviews also define the primary concepts. While this information can appear in any order, these are the elements in all literature reviews. (Loseke, 2017, p. 61) Loseke, D. (2017). Methodological thinking: Basic principles of social research design (2nd ed.). Los Angeles, CA: Sage.

Do you have enough facts and sources to accomplish these tasks? It’s a good time to consult your outlines and notes on each article you plan to include in your literature review. You may also want to consult with your professor on what they expect from you. If there is something that you are missing, you may want to jump back to section 2.3 where we discussed how to search for literature on your topic. While you can always fill in material later, there is always the danger that you will start writing without really knowing what you are talking about or what you want to say. For example, if you don’t have a solid definition of your key concepts or a sense of how the literature has developed over time, it will be difficult to make coherent scholarly claims about your topic.

There is no magical point at which everyone is ready to write. As you consider whether you are ready or not, it may be useful to ask yourself these questions:

The problem statement

Many scholarly works begin with a problem statement. The problem statement serves two functions. On one hand, it establishes why your topic is a social problem worth studying. At the same time, it also pulls your reader into the literature review. Who would want to read about something unimportant?


solution and problem written on a chalkboard with lines going to and from each other

A problem statement generally answers the following questions, though these are far from exhaustive:

A strong problem statement, like the rest of your literature review, should be filled with facts, theory, and arguments based on the literature you’ve found. A research proposal differs significantly from other more reflective essays you’ve likely completed during your social work studies. If your topic were domestic violence in rural Appalachia in the USA, I’m sure you could come up with answers to the above questions without looking at a single source. However, the purpose of the literature review is not to test your intuition, personal experience, or empathy. Instead, research methods are about learning specific and articulable facts to inform social work action. With a problem statement, you can take a “boring” topic like the color of rooms used in an inpatient psychiatric facility, transportation patterns in major cities, or the materials used to manufacture baby bottles and help others see the topic as you see it—an important part of the social world that impacts social work practice.

The structure of a literature review

The problem statement generally belongs at the beginning of the literature review. Take care not to go on for too long. I usually advise my students to spend no more than a paragraph or two for a problem statement. For the rest of your literature review, there is no set formula for how it should be organized. However, a literature review generally follows the format of any other essay—Introduction, Body, and Conclusion.

The introduction to the literature review contains a statement or statements about the overall topic. At minimum, the introduction should define or identify the general topic, issue, or area of concern. You might consider presenting historical background, mention the results of a seminal study, and provide definitions of important terms. The introduction may also point to overall trends in what has been previously published on the topic or conflicts in theory, methodology, evidence, conclusions, or gaps in research and scholarship. I also suggest putting in a few sentences that walk the reader through the rest of the literature review. Highlight your main arguments from the body of the literature review and preview your conclusion. An introduction should let someone know what to expect from the rest of your review.


a person typing at a typewriter

The body of your literature review is where you demonstrate your synthesis and analysis of the literature on your topic. Again, take care not to just summarize your literature. I would also caution against organizing your literature review by source—that is, one paragraph for source A, one paragraph for source B, etc. That structure will likely provide an okay summary of the literature you’ve found, but it would give you almost no synthesis of the literature. That approach doesn’t tell your reader how to put those facts together, points of agreement or contention in the literature, or how each study builds on the work of others. In short, it does not demonstrate critical thinking.

Instead, use your outlines and notes as a guide to the important topics you need to cover, and more importantly, what you have to say about those topics. Literature reviews are written from the perspective of an expert on the field. After an exhaustive literature review, you should feel like you are able to make strong claims about what is true—so make them! There is no need to hide behind “I believe” or “I think.” Put your voice out in front, loud and proud! But make sure you have facts and sources that back up your claims.

I’ve used the term “argument” here in a specific way. An argument in writing means more than simply disagreeing with what someone else said. Toulman, Rieke, and Janik (1984) identify six elements of an argument:

  1. Claim: the thesis statement—what you are trying to prove
  2. Grounds: theoretical or empirical evidence that supports your claim
  3. Warrant: your reasoning (rule or principle) connecting the claim and its grounds
  4. Backing: further facts used to support or legitimize the warrant
  5. Qualifier: acknowledging that the argument may not be true for all cases
  6. Rebuttal: considering both sides (as cited in Burnette, 2012) Burnett, D. (2012). Inscribing knowledge: Writing research in social work. In W. Green & B. L. Simon (Eds.), The Columbia guide to social work writing (pp. 65-82). New York, NY: Columbia University Press.

Let’s walk through an example of an argument. If I were writing a literature review on a negative income tax, a policy in which people in poverty receive an unconditional cash stipend from the government each month equal to the federal poverty level. I would want to lay out the following:

  1. Claim: the negative income tax is superior to other forms of anti-poverty assistance.
  2. Grounds: data comparing negative income tax recipients to those in existing programs, theory supporting a negative income tax, data from evaluations of existing anti-poverty programs, etc.
  3. Warrant: cash-based programs like the negative income tax are superior to existing anti-poverty programs because they allow the recipient greater self-determination over how to spend their money.
  4. Backing: data demonstrating the beneficial effects of self-determination on people in poverty.
  5. Qualifier: the negative income tax does not provide taxpayers and voters with enough control to make sure people in poverty are not wasting financial assistance on frivolous items.
  6. Rebuttal: policy should be about empowering the oppressed, not protecting the taxpayer, and there are ways of addressing taxpayer opposition through policy design.

Like any effective argument, your literature review must have some kind of structure. For example, it might begin by describing a phenomenon in a general way along with several studies that provide some detail, then describing two or more competing theories of the phenomenon, and finally presenting a hypothesis to test one or more of the theories. Or, it might describe one phenomenon, then describe another phenomenon that seems inconsistent with the first one, then propose a theory that resolves the inconsistency, and finally present a hypothesis to test that theory. In applied research, it might describe a phenomenon or theory, then describe how that phenomenon or theory applies to some important real-world situation, and finally suggest a way to test whether it does, in fact, apply to that situation.

Another important issue is signposting. It may not be a term you are familiar with, but you are likely familiar with the concept. Signposting refers to the words used to identify the organization and structure of your literature review to your reader.  The most basic form of signposting is using a topic sentence at the beginning of each paragraph. A topic sentence introduces the argument you plan to make in that paragraph. For example, you might start a paragraph stating, “There is strong disagreement in the literature as to whether psychedelic drugs cause psychotic disorders, or whether people with psychotic disorders cause people to use psychedelic drugs.” Within that paragraph, your reader would likely assume you will present evidence for both arguments. The concluding sentence of your paragraph should address the topic sentence, addressing how the facts and arguments from other authors support a specific conclusion. To continue with our example, I might say, “There is likely a reciprocal effect in which both the use of psychedelic drugs worsens pre-psychotic symptoms and worsening psychosis causes use of psychedelic drugs to self-medicate or escape.”


signpost listing distances to various cities

Signposting also involves using headings and subheadings. Your literature review will use APA formatting, which means you need to follow their rules for bolding, capitalization, italicization, and indentation of headings. Headings help your reader understand the structure of your literature review. They can also help if the reader gets lost and needs to re-orient themselves within the document. I often tell my students to assume I know nothing (they don’t mind) and need to be shown exactly where they are addressing each part of the literature review. It’s like walking a small child around, telling them “First we’ll do this, then we’ll do that, and when we’re done, we’ll know this!”

Another way to use signposting is to open each paragraph with a sentence that links the topic of the paragraph with the one before it. Alternatively, one could end each paragraph with a sentence that links it with the next paragraph. For example, imagine we wanted to link a paragraph about barriers to accessing healthcare with one about the relationship between the patient and physician. We could use a transition sentence like this: “Even if patients overcome these barriers to accessing care, the physician-patient relationship can create new barriers to positive health outcomes.” A transition sentence like this builds a connection between two distinct topics. Transition sentences are also useful within paragraphs. They tell the reader how to consider one piece of information in light of previous information. Even simple transitions like however, similarly, and others demonstrate critical thinking and make your arguments clearer.

Many beginning researchers have difficulty with incorporating transitions into their writing. Let’s look at an example. Instead of beginning a sentence or paragraph by launching into a description of a study, such as “Williams (2004) found that…,” it is better to start by indicating something about why you are describing this particular study. Here are some simple examples:

Now that we know to use signposts, the natural question is “What goes on the signposts?” First, it is extremely important to start with an outline of the main points that you want to make, organized in the order that you want to make them. The basic structure of your argument then should be apparent from the outline itself. Unfortunately, there is no formula I can give you that will work for everyone. I can provide some general pointers on structuring your literature review, though.

The literature review generally moves from general ideas to more specific ones. You can build a review by identifying areas of consensus and areas of disagreement. You may choose to present earlier, historical studies—preferably seminal studies that are of significant importance—and close with most recent work. Another approach is to start with the most distantly related facts and literature and then report on those most closely related to your specific research question. You could also compare and contrast valid approaches, features, characteristics, theories – that is, one approach, then a second approach, followed by a third approach.

Here are some additional tips for writing the body of your literature review:

The conclusion should summarize your literature review, discuss implications, and create a space for future or further research needed in this area. Your conclusion, like the rest of your literature review, should have a point that you are trying to make. What are the important implications of your literature review? How do they inform the question you are trying to answer?

While you should consult with your professor and their syllabus for the final structure your literature review should take, here is an example of the possible structure for a literature review:

Here are some additional resources, if you are having trouble putting together your literature review:

Doing a literature review / University of Leicester

Get Lit: The Literature Review / Texas A&M Writing Centre

Editing your literature review

For your literature review, remember that your goal is to construct an argument for why your research question is interesting and worth addressing—not necessarily why your favorite answer to it is correct. As you start editing your literature review, make sure that it is balanced. If you want to emphasize the generally accepted understanding of a phenomenon, then of course you should discuss various studies that have demonstrated it. However, if there are other studies that have found contradictory findings, you should discuss them, too. Or, if you are proposing a new theory, then you should discuss findings that are consistent with that theory. However, if there are other findings that are inconsistent with it, again, you should discuss them too. It is acceptable to argue that the balance of the research supports the existence of a phenomenon or is consistent with a theory (and that is usually the best that researchers in social work can hope for), but it is not acceptable to ignore contradictory evidence. Besides, a large part of what makes a research question interesting is uncertainty about its answer (University of Minnesota, 2016). University of Minnesota Libraries Publishing. (2016). This is a derivative of Research Methods in Psychology by a publisher who has requested that they and the original author not receive attribution, which was originally released and is used under CC BY-NC-SA. This work, unless otherwise expressly stated, is licensed under a Creative Commons Attribution-NonCommercial-ShareAlike 4.0 International License.


a typewritten paper with corrections in red ink written on it

In addition to subjectivity and bias, another obstruction to getting your literature review written is writer’s block. Often times, writer’s block can come from confusing the creating and editing parts of the writing process. Many writers often start by simply trying to type out what they want to say, regardless of how good it is. Author Anne Lamott (1995) Lamott, A. (1995). Bird by bird: Some instructions on writing and life. New York, NY: Penguin. terms these “shitty first drafts” and we all write them. They are a natural and important part of the writing process. Even if you have a detailed outline to work from, the words are not going to fall into place perfectly the first time you start writing. You should consider turning off the editing and critiquing part of your brain for a little while and allow your thoughts to flow. Don’t worry about putting the correct internal citation when you first write. Just get the information out. Only after you’ve reached a natural stopping point might you go back and edit your draft for grammar, APA formatting, organization, flow, and more. Divorcing the writing and editing process can go a long way to addressing writer’s block—as can picking a topic about which you have something to say!

As you are editing, keep in mind these questions adapted from Green (2012): Green, W. Writing strategies for academic papers. In W. Green & B. L. Simon (Eds.), The Columbia guide to social work writing (pp. 25-47). New York, NY: Columbia University Press.


Key Takeaways

  • The problem statement draws the reader into your topic by highlighting how important the topic is to social work and overall society.
  • Signposting is an important component of academic writing that helps your reader follow the structure of your argument and literature review.
  • Transitions demonstrate critical thinking and help guide your reader through your arguments.
  • Editing and writing are separate processes.


Glossary

  • Signposting- words that identify the organization and structure of a literature review


Image attributions

Startup notebooks by StartupStockPhotos CC-0

Board front problem by geralt CC-0

Person holding white paper and typewriter by Pexels CC-0

Signs direction Bergen by Mariamichelle CC-0

Mistakes by annekarakash CC-0


V

5. Ethics in social work research

18

5.0 Chapter introduction

Would it surprise you learn that scientists who conduct research may withhold effective treatments from individuals with diseases? Perhaps it wouldn’t surprise you, since you may have heard of the Tuskegee Syphilis Experiment, in which treatments for syphilis were knowingly withheld from African-American participants for decades. Would it surprise you to learn that the practice of withholding treatment continues today? Multiple studies in the developing world continue to use placebo control groups in testing for cancer screenings, cancer treatments, and HIV treatments (Joffe & Miller, 2014). Joffe, S., & Miller, F. G. (2014). Ethics of cancer clinical trials in low-resource settings. Journal of Clinical Oncology, 32(28), 3192-3196. What standards would you use to judge withholding treatment as ethical or unethical? Most importantly, how can you make sure that your study respects the human rights of your participants?

Chapter Outline

Content Advisory

This chapter discusses or mentions the following topics: unethical research that has occurred in the past against marginalized groups in America and during the Holocaust.

19

5.1 Research on humans

Learning Objectives

  • Define human subjects research
  • Describe and provide examples of nonhuman subjects that researchers might examine
  • Define institutional review boards and describe their purpose
  • Distinguish between the different levels of review conducted by institutional review boards


In 1998, actor Jim Carey starred in the movie The Truman ShowYou can read a brief synopsis of the film at http://www.imdb.com/title/tt0120382. At first glance, the film appears to depict a perfect research experiment. Just imagine the possibilities if we could control every aspect of a person’s life, from how and where that person lives to where they work to whom they marry. Of course, keeping someone in a bubble, controlling every aspect of their life, and sitting back and watching would be highly unethical (not to mention illegal). However, the movie clearly inspires thoughts about the differences between scientific research and research on nonhumans. One of the most exciting—and most challenging—aspects of conducting social work research is the fact that (at least much of the time) our subjects are living human beings whose free will and human rights will always have an impact on what we are able to research and how we are able to conduct that research.

Human research versus nonhuman research

While all research comes with its own set of ethical concerns, those associated with research conducted on human subjects vary dramatically from those of research conducted on nonliving entities. The US Department of Health and Human Services (USDHHS) defines a human subject as “a living individual about whom an investigator (whether professional or student) conducting research obtains (1) data through intervention or interaction with the individual, or (2) identifiable private information” (USDHHS, 1993, para. 1). US Department of Health and Human Services. (1993). Institutional review board guidebook glossary. Retrieved from https://ori.hhs.gov/education/products/ucla/chapter2/page00b.htm Some researchers prefer the term participants to subjects, as it acknowledges the agency of people who participate in the study. For our purposes, we will use the two terms interchangeably.

In some states, human subjects also include deceased individuals and human fetal materials. Nonhuman research subjects, on the other hand, are objects or entities that investigators manipulate or analyze in the process of conducting research. Nonhuman research subjects typically include sources such as newspapers, historical documents, clinical notes, television shows, buildings, and even garbage (to name just a few) that are analyzed for unobtrusive research projects. Unsurprisingly, research on human subjects is regulated much more heavily than research on nonhuman subjects. However, there are ethical considerations that all researchers must consider regardless of their research subject. We’ll discuss those considerations in addition to concerns that are unique to research on human subjects.


road sign with two arrows pointing towards right and wrong

A historical look at research on humans

Research on humans hasn’t always been regulated in the way that it is today. The earliest documented cases of research using human subjects are of medical vaccination trials (Rothman, 1987). Rothman, D. J. (1987). Ethics and human experimentation. The New England Journal of Medicine, 317, 1195–1199. One such case took place   in the late 1700s, when scientist Edward Jenner exposed an 8-year-old boy to smallpox in order to identify a vaccine for the devastating disease. Medical research on human subjects continued without much law or policy intervention until the mid-1900s when, at the end of World War II, a number of Nazi doctors and scientists were put on trial for conducting human experimentation during the course of which they tortured and murdered many concentration camp inmates (Faden & Beauchamp, 1986). One little-known fact, as described by Faden and Beauchamp in their 1986 book, is that at the very time that the Nazis conducted their horrendous experiments, Germany did actually have written regulations specifying that human subjects must clearly and willingly consent to their participation in medical research. Obviously these regulations were completely disregarded by the Nazi experimenters, but the fact that they existed suggests that   efforts to regulate the ethical conduct of research, while necessary, are certainly not sufficient for ensuring that human subjects’ rights will be honored. Faden, R. R., & Beauchamp, T. L. (1986). A history and theory of informed consent. Oxford, UK: Oxford University Press. The trials, conducted in Nuremberg, Germany, resulted in the creation of the Nuremberg Code, a 10-point set of research principles designed to guide doctors and scientists who conduct research on human subjects. Today, the Nuremberg Code guides medical and other research conducted on human subjects, including social scientific research.

Medical scientists are not the only researchers who have conducted questionable research on humans. In the 1960s, psychologist Stanley Milgram (1974) Milgram, S. (1974). Obedience to authority: An experimental view. New York, NY: Harper & Row. conducted a series of experiments designed to understand obedience to authority in which he tricked subjects into believing they were administering an electric shock to other subjects. In fact, the shocks weren’t real at all, but some, though not many, of Milgram’s research participants experienced extreme emotional distress after the experiment (Ogden, 2008). Ogden, R. (2008). Harm. In L. M. Given (Ed.), The sage encyclopedia of qualitative research methods (p. 379–380). Los Angeles, CA: Sage. A reaction of emotional distress is understandable. The realization that one is willing to administer painful shocks to another human being just because someone who looks authoritative has told you to do so might indeed be traumatizing—even if you later learn that the shocks weren’t real.

Around the same time that Milgram conducted his experiments, sociology graduate student Laud Humphreys (1970) Humphreys, L. (1970). Tearoom trade: Impersonal sex in public places. London, UK: Duckworth. was collecting data for his dissertation research on the tearoom trade, which was the practice of men engaging in anonymous sexual encounters in public restrooms. Humphreys wished to understand who these men were and why they participated in the trade. To conduct his research, Humphreys offered to serve as a “watch queen,” who is the person who keeps an eye out for police and gets the benefit of being able to watch the sexual encounters, in a local park restroom where the tearoom trade was known to occur. What Humphreys did not do was identify himself as a researcher to his research subjects. Instead, he watched his subjects for several months, getting to know several of them, learning more about the tearoom trade practice and, without the knowledge of his research subjects, jotting down their license plate numbers as they pulled into or out of the parking lot near the restroom.

Sometime after participating as a watch queen, with the help of several insiders who had access to motor vehicle registration information, Humphreys used those license plate numbers to obtain the names and home addresses of his research subjects. Then, disguised as a public health researcher, Humphreys visited his subjects in their homes and interviewed them about their lives and their health. Humphreys’ research dispelled a good number of myths and stereotypes about the tearoom trade and its participants. He learned, for example, that over half of his subjects were married to women and many of them did not identify as gay or bisexual. Humphreys’s research is still relevant today. In fact, as the 2007 arrest of Idaho Senator Larry Craig in a public restroom at the Minneapolis–St. Paul airport attests, undercover police operations targeting tearoom activities still occur, more than 40 years after Humphreys conducted his research. Humphreys’s research is also frequently cited by attorneys who represent clients arrested for lewd behavior in public restrooms.

Once Humphreys’ work became public, the result was some major controversy at his home university (e.g., the chancellor tried to have his degree revoked), among scientists in general, and among members of the public, as it raised public concerns about the purpose and conduct of social science research. In addition, the Washington Post journalist Nicholas von Hoffman wrote the following warning about “sociological snoopers”:

We’re so preoccupied with defending our privacy against insurance investigators, dope sleuths, counterespionage men, divorce detectives and credit checkers, that we overlook the social scientists behind the hunting blinds who’re also peeping into what we thought were our most private and secret lives. But they are there, studying us, taking notes, getting to know us, as indifferent as everybody else to the feeling that to be a complete human involves having an aspect of ourselves that’s unknown (von Hoffman, 1970). von Hoffman, N. (1970, January 30). Sociological snoopers. The Washington Post, p. B1.

In the original version of his report, Humphreys defended the ethics of his actions. In 2008, years after Humphreys’ death, his book was reprinted with the addition of a retrospect on the ethical implications of his work. [10] In his written reflections on his research and the fallout from it, Humphreys maintained that his tearoom observations constituted ethical research on the grounds that those interactions occurred in public places. But Humphreys added that he would conduct the second part of his research differently. Rather than trace license numbers and interview unwitting tearoom participants in their homes under the guise of public health research, Humphreys instead would spend more time in the field and work to cultivate a pool of informants. Those informants would know that he was a researcher and would be able to fully consent to being interviewed. In the end, Humphreys concluded “there is no reason to believe that any research subjects have suffered because of my efforts, or that the resultant demystification of impersonal sex has harmed society” (Humphreys, 2008, p. 231). Humphreys, L. (2008). Tearoom trade: Impersonal sex in public places, enlarged edition with a retrospect on ethical issues. New Brunswick, NJ: Aldine Transaction.

Today, given increasing regulation of social scientific research, chances are slim that a researcher would be allowed to conduct a project similar to Humphreys’. Some argue that Humphreys’ research was deceptive, put his subjects at risk of losing their families and their positions in society, and was therefore unethical (Warwick, 1973; Warwick, 1982). Warwick, D. P. (1973). Tearoom trade: Means and ends in social research. Hastings Center Studies, 1, 39–49. See also Warwick, D. P. (1982). Types of harm in social research. In T. L. Beauchamp, R. R. Faden, R. J. Wallace Jr., & L. Walters (Eds.), Ethical issues in social science research. Baltimore, MD: Johns Hopkins University Press. Others suggest that Humphreys’ research “did not violate any premise of either beneficence or the sociological interest in social justice” and that the benefits of Humphreys’ research, namely the dissolution of myths about the tearoom trade specifically and human sexual practice more generally, outweigh the potential risks associated with the work (Lenza, 2004, p. 23). Lenza, M. (2004). Controversies surrounding Laud Humphreys’ tearoom trade: An unsettling example of politics and power in methodological critiques. International Journal of Sociology and Social Policy, 24, 20–31. See also Nardi, P. M. (1995). “The breastplate of righteousness”: Twenty- five years after Laud Humphreys’ Tearoom trade: Impersonal sex in public places. Journal of Homosexuality, 30, 1–10. What do you think, and why?

These and other studies (Reverby, 2009) One such study is the Tuskegee Syphilis Experiment, conducted in Alabama from the 1930s to the 1970s. The goal of the study was to understand the natural progression of syphilis in human beings. Investigators working for the Public Health Service enrolled hundreds of poor African American men in the study, some of whom had been diagnosed with syphilis and others who had not. Even after effective syphilis treatment was identified in the 1940s, research participants were denied treatment so that researchers could continue to observe the progression of the disease. The study came to an end in 1972 after knowledge of the experiment became public. In 1997, President Clinton publicly apologized on behalf of the American people for the study (http://clinton4.nara.gov/textonly/New/Remarks/Fri/19970516-898.html). For more on the Tuskegee Syphilis Experiment, see Reverby, S. M. (2009). Examining Tuskegee: The infamous syphilis study and its legacy. Chapel Hill, NC: University of North Carolina Press.  led to increasing public awareness of and concern about research on human subjects. In 1974, the US Congress enacted the National Research Act, which created the National Commission for the Protection of Human Subjects in Biomedical and Behavioral Research. The commission produced The Belmont Report, a document outlining basic ethical principles for research on human subjects (National Commission for the Protection of Human Subjects in Biomedical and Behavioral Research, 1979).  National Commission for the Protection of Human Subjects in Biomedical and Behavioral Research. (1979). The Belmont report: Ethical principles and guidelines for the protection of human subjects of research. Retrieved from https://www.hhs.gov/ohrp/regulations-and-policy/belmont-report/index.html The National Research Act (1974) National Research Act of 1974, Pub. L. no. 93-348 Stat 88. (1974). The act can be read at https://history.nih.gov/research/downloads/PL93-348.pdf also required that all institutions receiving federal support establish institutional review boards (IRBs) to protect the rights of human research subjects. Since that time, many organizations that do not receive federal support but where research is conducted have also established review boards to evaluate the ethics of the research that they conduct.


seven people sitting around a table talking and taking notes

Institutional Review Boards (IRBs)

 Institutional Review Boards, or IRBs, are tasked with ensuring that the rights and welfare of human research subjects will be protected at all institutions, including universities, hospitals, nonprofit research institutions, and other organizations, that receive federal support for research. IRBs typically consist of members from a variety of disciplines, such as sociology, economics, education, social work, and communications (to name a few). Most IRBs also include representatives from the community in which they reside. For example, representatives from nearby prisons, hospitals, or treatment centers might sit on the IRBs of university campuses near them. The diversity of membership helps to ensure that the many and complex ethical issues that may arise from human subjects research will be considered fully and by a knowledgeable and experienced panel. Investigators conducting research on human subjects are required to submit proposals outlining their research plans to IRBs for review and approval prior to beginning their research. Even students who conduct research on human subjects must have their proposed work reviewed and approved by the IRB before beginning any research (though, on some campuses, some exceptions are made for classroom projects that will not be shared outside of the classroom).

The IRB has three levels of review, defined in statute by the USDHHS. Exempt review is the lowest level of review. Studies that are considered exempt expose participants to the least potential for harm and often involves little participation by human subjects. In social work, exempt studies often examine data that is publicly available or secondary data from another researcher that has been de-identified by the person who collected it. Expedited review is the middle level of review. Studies considered under expedited review do not have to go before the full IRB board because they expose participants to minimal risk. However, the studies must be thoroughly reviewed by a member of the IRB committee.  While there are many types of studies that qualify for expedited review, the most relevant to social workers include the use of existing medical records, recordings (such as interviews) gathered for research purposes, and research on individual group characteristics or behavior. Finally, the highest level of review is called a full board review. A full board review will involve multiple members of the IRB evaluating your proposal. When researchers submit a proposal under full board review, the full IRB board will meet, discuss any questions or concerns with the study, invite the researcher to answer questions and defend their proposal, and vote to approve the study or send it back for revision. Full board proposals pose greater than minimal risk to participants. They may also involve the participation of vulnerable populations, or people who need additional protection from the IRB. Vulnerable populations include pregnant women, prisoners, children, people with cognitive impairments, people with physical disabilities, employees, and students. While some of these populations can fall under expedited review in some cases, they will often require the full IRB to approve their study.

It may surprise you to hear that IRBs are not always popular or appreciated by researchers. Who wouldn’t want to conduct ethical research, you ask? In some cases, the concern is that IRBs are most well-versed in reviewing biomedical and experimental research, neither of which is particularly common within social work. Much social work research, especially qualitative research, is open ended in nature, a fact that can be problematic for IRBs. The members of IRBs often want to know in advance exactly who will be observed, where, when, and for how long, whether and how they will be approached, exactly what questions they will be asked, and what predictions the researcher has for her findings. Providing this level of detail for a year-long participant observation within an activist group of 200-plus members, for example, would be extraordinarily frustrating for the researcher in the best case and most likely would prove to be impossible. Of course, IRBs do not intend to have researchers avoid studying controversial topics or avoid using certain methodologically sound data collection techniques, but unfortunately, that is sometimes the result. The solution is not to do away with review boards, which serve a necessary and important function, but instead to help educate IRB members about the variety of social scientific research methods and topics covered by social workers and other social scientists.


Key Takeaways

  • Research on human subjects presents a unique set of challenges and opportunities when it comes to conducting ethical research.
  • Research on human subjects has not always been regulated to the extent that it is today.
  • All institutions receiving federal support for research must have an IRB. Organizations that do not receive federal support but where research is conducted also often include IRBs as part of their organizational structure.
  • Researchers submit studies for IRB review at one of three different levels, depending on the level of harm the study may cause.


Glossary

  • Exempt review- lowest level of IRB review, for studies for studies with minimal risk or human subject involvement
  • Expedited review- middle level of IRB review, for studies with minimal risk but greater human subject involvement
  • Full board review- highest level of IRB, for studies with greater than minimal risk to participants
  • Vulnerable populations- groups of people who receive additional protection during IRB review


Image attributions

ethics by Tumisu CC-0

roundtable meeting by Debora Cartagena CC-0


20

5.2 Specific ethical issues to consider

Learning Objectives

  • Define informed consent, and describe how it works
  • Identify the unique concerns related to the study of vulnerable populations
  • Differentiate between anonymity and confidentiality
  • Explain the ethical responsibilities of social workers conducting research


As should be clear by now, conducting research on humans presents a number of unique ethical considerations. Human research subjects must be given the opportunity to consent to their participation in research, fully informed of the study’s risks, benefits, and purpose. Further, subjects’ identities and the information they share should be protected by researchers. Of course, how consent and identity protection are defined may vary by individual researcher, institution, or academic discipline. In section 5.1, we examined the role that institutions play in shaping research ethics. In this section, we’ll take a look at a few specific topics that individual researchers and social workers in general must consider before embarking on research with human subjects.

Informed consent

 A norm of voluntary participation is presumed in all social work research projects. In other words, we cannot force anyone to participate in our research without that person’s knowledge or consent (so much for that Truman Show experiment). Researchers must therefore design procedures to obtain subjects’ informed consent to participate in their research. Informed consent is defined as a subject’s voluntary agreement to participate in research based on a full understanding of the research and of the possible risks and benefits involved. Although it sounds simple, ensuring that one has actually obtained informed consent is a much more complex process than you might initially presume.


a paper has a checkbox that says "I agree" with a pen over it

The first requirement is that, in giving their informed consent, subjects may neither waive nor even appear to waive any of their legal rights. Subjects also cannot release a researcher, her sponsor, or institution from any legal liability should something go wrong during the course of their participation in the research (USDHHS,2009). US Department of Health and Human Services. (2009). Code of federal regulations (45 CFR 46). The full set of requirements for informed consent can be read at https://www.hhs.gov/ohrp/regulations-and-policy/regulations/45-cfr-46/index.html Because social work research does not typically involve asking subjects to place themselves at risk of physical harm by, for example, taking untested drugs or consenting to new medical procedures, social work researchers do not often worry about potential liability associated with their research projects. However, their research may involve other types of risks.

For example, what if a social work researcher fails to sufficiently conceal the identity of a subject who admits to participating in a local swinger’s club? In this case, a violation of confidentiality may negatively affect the participant’s social standing, marriage, custody rights, or employment. Social work research may also involve asking about intimately personal topics, such as trauma or suicide that may be difficult for participants to discuss. Participants may re-experience traumatic events and symptoms when they participate in your study. Even if you are careful to fully inform your participants of all risks before they consent to the research process, I’m sure you can empathize with thinking you could bear talking about a difficult topic and then finding it too overwhelming once you start. In cases like these, it is important for a social work researcher to have a plan to provide supports. This may mean providing referrals to counseling supports in the community or even calling the police if the participants is an imminent danger to themselves or others.

It is vital that social work researchers explain their mandatory reporting duties in the consent form and ensure participants understand them before they participate. Researchers should also emphasize to participants that they can stop the research process at any time or decide to withdraw from the research study for any reason. Importantly, it is not the job of the social work researcher to act as a clinician to the participant. While a supportive role is certainly appropriate for someone experiencing a mental health crisis, social workers must ethically avoid dual roles. Referring a participant in crisis to other mental health professionals who may be better able to help them is preferred.

Beyond the legal issues, most IRBs require researchers to share some details about the purpose of the research, possible benefits of participation, and, most importantly, possible risks associated with participating in that research with their subjects. In addition, researchers must describe how they will protect subjects’ identities, how, where, and for how long any data collected will be stored, and whom to contact for additional information about the study or about subjects’ rights. All this information is typically shared in an informed consent form that researchers provide to subjects. In some cases, subjects are asked to sign the consent form indicating that they have read it and fully understand its contents. In other cases, subjects are simply provided a copy of the consent form and researchers are responsible for making sure that subjects have read and understand the form before proceeding with any kind of data collection. Figure 5.1 showcases a sample informed consent form taken from a research project on child-free adults. Note that this consent form describes a risk that may be unique to the particular method of data collection being employed: focus groups.


a sample informed consent form
Figure 5.1 Sample informed consent form

Figure 5.1 is copied from Blackstone, A. (2012) Principles of sociological inquiry: Qualitative and quantitative methods. Saylor Foundation. Retrieved from: https://saylordotorg.github.io/text_principles-of-sociological-inquiry-qualitative-and-quantitative-methods/ Shared under CC-BY-NC-SA 3.0 License (https://creativecommons.org/licenses/by-nc-sa/3.0/)

One last point to consider when preparing to obtain informed consent is that not all potential research subjects are considered equally competent or legally allowed to consent to participate in research. Subjects from vulnerable populations may be at risk of experiencing undue influence or coercion. The US Department of Health and Human Services’ guidelines on vulnerable populations can be read at  https://www.hhs.gov/ohrp/regulations-and-policy/guidance/vulnerable-populations/index.html. The rules for consent are more stringent for vulnerable populations. For example, minors must have the consent of a legal guardian in order to participate in research. In some cases, the minors themselves are also asked to participate in the consent process by signing special, age-appropriate consent forms designed specifically for them. Prisoners and parolees also qualify as vulnerable populations. Concern about the vulnerability of these subjects comes from the very real possibility that prisoners and parolees could perceive that they will receive some highly desired reward, such as early release, if they participate in research. Another potential concern regarding vulnerable populations is that they may be underrepresented in research, and even denied potential benefits of participation in research, specifically because of concerns about their ability to consent. So, on the one hand, researchers must take extra care to ensure that their procedures for obtaining consent from vulnerable populations are not coercive. The procedures for receiving approval to conduct research on these groups may be more rigorous than that for non-vulnerable populations. On the other hand, researchers must work to avoid excluding members of vulnerable populations from participation simply on the grounds that they are vulnerable or that obtaining their consent may be more complex. While there is no easy solution to this double-edged sword, an awareness of the potential concerns associated with research on vulnerable populations is important for identifying whatever solution is most appropriate for a specific case.

Protection of identities

As mentioned earlier, the informed consent process includes the requirement that researchers outline how they will protect the identities of subjects. This aspect of the process, however, is one of the most commonly misunderstood aspects of research.

In protecting subjects’ identities, researchers typically promise to maintain either the anonymity or confidentiality of their research subjects. Anonymity is the more stringent of the two. When a researcher promises anonymity to participants, not even the researcher is able to link participants’ data with their identities. Anonymity may be impossible for some social work researchers to promise because several of the modes of data collection that social workers employ. Face-to-face interviewing means that subjects will be visible to researchers and will hold a conversation, making anonymity impossible. In other cases, the researcher may have a signed consent form or obtain personal information on a survey and will therefore know the identities of their research participants. In these cases, a researcher should be able to at least promise confidentiality to participants.

Offering confidentiality means that some identifying information on one’s subjects is known and may be kept, but only the researcher can link participants with their data and she promises not to do so publicly. Confidentiality in research is quite similar to confidentiality in clinical practice. You know who your clients are, but others do not. You agree to keep their information and identity private. As you can see under the “Risks” section of the consent form in Figure 5.1, sometimes it is not even possible to promise that a subject’s confidentiality will be maintained. This is the case if data are collected in public or in the presence of other research participants in the course of a focus group, for example. Participants who social work researchers deem to be of imminent danger to self or others or those that disclose abuse of children and other vulnerable populations fall under a social worker’s duty to report. Researchers must then violate confidentiality to fulfill their legal obligations.


a person in silhouette behind blinds

Protecting research participants’ identities is not always a simple prospect, especially for those conducting research on stigmatized groups or illegal behaviors. Sociologist Scott DeMuth learned that all too well when conducting his dissertation research on a group of animal rights activists. As a participant observer, DeMuth knew the identities of his research subjects. So when some of his research subjects vandalized facilities and removed animals from several research labs at the University of Iowa, a grand jury called on Mr. DeMuth to reveal the identities of the participants in the raid. When DeMuth refused to do so, he was jailed briefly and then charged with conspiracy to commit animal enterprise terrorism and cause damage to the animal enterprise (Jaschik, 2009). Jaschik, S. (2009, December 4). Protecting his sources. Inside Higher Ed. Retrieved from: http://www.insidehighered.com/news/2009/12/04/demuth

Publicly, DeMuth’s case raised many of the same questions as Laud Humphreys’ work 40 years earlier. What do social scientists owe the public? Is DeMuth, by protecting his research subjects, harming those whose labs were vandalized? Is he harming the taxpayers who funded those labs? Or is it more important that DeMuth emphasize what he owes his research subjects, who were told their identities would be protected? DeMuth’s case also sparked controversy among academics, some of whom thought that as an academic himself, DeMuth should have been more sympathetic to the plight of the faculty and students who lost years of research as a result of the attack on their labs. Many others stood by DeMuth, arguing that the personal and academic freedom of scholars must be protected whether we support their research topics and subjects or not. DeMuth’s academic adviser even created a new group, Scholars for Academic Justice (http://sajumn.wordpress.com), to support DeMuth and other academics who face persecution or prosecution as a result of the research they conduct. What do you think? Should DeMuth have revealed the identities of his research subjects? Why or why not?

Disciplinary considerations

 Often times, specific disciplines will provide their own set of guidelines for protecting research subjects and, more generally, for conducting ethical research. For social workers, the National Association of Social Workers (NASW) Code of Ethics section 5.02 describes the responsibilities of social workers in conducting research. Summarized below, these responsibilities are framed as part of a social worker’s responsibility to the profession. As representative of the social work profession, it is your responsibility to conduct and use research in an ethical manner.

A social worker should:


Key Takeaways

  • Researchers must obtain the informed consent of the people who participate in their research.
  • Social workers must take steps to minimize the harms that could arise during the research process.
  • If a researcher promises anonymity, she cannot link individual participants with their data.
  • If a researcher promises confidentiality, she promises not to reveal the identities of research participants, even though she can link individual participants with their data.
  • The NASW Code of Ethics includes specific responsibilities for social work researchers.


Glossary

  • Anonymity- the identity of research participants is not known to researchers
  • Confidentiality- identifying information about research participants is known to the researchers but is not divulged to anyone else
  • Informed consent- a research subject’s voluntary agreement to participate in a study based on a full understanding of the study and of the possible risks and benefits involved


Image attributions

consent by Catkin CC-0

Anonymous by kalhh CC-0


21

5.3 Ethics at micro, meso, and macro levels

Learning Objectives

  • Identify and distinguish between micro-, meso-, and macro-level considerations with respect to the ethical conduct of social scientific research


One useful way to think about the breadth of ethical questions that might arise out of any research project is to think about potential issues from the perspective of different analytical levels. In Chapter 1, you learned about the micro-, meso-, and macro-levels of inquiry and how a researcher’s specific point of focus might vary depending on her level of inquiry. Here we’ll apply this ecological framework to a discussion of research ethics. Within most research projects, there are specific questions that arise for researchers at each of these three levels.

At the micro-level, researchers must consider their own conduct and the rights of individual research participants. For example, did Stanley Milgram behave ethically when he allowed research participants to think that they were administering electronic shocks to fellow participants? Did Laud Humphreys behave ethically when he deceived his research subjects about his own identity? Were the rights of individuals in these studies protected? The questions posed here are the sort that you will want to ask yourself as a researcher when considering ethics at the micro-level.

At the meso-level, researchers should think about their duty to the community. How will the results of your study impact your target population? Ideally, your results will benefit your target population by identifying important areas for social workers to intervene. However, it is possible that your study may perpetuate negative stereotypes about your target population or damage its reputation. Indigenous people in particular have highlighted how historically social science has furthered marginalization of indigenous peoples (Smith, 2013). Smith, L. T. (2013). Decolonizing methodologies: Research and indigenous peoples (2nd edition). London: Zed Books, Ltd. In addition to your target population, you must also consider your responsibilities to the profession of social work. When you engage in social work research, you stand on the reputation the profession has built for over a century. Attending to research ethics helps to fulfill your responsibilities to the profession, in addition to your target population.

Finally, at the macro-level, a researcher should consider her duty to, and the expectations of, society. Perhaps the most high-profile case involving macro-level questions of research ethics comes from debates over whether to use data gathered by, or cite published studies based on data gathered from, the Nazis in the course of their unethical and horrendous experiments on humans during World War II (Moe, 1984). Moe, K. (1984). Should the Nazi research data be cited? The Hastings Center Report, 14, 5–7. Some argue that because the data were gathered in such an unquestionably unethical manner, they should never be used. Further, some who argue against using the Nazi data point out that not only were the experiments immoral but the methods used to collect data were also scientifically questionable. The data, say these people, are neither valid nor reliable and should therefore not be used in any current scientific investigation (Berger, 1990). Berger, P. L. (1990). Nazi science: The Dachau hypothermia experiments. New England Journal of Medicine, 322, 1435–1440.

On the other hand, some people argue that data themselves are neutral; that “information gathered is independent of the ethics of the methods and that the two are not linked together” (Pozos, 1992, p. 104). Pozos, R. S. (1992). Scientific inquiry and ethics: The Dachau data. In A. L. Caplan (Ed.), When medicine went mad: Bioethics and the Holocaust (p. 104). Totowa, NJ: Humana Press. Others point out that not using the data could inadvertently strengthen the claims of those who deny that the Holocaust ever happened. In his striking statement in support of publishing the data, medical ethics professor Velvl Greene (1992) says,

Instead of banning the Nazi data or assigning it to some archivist or custodial committee, I maintain that it be exhumed, printed, and disseminated to every medical school in the world along with the details of methodology and the names of the doctors who did it, whether or not they were indicted, acquitted, or hanged.…Let the students and the residents and the young doctors know that this was not ancient history or an episode from a horror movie where the actors get up after filming and prepare for another role. It was real. It happened yesterday (p. 169–170). Greene, V. W. (1992). Can scientists use information derived from the concentration camps? Ancient answers to new questions. In A. L. Caplan (Ed.), When medicine went mad: Bioethics and the Holocaust (p. 169–170). Totowa, NJ: Humana Press.

While debates about the use of data collected by the Nazis are typically centered on medical scientists’ use of them, there are conceivable circumstances under which these data might be used by social scientists. Perhaps, for example, a social scientist might wish to examine contemporary reactions to the experiments. Or perhaps the data could be used in a study of the sociology of science. What do you think? Should data gathered by the Nazis be used or cited today? What arguments can you make in support of your position, and how would you respond to those who disagree? Table 5.1 summarizes the key questions that researchers might ask themselves about the ethics of their research at each level of inquiry.


Table 5.1 Key ethics questions at three different levels of inquiry
Level of inquiry Focus Key ethics questions for researchers to ask themselves
Micro-level Individual Does my research impinge on the individual’s right to privacy?
Could my research offend subjects in any way?
Could my research cause emotional distress to any of my subjects?
Has my own conduct been ethical throughout the research process?
Meso-level Group Does my research follow the ethical guidelines of my profession and discipline?
Could my research negatively impact a community?
Have I met my duty to those who funded my research?
Macro-level Society Does my research meet the societal expectations of social research?
Have I met my social responsibilities as a researcher?


Key Takeaways

  • At the micro-level, researchers should consider their own conduct and the rights of individual research participants.
  • At the meso-level, researchers should consider the expectations of their profession, any organizations that may have funded their research, and the communities affected by their research.
  • At the macro-level, researchers should consider their duty to and the expectations of society with respect to social scientific research.


22

5.4 The practice of science versus the uses of science

Learning Objectives

  • Identify why researchers must provide a detailed description of methodology
  • Describe what it means to use science in an ethical way


Research ethics has to do with both how research is conducted and how findings from that research are used. In this section, we’ll consider research ethics from both angles.

Doing science the ethical way

As you should now be aware, researchers must consider their own personal ethical principles in addition to following those of their institution, their discipline, and their community. We’ve already considered many of the ways that social workers strive to ensure the ethical practice of research, such as informing and protecting subjects. But the practice of ethical research doesn’t end once subjects have been identified and data have been collected. Social workers must also fully disclose their research procedures and findings. This means being honest about how research subjects were identified and recruited, how exactly data were collected and analyzed, and ultimately, what findings were reached.

If researchers fully disclose how they conducted their research, then those who use their work to build research projects, create social policies, or make decisions can have confidence in the work. By sharing how research was conducted, a researcher helps assure readers she has conducted legitimate research and didn’t simply come to whatever conclusions she wanted to find. A description or presentation of research findings that is not accompanied by information about research methodology is missing some relevant information. Sometimes methodological details are left out because there isn’t time or space to share them. This is often the case with news reports of research findings. Other times, there may be a more insidious reason that that important information isn’t there. This may be the case if sharing methodological details would call the legitimacy of a study into question. As researchers, it is our ethical responsibility to fully disclose our research procedures. As consumers of research, it is our ethical responsibility to pay attention to such details. We’ll discuss this more in the next section.

There’s a New Yorker cartoon (https://www.art.com/products/p15063407512-sa-i6847806/dana-fradon-filing-cabinets-labeled-our-facts-their-facts-neutral-facts-disput-new-yorker-cartoon.htm?upi=PGQTTQ0) that depicts a set of filing cabinets that aptly demonstrates what we don’t want to see happen with research. Each filing cabinet drawer in the cartoon is labeled differently. The labels include such headings as, “Our Facts,” “Their Facts,” “Neutral Facts,” “Disputable Facts,” “Absolute Facts,” “Bare Facts,” “Unsubstantiated Facts,” and “Indisputable Facts.” The implication of this cartoon is that one might just choose to open the file drawer of her choice and pick whichever facts one likes best. While this may occur if we use some of the unscientific ways of knowing described in Chapter 1, it is fortunately not how the discovery of facts works in social work or in any other science for that matter. There actually is a method to this madness we call research.

Honesty in research is facilitated by the scientific principle of replication. Ideally, this means that one scientist could repeat another’s study with relative ease. By replicating a study, we may become more (or less) confident in the original study’s findings. Replication is far more difficult (perhaps impossible) to achieve in the case of ethnographic studies that last months or years, but it nevertheless sets an important standard for all social scientific researchers—that we provide as much detail as possible about the processes by which we reach our conclusions.

The word "honesty" visually constructed using other smaller words

Full disclosure also includes the need to be honest about a study’s strengths and weaknesses, both with oneself and with others. Being aware of the strengths and weaknesses of your own work can help a researcher make reasonable recommendations about the next steps other researchers might consider taking in their inquiries. Awareness and disclosure of a study’s strengths and weaknesses can also help highlight the theoretical or policy implications of one’s work. In addition, openness about strengths and weaknesses helps those reading the research better evaluate the work and decide for themselves how or whether to rely on its findings. Finally, openness about a study’s sponsors is crucial. How can we effectively evaluate research without knowing who paid the bills?

The standard of replicability along with openness about a study’s strengths, weaknesses, and funders enable those who read the research to evaluate it fairly and completely. Knowledge of funding sources is often raised as an issue in medical research. Understandably, independent studies of new drugs may be more compelling to the Food and Drug Administration (FDA) than studies touting the virtues of a new drug that happen to have been funded by the company who created that drug. But medical researchers aren’t the only ones who need to be honest about their funding. If we know, for example, that a political think tank with ties to a particular party has funded some research, we can take that knowledge into consideration when reviewing the study’s findings and stated policy implications. Lastly, and related to this point, we must consider how, by whom, and for what purpose research may be used.

Using science the ethical way

Science has many uses. By “use” I mean the ways that science is understood and applied (as opposed to the way it is conducted). Some use science to create laws and social policies; others use it to understand themselves and those around them. Some people rely on science to improve their life conditions or those of other people, while still others use it to improve their businesses or other undertakings. In each case, the most ethical way for us to use science is to educate ourselves about the design and purpose of any studies we may wish to use or apply, to recognize our limitations in terms of scientific and methodological knowledge and how those limitations may impact our understanding of research, and to apply the findings of scientific investigation only in cases or to populations for which they are actually relevant.

Social scientists who conduct research on behalf of organizations and agencies may face additional ethical questions about the use of their research, particularly when the organization for which a study is conducted controls the final report and the publicity it receives. There is a potential conflict of interest for evaluation researchers who are employees of the agency being evaluated. A similar conflict of interest might exist between independent researchers whose work is being funded by some government agency or private foundation.

So who decides what constitutes ethical conduct or use of research? Perhaps we all do. What qualifies as ethical research may shift over time and across cultures as individual researchers; disciplinary organizations; members of society; and regulatory entities, such as institutional review boards, courts, and lawmakers all work to define the boundaries between ethical and unethical research.


Key Takeaways

  • Conducting research ethically requires that researchers be ethical not only in their data collection procedures but also in reporting their methods and findings.
  • The ethical use of research requires an effort to understand research, an awareness of your own limitations in terms of knowledge and understanding, and the honest application of research findings.


Image attributions

honesty by GDJ CC-0


VI

6. Linking methods with theory

23

6.0 Chapter introduction

In this chapter, we’ll explore the connections between paradigms, social theories, and social scientific research methods. We’ll also consider how our analytic, paradigmatic, and theoretical perspective might shape or be shaped by our methodological choices. In short, we’ll answer the question of what theory has to do with research methods.

Chapter Outline

Content Advisory

This chapter discusses or mentions the following topics: laws regulating rape, sodomy, and child sexual abuse; gang communication styles; racism, policing, and lynching; domestic violence and sexual harassment; and substance abuse.

24

6.1 Micro, meso, and macro approaches

Learning Objectives

  • Describe a micro-level approach to research, and provide an example of a micro-level study
  • Describe a meso-level approach to research, and provide an example of a meso-level study
  • Describe a macro-level approach to research, and provide an example of a macro-level study


In Chapter 1, we reviewed the micro, meso, and macro framework that social workers use to understand the world. As you’ll recall, micro-level research studies individuals and one-on-one interactions, meso-level research studies groups, and macro-level research studies institutions and policies. Let’s take a closer look at some specific examples of social work research to better understand each of the three levels of inquiry described previously. Some topics are best suited to be examined at one specific level, while other topics can be studied at each of the three different levels. The particular level of inquiry might shape a social worker’s questions about the topic, or a social scientist might view the topic from different angles depending on the level of inquiry being employed.

First, let’s consider some examples of different topics that are best suited to a particular level of inquiry. Work by Stephen Marks offers an excellent example of research at the micro-level. In one study, Marks and Shelley MacDermid (1996) Marks, S. R., & MacDermid, S. M. (1996). Multiple roles and the self: A theory of role balance. Journal of Marriage and the Family, 58, 417–432. draw from prior micro-level theories to empirically study how people balance their roles and identities. In this study, the researchers found that people who experience balance across their multiple roles and activities report lower levels of depression and higher levels of self-esteem and well-being than their less-balanced counterparts. In another study, Marks and colleagues examined the conditions under which husbands and wives feel the most balance across their many roles. They found that different factors are important for different genders. For women, having more paid work hours and more couple time were among the most important factors. For men, having leisure time with their nuclear families was important, and role balance decreased as work hours increased (Marks, Huston, Johnson, & MacDermid, 2001). Marks, S. R., Huston, T. L., Johnson, E. M., & MacDermid, S. M. (2001). Role balance among white married couples. Journal of Marriage and the Family, 63, 1083–1098. Both of these studies fall within the category of micro-level analysis.

At the meso-level, social scientists tend to study the experiences of groups and the interactions between groups. In a recent book based on their research with Somali immigrants, Kim Huisman and colleagues (Huisman, Hough, Langellier, & Toner, 2011) Huisman, K. A., Hough, M., Langellier, K. M., & Toner, C. N. (2011). Somalis in Maine: Crossing cultural currents. New York, NY: Random House. examine the interactions between Somalis and Americans in Maine. These researchers found that stereotypes about refugees being unable or unwilling to assimilate and being overly dependent on local social systems are unsubstantiated. In a much different study of group-level interactions, Michael Messner (2009) Messner, M. A. (2009). It’s all for the kids: Gender, families, and youth sports. Berkeley, CA: University of California Press. conducted research on children’s sports leagues. Messner studied interactions among parent volunteers, among youth participants, and between league organizers and parents and found that gender boundaries and hierarchies are perpetuated by the adults who run such leagues. These two studies, while very different in their specific points of focus, have in common their meso-level focus.

Social workers who conduct macro-level research study interactions at the broadest level, such as interactions between and across nations, states, or cultural systems. One example of macro-level research can be seen in a recent article by David Frank and colleagues (Frank, Camp, & Boutcher, 2010). Frank, D., Camp, B., & Boutcher, S. (2010). Worldwide trends in the criminal regulation of sex, 1945–2005. American Sociological Review, 75, 867–893. These researchers examined worldwide changes over time in laws regulating sex. By comparing laws across a number of countries over a period of many years (1945–2005), Frank learned that laws regulating rape, adultery, sodomy, and child sexual abuse shifted in focus from protecting larger entities, such as families, to protecting individuals. In another macro-level study, Leah Ruppanner (2010) Ruppanner, L. E. (2010). Cross-national reports of housework: An investigation of the gender empowerment measure. Social Science Research, 39, 963–975. studied how national levels of gender equality in 25 different countries affect couples’ divisions of housework. Ruppanner found that as women’s parliamentary representation increases, so does men’s participation in housework.

While it is true that some topics lend themselves to a particular level of inquiry, there are many topics that could be studied from any of the three levels. The choice depends on the specific interest of the researcher, the approach she would like to take and the sorts of questions she wants to be able to answer about the topic.

Let’s look at an example. Gang activity has been a topic of interest to social workers for many years and has been studied from each of the levels of inquiry described here. At the micro-level, social workers might study the inner workings of a specific gang, communication styles, and what everyday life is like for gang members. Though not written by a social worker, one example of a micro-level analysis of gang activity can be found in Sanyika Shakur’s 1993 autobiography, MonsterShakur, S. (1993). Monster: The autobiography of an L.A. gang member. New York, NY: Atlantic Monthly Press. In his book, Shakur describes his former day-to-day life as a member of the Crips in South-Central Los Angeles. Shakur’s recounting of his experiences highlights micro-level interactions between himself, fellow Crips members, and other gangs.

At the meso-level, social workers are likely to examine interactions between gangs or perhaps how different branches of the same gang vary from one area to the next. At the macro-level, we could compare the impact of gang activity across communities or examine the economic impact of gangs on nations. Excellent examples of gang research at all three levels of analysis can be found in the Journal of Gang Research published by the National Gang Crime Research Center (NGCRC). The Journal of Gang Research is the official publication of the National Gang Crime Research Center (NGCRC). You can learn more about the NGCRC and the journal at http://www.ngcrc.com. Sudhir Venkatesh’s (2008) study, Gang Leader for a DayVenkatesh, S. (2008). Gang leader for a day: A rogue sociologist takes to the streets. New York, NY: Penguin Group. is an example of research on gangs that utilizes all three levels of analysis. Venkatesh conducted participant observation with a gang in Chicago. He learned about the everyday lives of gang members (micro) and how the gang he studied interacted with and fit within the landscape of other gang “franchises” (meso). In addition, Venkatesh described the impact of the gang on the broader community and economy (macro).


Key Takeaways

  • Social work research can occur at any of the following three analytical levels: micro, meso, or macro.
  • Some topics lend themselves to one particular analytical level, while others could be studied from any, or all, of the three levels of analysis.


25

6.2 Paradigms, theories, and how they shape a researcher’s approach

Learning Objectives

  • Define paradigm, and describe the significance of paradigms
  • Identify and describe the four predominant paradigms found in the social sciences
  • Define theory
  • Describe the role that theory plays in social work research


The terms paradigm and theory are often used interchangeably in social science, although social scientists do not always agree whether these are identical or distinct concepts. In this text, I will make a clear distinction between the two ideas because thinking about each concept as analytically distinct provides a useful framework for understanding the connections between research methods and social scientific ways of thinking.

Paradigms in social science

 For our purposes, we’ll define paradigm as a way of viewing the world (or “analytic lens” akin to a set of glasses) and a framework from which to understand the human experience (Kuhn, 1962). See Kuhn’s seminal work for more on paradigms: Kuhn, T. (1962). The structure of scientific revolutions. Chicago, IL: University of Chicago Press. It can be difficult to fully grasp the idea of paradigmatic assumptions because we are very ingrained in our own, personal everyday way of thinking. For example, let’s look at people’s views on abortion. To some, abortion is a medical procedure that should be undertaken at the discretion of each individual woman. To others, abortion is murder and members of society should collectively have the right to decide when, if at all, abortion should be undertaken. Chances are, if you have an opinion about this topic, you are pretty certain about the veracity of your perspective. Then again, the person who sits next to you in class may have a very different opinion and yet be equally confident about the truth of their perspective. Who is correct?

You are each operating under a set of assumptions about the way the world does—or at least should—work. Perhaps your assumptions come from your political perspective, which helps shape your view on a variety of social issues, or perhaps your assumptions are based on what you learned from your parents or in church. In any case, there is a paradigm that shapes your stance on the issue. Those paradigms are a set of assumptions. Your classmate might assume that life begins at conception and the fetus’ life should be at the center of moral analysis. Conversely, you may assume that life begins when the fetus is viable outside the womb and that a mother’s choice is more important than a fetus’s life. There is no way to scientifically test when life begins, whose interests are more important, or the value of choice. They are merely philosophical assumptions or beliefs. Thus, a pro-life paradigm may rest in part on a belief in divine morality and fetal rights. A pro-choice paradigm may rest on a mother’s self-determination and a belief that the positive consequences of abortion outweigh the negative ones. These beliefs and assumptions influence how we think about any aspect of the issue.


a dusty lens held up to the light

In Chapter 1, we discussed the various ways that we know what we know. Paradigms are a way of framing what we know, what we can know, and how we can know it. In social science, there are several predominant paradigms, each with its own unique ontological and epistemological perspective. Recall that ontology is the study of what is real, and epistemology is the study of how we come to know what is real. Let’s look at four of the most common social scientific paradigms that might guide you as you begin to think about conducting research.

The first paradigm we’ll consider, called positivism, is the framework that likely comes to mind for many of you when you think of science. Positivism is guided by the principles of objectivity, knowability, and deductive logic. Deductive logic is discussed in more detail in next section of this chapter. The positivist framework operates from the assumption that society can and should be studied empirically and scientifically. Positivism also calls for a value-free science, one in which researchers aim to abandon their biases and values in a quest for objective, empirical, and knowable truth.

Another predominant paradigm in social work is social constructionism. Peter Berger and Thomas Luckman (1966) Berger, P. L., & Luckman, T. (1966). The social construction of reality: A treatise in the sociology of knowledge. New York, NY: Doubleday. are credited by many for having developed this perspective in sociology. While positivists seek “the truth,” the social constructionist framework posits that “truth” varies. Truth is different based on who you ask, and people change their definitions of truth all the time based on their interactions with other people. This is because we, according to this paradigm, create reality ourselves (as opposed to it simply existing and us working to discover it) through our interactions and our interpretations of those interactions. Key to the social constructionist perspective is the idea that social context and interaction frame our realities.

Researchers operating within this framework take keen interest in how people come to socially agree, or disagree, about what is real and true. Consideration of how meanings of different hand gestures vary across different regions of the world aptly demonstrates that meanings are constructed socially and collectively. Think about what it means to you when you see a person raise their middle finger. We probably all know that person isn’t very happy (nor is the person to whom the finger is being directed). In some societies, it is another gesture, such as the thumbs up gesture, that raises eyebrows. While the thumbs up gesture may have a particular meaning in North American culture, that meaning is not shared across cultures (Wong, 2007). For more about how the meanings of hand gestures vary by region, you might read the following blog entry: Wong, W. (2007). The top 10 hand gestures you’d better get right. Retrieved from http://www.languagetrainers.co.uk/blog/2007/09/24/top-10-hand-gestures So, what is the “truth” of the middle finger or thumbs up? It depends on what the person giving it intended, how the person receiving it interpreted it, and the social context in which the action occurred.

It would be a mistake to think of the social constructionist perspective as only individualistic. While individuals may construct their own realities, groups—from a small one such as a married couple to large ones such as nations—often agree on notions of what is true and what “is.” In other words, the meanings that we construct have power beyond the individual people who create them. Therefore, the ways that people and communities work to create and change such meanings is of as much interest to social constructionists as how they were created in the first place.

A third paradigm is the critical paradigm. At its core, the critical paradigm is focused on power, inequality, and social change. Although some rather diverse perspectives are included here, the critical paradigm, in general, includes ideas developed by early social theorists, such as Max Horkheimer (Calhoun, Gerteis, Moody, Pfaff, & Virk, 2007), Calhoun, C., Gerteis, J., Moody, J., Pfaff, S., & Virk, I. (Eds.). (2007). Classical sociological theory (2nd ed.). Malden, MA: Blackwell. and later works developed by feminist scholars, such as Nancy Fraser (1989). Fraser, N. (1989). Unruly practices: Power, discourse, and gender in contemporary social theory. Minneapolis, MN: University of Minnesota Press. Unlike the positivist paradigm, the critical paradigm posits that social science can never be truly objective or value-free. Further, this paradigm operates from the perspective that scientific investigation should be conducted with the express goal of social change in mind. Researchers in the critical paradigm might start with the knowledge that systems are biased against, for example, women or ethnic minorities. Moreover, their research projects are designed not only to collect data, but also change the participants in the research as well as the systems being studied. The critical paradigm not only studies power imbalances but seeks to change those power imbalances.

Finally, postmodernism is a paradigm that challenges almost every way of knowing that many social scientists take for granted (Best & Kellner, 1991). Best, S., & Kellner, D. (1991). Postmodern theory: Critical interrogations. New York, NY: Guilford. While positivists claim that there is an objective, knowable truth, postmodernists would say that there is not. While social constructionists may argue that truth is in the eye of the beholder (or in the eye of the group that agrees on it), postmodernists may claim that we can never really know such truth because, in the studying and reporting of others’ truths, the researcher stamps their own truth on the investigation. Finally, while the critical paradigm may argue that power, inequality, and change shape reality and truth, a postmodernist may in turn ask whose power, whose inequality, whose change, whose reality, and whose truth. As you might imagine, the postmodernist paradigm poses quite a challenge for researchers. How do you study something that may or may not be real or that is only real in your current and unique experience of it? This fascinating question is worth pondering as you begin to think about conducting your own research. Part of the value of the postmodern paradigm is its emphasis on the limitations of human knowledge. Table 6.1 summarizes each of the paradigms discussed here.

Table 6.1 Social scientific paradigms
Paradigm Emphasis Assumption
Positivism Objectivity, knowability, and deductive logic Society can and should be studied empirically and scientifically.
Social Constructionism Truth as varying, socially constructed, and ever-changing Reality is created collectively. Social context and interaction frame our realities.
Critical Power, inequality, and social change Social science can never be truly value-free and should be conducted with the express goal of social change in mind.
Postmodernism Inherent problems with previous paradigms. Truth is always bound within historical and cultural context. There are no universally true explanations.

Let’s work through an example. If we are examining a problem like substance abuse, what would a social scientific investigation look like in each paradigm? A positivist study may focus on precisely measuring substance abuse and finding out the key causes of substance abuse during adolescence. Forgoing the objectivity of precisely measuring substance abuse, social constructionist study might focus on how people who abuse substances understand their lives and relationships with various drugs of abuse. In so doing, it seeks out the subjective truth of each participant in the study. A study from the critical paradigm would investigate how people who have substance abuse problems are an oppressed group in society and seek to liberate them from external sources of oppression, like punitive drug laws, and internal sources of oppression, like internalized fear and shame. A postmodern study may involve one person’s self-reported journey into substance abuse and changes that occurred in their self-perception that accompanied their transition from recreational to problematic drug use. These examples should illustrate how one topic can be investigated across each paradigm.

Social science theories

Much like paradigms, theories provide a way of looking at the world and of understanding human interaction. Paradigms are grounded in big assumptions about the world—what is real, how do we create knowledge—whereas theories describe more specific phenomena. A common definition for theory in social work is “a systematic set of interrelated statements intended to explain some aspect of social life” (Rubin & Babbie, 2017, p. 615). Rubin, A., and Babbie, E. R. (2017). Research methods for social work (9th ed.). Belmont: Wadsworth At their core, theories can be used to provide explanations of any number or variety of phenomena. They help us answer the “why” questions we often have about the patterns we observe in social life. Theories also often help us answer our “how” questions. While paradigms may point us in a particular direction with respect to our “why” questions, theories more specifically map out the explanation, or the “how,” behind the “why.”


the word why spelled out with small question marks

Introductory social work textbooks introduce students to the major theories in social work—conflict theory, symbolic interactionism, social exchange theory, and systems theory. As social workers study longer, they are introduced to more specific theories in their area of focus, as well as perspectives and models (e.g., the strengths perspective), which provide more practice-focused approaches to understanding social work.

As you will probably recall from a class on social work theory, systems theorists view all parts of society as interconnected and focus on the relationships, boundaries, and flows of energy between these systems and subsystems (Schriver, 2011). Schriver, J. M. (2011). Human behavior and the social environment: Shifting paradigms in essential knowledge for social work practice (5th ed.) Boston, MA: Pearson. Conflict theorists are interested in questions of power and who wins and who loses based on the way that society is organized. Symbolic interactionists focus on how meaning is created and negotiated through meaningful (i.e., symbolic) interactions. Finally, social exchange theorists examine how human beings base their behavior on a rational calculation of rewards and costs.

Just as researchers might examine the same topic from different levels of inquiry or paradigms, they could also investigate the same topic from different theoretical perspectives. In this case, even their research questions could be the same, but the way they make sense of whatever phenomenon it is they are investigating will be shaped in large part by theory. Table 6.2 summarizes the major points of focus for each of major four theories and outlines how a researcher might approach the study of the same topic, in this case the study of substance abuse, from each of the three perspectives.

Table 6.2 Social work theories and the study of substance abuse
Theory Focuses on A study of substance abuse might examine
Systems Interrelations between parts of society; how parts work together How a lack of employment opportunities might impact rates of substance abuse in an area
Conflict Who wins and who loses based on the way that society is organized How the War on Drugs has impacted minority communities
Symbolic Interactionism How meaning is created and negotiated though interactions How people’s self-definitions as “addicts” helps or hurts their ability to remain sober
Social Exchange How behavior is influenced by costs and rewards Whether increased distribution of anti-overdose medications makes overdose more or less likely

Within each area of specialization in social work, there are many other theories that aim to explain more specific types of interactions. For example, within the study of sexual harassment, different theories posit different explanations for why harassment occurs. One theory, first developed by criminologists, is called routine activities theory. It posits that sexual harassment is most likely to occur when a workplace lacks unified groups and when potentially vulnerable targets and motivated offenders are both present (DeCoster, Estes, & Mueller, 1999). DeCoster, S., Estes, S. B., & Mueller, C. W. (1999). Routine activities and sexual harassment in the workplace. Work and Occupations, 26, 21–49. Other theories of sexual harassment, called relational theories, suggest that a person’s relationships, such as their marriages or friendships, are the key to understanding why and how workplace sexual harassment occurs and how people will respond to it when it does occur (Morgan, 1999). Morgan, P. A. (1999). Risking relationships: Understanding the litigation choices of sexually harassed women. The Law and Society Review, 33, 201–226. Relational theories focus on the power that different social relationships provide (e.g., married people who have supportive partners at home might be more likely than those who lack support at home to report sexual harassment when it occurs). Finally, feminist theories of sexual harassment take a different stance. These theories posit that the way our current gender system is organized, where those who are the most masculine have the most power, best explains why and how workplace sexual harassment occurs (MacKinnon, 1979). MacKinnon, C. 1979. Sexual harassment of working women: A case of sex discrimination. New Haven, CT: Yale University Press. As you might imagine, which theory a researcher applies to examine the topic of sexual harassment will shape the questions the researcher asks about harassment. It will also shape the explanations the researcher provides for why harassment occurs.

For an undergraduate student beginning their study of a new topic, it may be intimidating to learn that there are so many theories beyond what you’ve learned in your theory classes. What’s worse is that there is no central database of different theories on your topic. However, as you review the literature in your topic area, you will learn more about the theories that scientists have created to explain how your topic works in the real world. In addition to peer-reviewed journal articles, another good source of theories is a book about your topic. Books often contain works of theoretical and philosophical importance that are beyond the scope of an academic journal.

Paradigm and theory in social work

Theories, paradigms, levels of analysis, and the order in which one proceeds in the research process all play an important role in shaping what we ask about the social world, how we ask it, and in some cases, even what we are likely to find. A micro-level study of gangs will look much different than a macro-level study of gangs. In some cases, you could apply multiple levels of analysis to your investigation, but doing so isn’t always practical or feasible. Therefore, understanding the different levels of analysis and being aware of which level you happen to be employing is crucial. One’s theoretical perspective will also shape a study. In particular, the theory invoked will likely shape not only the way a question about a topic is asked but also which topic gets investigated in the first place. Further, if you find yourself especially committed to one theory over another, it may limit the kinds of questions you pose. As a result, you may miss other possible explanations.

The limitations of paradigms and theories do not mean that social science is fundamentally biased. At the same time, we can never claim to be entirely value free. Social constructionists and postmodernists might point out that bias is always a part of research to at least some degree. Our job as researchers is to recognize and address our biases as part of the research process, if an imperfect part. We all use our own approaches, be they theories, levels of analysis, or temporal processes, to frame and conduct our work. Understanding those frames and approaches is crucial not only for successfully embarking upon and completing any research-based investigation, but also for responsibly reading and understanding others’ work.


Key Takeaways

  • Paradigms shape our everyday view of the world.
  • Researchers use theory to help frame their research questions and to help them make sense of the answers to those questions.
  • Applying the four key theories of social work is a good start, but you will likely have to look for more specific theories about your topic.


Glossary

  • Critical paradigm- a paradigm in social science research focused on power, inequality, and social change
  • Paradigm- a way of viewing the world and a framework from which to understand the human experience
  • Positivism- a paradigm guided by the principles of objectivity, knowability, and deductive logic
  • Postmodernism- a paradigm focused on the historical and contextual embeddedness of scientific knowledge and a skepticism towards certainty and grand explanations in social science
  • Social constructionism- a paradigm based on the idea that social context and interaction frame our realities
  • Theory- “a systematic set of interrelated statements intended to explain some aspect of social life” (Rubin & Babbie, 2017, p. 615)


Image attributions

point mold and cloud mold by tasaikensuke CC-0

why by GDJ CC-0


26

6.3 Inductive and deductive reasoning

Learning Objectives

  • Describe the inductive approach to research, and provide examples of inductive research
  • Describe the deductive approach to research, and provide examples of deductive research
  • Describe the ways that inductive and deductive approaches may be complementary


Theories structure and inform social work research. So, too, does research structure and inform theory. The reciprocal relationship between theory and research often becomes evident to students new to these topics when they consider the relationships between theory and research in inductive and deductive approaches to research. In both cases, theory is crucial. But the relationship between theory and research differs for each approach.

Inductive and deductive approaches to research are quite different, but they can also be complementary. Let’s start by looking at each one and how they differ from one another. Then we’ll move on to thinking about how they complement one another.

Inductive approaches and some examples

In an inductive approach to research, a researcher begins by collecting data that is relevant to her topic of interest. Once a substantial amount of data have been collected, the researcher will then take a breather from data collection, stepping back to get a bird’s eye view of their data. At this stage, the researcher looks for patterns in the data, working to develop a theory that could explain those patterns. Thus, when researchers take an inductive approach, they start with a set of observations and then they move from those particular experiences to a more general set of propositions about those experiences. In other words, they move from data to theory, or from the specific to the general. Figure 6.1 outlines the steps involved with an inductive approach to research.


logic of inductive reasoning from specific level of focus to general
Figure 6.1 Inductive research

There are many good examples of inductive research, but we’ll look at just a few here. One fascinating study in which the researchers took an inductive approach is Katherine Allen, Christine Kaestle, and Abbie Goldberg’s (2011) study Allen, K. R., Kaestle, C. E., & Goldberg, A. E. (2011). More than just a punctuation mark: How boys and young men learn about menstruation. Journal of Family Issues, 32, 129–156. of how boys and young men learn about menstruation. To understand this process, Allen and her colleagues analyzed the written narratives of 23 young men in which the men described how they learned about menstruation, what they thought of it when they first learned about it, and what they think of it now. By looking for patterns across all 23 men’s narratives, the researchers were able to develop a general theory of how boys and young men learn about this aspect of girls’ and women’s biology. They conclude that sisters play an important role in boys’ early understanding of menstruation, that menstruation makes boys feel somewhat separated from girls, and that as they enter young adulthood and form romantic relationships, young men develop more mature attitudes about menstruation. Note how this study began with the data—men’s narratives of learning about menstruation—and tried to develop a theory.

In another inductive study, Kristin Ferguson and colleagues (Ferguson, Kim, & McCoy, 2011) Ferguson, K. M., Kim, M. A., & McCoy, S. (2011). Enhancing empowerment and leadership among homeless youth in agency and community settings: A grounded theory approach. Child and Adolescent Social Work Journal, 28, 1–22. analyzed empirical data to better understand how best to meet the needs of young people who are homeless. The authors analyzed data from focus groups with 20 young people at a homeless shelter. From these data they developed a set of recommendations for those interested in applied interventions that serve homeless youth. The researchers also developed hypotheses for people who might wish to conduct further investigation of the topic. Though Ferguson and her colleagues did not test the hypotheses that they developed from their analysis, their study ends where most deductive investigations begin: with a theory and a hypothesis derived from that theory.

Deductive approaches and some examples

Researchers taking a deductive approach take the steps described earlier for inductive research and reverse their order. They start with a social theory that they find compelling and then test its implications with data. That is, they move from a more general level to a more specific one. A deductive approach to research is the one that people typically associate with scientific investigation. The researcher studies what others have done, reads existing theories of whatever phenomenon she is studying, and then tests hypotheses that emerge from those theories. Figure 6.2 outlines the steps involved with a deductive approach to research.


logic of deductive research from general level of focus to specific
Figure 6.2 Deductive research

While not all researchers follow a deductive approach, as you have seen in the preceding discussion, many do, and there are a number of excellent recent examples of deductive research. We’ll take a look at a couple of those next.

In a study of US law enforcement responses to hate crimes, Ryan King and colleagues (King, Messner, & Baller, 2009) King, R. D., Messner, S. F., & Baller, R. D. (2009). Contemporary hate crimes, law enforcement, and the legacy of racial violence. American Sociological Review, 74, 291–315. hypothesized that law enforcement’s response would be less vigorous in areas of the country that had a stronger history of racial violence. The authors developed their hypothesis from their reading of prior research and theories on the topic. They tested the hypothesis by analyzing data on states’ lynching histories and hate crime responses. Overall, the authors found support for their hypothesis. One might associate this research with critical theory.

In another recent deductive study, Melissa Milkie and Catharine Warner (2011) Milkie, M. A., & Warner, C. H. (2011). Classroom learning environments and the mental health of first grade children. Journal of Health and Social Behavior, 52, 4–22. studied the effects of different classroom environments on first graders’ mental health. Based on prior research and theory, Milkie and Warner hypothesized that negative classroom features, such as a lack of basic supplies and even heat, would be associated with emotional and behavioral problems in children. One might associate this research with systems theory. The researchers found support for their hypothesis, demonstrating that policymakers should probably be paying more attention to the mental health outcomes of children’s school experiences, just as they track academic outcomes (American Sociological Association, 2011). The American Sociological Association wrote a press release on Milkie and Warner’s findings: American Sociological Association. (2011). Study: Negative classroom environment adversely affects children’s mental health. Retrieved from: https://www.sciencedaily.com/releases/2011/03/110309073717.htm

Complementary approaches

While inductive and deductive approaches to research seem quite different, they can actually be rather complementary. In some cases, researchers will plan for their study to include multiple components, one inductive and the other deductive. In other cases, a researcher might begin a study with the plan to only conduct either inductive or deductive research, but then discovers along the way that the other approach is needed to help illuminate findings. Here is an example of each such case.

The original author of the textbook from which this textbook is adapted, Dr. Amy Blackstone, relates a story about her collaborative research on sexual harassment.

We began the study knowing that we would like to take both a deductive and an inductive approach in our work. We therefore administered a quantitative survey, the responses to which we could analyze in order to test hypotheses, and also conducted qualitative interviews with a number of the survey participants. The survey data were well suited to a deductive approach; we could analyze those data to test hypotheses that were generated based on theories of harassment. The interview data were well suited to an inductive approach; we looked for patterns across the interviews and then tried to make sense of those patterns by theorizing about them.

For one paper (Uggen & Blackstone, 2004), Uggen, C., & Blackstone, A. (2004). Sexual harassment as a gendered expression of power. American Sociological Review, 69, 64–92. we began with a prominent feminist theory of the sexual harassment of adult women and developed a set of hypotheses outlining how we expected the theory to apply in the case of younger women’s and men’s harassment experiences. We then tested our hypotheses by analyzing the survey data. In general, we found support for the theory that posited that the current gender system, in which heteronormative men wield the most power in the workplace, explained workplace sexual harassment—not just of adult women but of younger women and men as well. In a more recent paper (Blackstone, Houle, & Uggen, 2006), Blackstone, A., Houle, J., & Uggen, C. “At the time I thought it was great”: Age, experience, and workers’ perceptions of sexual harassment. Presented at the 2006 meetings of the American Sociological Association. we did not hypothesize about what we might find but instead inductively analyzed interview data, looking for patterns that might tell us something about how or whether workers’ perceptions of harassment change as they age and gain workplace experience. From this analysis, we determined that workers’ perceptions of harassment did indeed shift as they gained experience and that their later definitions of harassment were   more stringent than those they held during adolescence. Overall, our desire to understand young workers’ harassment experiences fully—in terms of their objective workplace experiences, their perceptions of those experiences, and their stories of their experiences—led us to adopt both deductive and inductive approaches in the work. (Blackstone, n.d., p. 21)

Researchers may not always set out to employ both approaches in their work but sometimes find that their use of one approach leads them to the other. One such example is described eloquently in Russell Schutt’s Investigating the Social World (2006). Schutt, R. K. (2006). Investigating the social world: The process and practice of research. Thousand Oaks, CA: Pine Forge Press. As Schutt describes, researchers Lawrence Sherman and Richard Berk (1984) Sherman, L. W., & Berk, R. A. (1984). The specific deterrent effects of arrest for domestic assault. American Sociological Review, 49, 261–272. conducted an experiment to test two competing theories of the effects of punishment on deterring deviance (in this case, domestic violence). Specifically, Sherman and Berk hypothesized that deterrence theory would provide a better explanation of the effects of arresting accused batterers than labeling theory. Deterrence theory predicts that arresting an accused spouse batterer will reduce future incidents of violence. Conversely, labeling theory predicts that arresting accused spouse batterers will increase future incidents. Figure 6.3 summarizes the two competing theories and the predictions that Sherman and Berk set out to test.


3x2 matrix showing the predictions of deterrence and labeling theory
Figure 6.3 Predicting the effects of arrest on future spouse battery

Sherman and Berk found, after conducting an experiment with the help of local police in one city, that arrest did in fact deter future incidents of violence, thus supporting their hypothesis that deterrence theory would better predict the effect of arrest. After conducting this research, they and other researchers went on to conduct similar experiments The researchers did what’s called replication. in six additional cities (Berk, Campbell, Klap, & Western, 1992; Pate & Hamilton, 1992; Sherman & Smith, 1992). Berk, R., Campbell, A., Klap, R., & Western, B. (1992). The deterrent effect of arrest in incidents of domestic violence: A Bayesian analysis of four field experiments. American Sociological Review, 57, 698–708; Pate, A., & Hamilton, E. (1992). Formal and informal deterrents to domestic violence: The Dade county spouse assault experiment. American Sociological Review, 57, 691–697; Sherman, L., & Smith, D. (1992). Crime, punishment, and stake in conformity: Legal and informal control of domestic violence. American Sociological Review, 57, 680–690. Results from these follow-up studies were mixed. In some cases, arrest deterred future incidents of violence. In other cases, it did not. This left the researchers with new data that they needed to explain. The researchers therefore took an inductive approach in an effort to make sense of their latest empirical observations. The new studies revealed that arrest seemed to have a deterrent effect for those who were married and employed, but that it led to increased offenses for those who were unmarried and unemployed. Researchers thus turned to control theory, which predicts that having some stake in conformity through the social ties provided by marriage and employment, as the better explanation.


hypotheses from deterrence theory and labeling theory crossed out and hypotheses from control theory offered
Figure 6.4 Predicting the effects of arrest on future spouse battery: A new theory

All figures in this section are copied from Blackstone, A. (2012) Principles of sociological inquiry: Qualitative and quantitative methods. Saylor Foundation. Retrieved from: https://saylordotorg.github.io/text_principles-of-sociological-inquiry-qualitative-and-quantitative-methods/ Shared under CC-BY-NC-SA 3.0 License (https://creativecommons.org/licenses/by-nc-sa/3.0/)

What the Sherman and Berk research, along with the follow-up studies, shows us is that we might start with a deductive approach to research, but then, if confronted by new data that we must make sense of, we may move to an inductive approach.


Key Takeaways

  • The inductive approach begins with a set of empirical observations, seeking patterns in those observations, and then theorizing about those patterns.
  • The deductive approach begins with a theory, developing hypotheses from that theory, and then collecting and analyzing data to test those hypotheses.
  • Inductive and deductive approaches to research can be employed together for a more complete understanding of the topic that a researcher is studying.
  • Though researchers don’t always set out to use both inductive and deductive strategies in their work, they sometimes find that new questions arise in the course of an investigation that can best be answered by employing both approaches.


Glossary

  • Deductive approach- study what others have done, reads existing theories of whatever phenomenon she is studying, and then tests hypotheses that emerge from those theories
  • Inductive approach- start with a set of observations and then move from particular experiences to a more general set of propositions about those experiences


VII

7. Design and causality

27

7.0 Chapter introduction

The last chapter oriented you to the theories relevant to your topic area; the macro, meso, or micro levels of analysis; and the assumptions or paradigms of research. This chapter will use these elements to help you conceptualize and design your research project. You will make specific choices about the purpose of your research, quantitative or qualitative methods, and establishing causality. You’ll also learn how and why researchers use both qualitative and quantitative methods in the same study.

Chapter Outline

Content Advisory

This chapter discusses or mentions the following topics: child neglect and abuse, sexual harassment, the criminal justice system, homelessness, sexual and domestic violence, depression, and substance abuse.

28

7.1 Types of research

Learning Objectives

  • Differentiate among exploratory, descriptive, and explanatory research studies


A recent news story about college students’ addictions to electronic gadgets (Lisk, 2011) Lisk, J. (2011). Addiction to our electronic gadgets. Retrieved from:  https://www.youtube.com/watch?v=9lVHZZG5qvw describes findings from some current research by Professor Susan Moeller and colleagues from the University of Maryland (http://withoutmedia.wordpress.com). The story raises a number of interesting questions. Just what sorts of gadgets are students addicted to? How do these addictions work? Why do they exist, and who is most likely to experience them?

Social science research is great for answering just these sorts of questions. But in order to answer our questions well, we must take care in designing our research projects. In this chapter, we’ll consider what aspects of a research project should be considered at the beginning, including specifying the goals of the research, the components that are common across most research projects, and a few other considerations.


the word "design" in black letters with some sharpened pencils underneath

One of the first things to think about when designing a research project is what you hope to accomplish, in very general terms, by conducting the research. What do you hope to be able to say about your topic? Do you hope to gain a deep understanding of whatever phenomenon it is that you’re studying, or would you rather have a broad, but perhaps less deep, understanding? Do you want your research to be used by policymakers or others to shape social life, or is this project more about exploring your curiosities? Your answers to each of these questions will shape your research design.

Exploration, description, and explanation

You’ll need to decide in the beginning phases whether your research will be exploratory, descriptive, or explanatory. Each has a different purpose, so how you design your research project will be determined in part by this decision.

Researchers conducting exploratory research are typically at the early stages of examining their topics. These sorts of projects are usually conducted when a researcher wants to test the feasibility of conducting a more extensive study and to figure out the “lay of the land” with respect to the particular topic. Perhaps very little prior research has been conducted on this subject. If this is the case, a researcher may wish to do some exploratory work to learn what method to use in collecting data, how best to approach research subjects, or even what sorts of questions are reasonable to ask. A researcher wanting to simply satisfy her own curiosity about a topic could also conduct exploratory research. In the case of the study of college students’ addictions to their electronic gadgets, a researcher conducting exploratory research on this topic may simply wish to learn more about students’ use of these gadgets. Because these addictions seem to be a relatively new phenomenon, an exploratory study of the topic might make sense as an initial first step toward understanding it.

It is important to note that exploratory designs do not make sense for topic areas with a lot of existing research. For example, the question “What are common interventions for parents who neglect their children?” would not make much sense as a research question. One could simply look at journal articles and textbooks to see what interventions are commonly used with this population. Exploratory questions are best suited to topics that have not been studied. Students may sometimes say there is not much literature on their chosen topic, when there is in fact a large body of literature on that topic. However, that said, there are a few students each semester who pick a topic for which there is little existing research. Perhaps, if you were looking at child neglect interventions for parents who identify as transgender or parents who are refugees from the Syrian civil war, less would be known about child neglect for those specific populations. In that case, an exploratory design would make sense as there is less literature to guide your study.

Another purpose of research is to describe or define a particular phenomenon, termed descriptive research. For example, a social work researcher may want to understand what it means to be a first-generation college student or a resident in a psychiatric group home. In this case, descriptive research would be an appropriate strategy. A descriptive study of college students’ addictions to their electronic gadgets, for example, might aim to describe patterns in how many hours students use gadgets or which sorts of gadgets students tend to use most regularly.

Researchers at the Princeton Review conduct descriptive research each year when they set out to provide students and their parents with information about colleges and universities around the United States. They describe the social life at a school, the cost of admission, and student-to-faculty ratios (to name just a few of the categories reported). Although students and parents may be able to obtain much of this information on their own, having access to the data gathered by a team of researchers is much more convenient and less time consuming.


three people writing on a clear board with post-it notes, planning something

Social workers often rely on descriptive research to tell them about their service area. Keeping track of the number of children receiving foster care services, their demographic makeup (e.g., race, gender), and length of time in care are excellent examples of descriptive research. On a more macro-level, the Centers for Disease Control provides a remarkable amount of descriptive research on mental and physical health conditions. In fact, descriptive research has many useful applications, and you probably rely on findings from descriptive research without even being aware that that is what you are doing.

Finally, social work researchers often aim to explain why particular phenomena work in the way that they do. Research that answers “why” questions is referred to as explanatory research. In this case, the researcher is trying to identify the causes and effects of whatever phenomenon she is studying. An explanatory study of college students’ addictions to their electronic gadgets might aim to understand why students become addicted. Does it have anything to do with their family histories? With their other extracurricular hobbies and activities? With whom they spend their time? An explanatory study could answer these kinds of questions.

There are numerous examples of explanatory social scientific investigations. For example, in a recent study, Dominique Simons and Sandy Wurtele (2010) Simons, D. A., & Wurtele, S. K. (2010). Relationships between parents’ use of corporal punishment and their children’s endorsement of spanking and hitting other children. Child Abuse & Neglect, 34, 639–646. sought to discover whether receiving corporal punishment from parents led children to turn to violence in solving their interpersonal conflicts with other children. In their study of 102 families with children between the ages of 3 and 7, the researchers found that experiencing frequent spanking did, in fact, result in children being more likely to accept aggressive problem-solving techniques. Another example of explanatory research can be seen in Robert Faris and Diane Felmlee’s (2011) Faris, R., & Felmlee, D. (2011). Status struggles: Network centrality and gender segregation in same- and cross-gender aggression. American Sociological Review, 76, 48–73. The study has also been covered by several media outlets: Pappas, S. (2011). Popularity increases aggression in kids, study finds. Retrieved from: http://www.livescience.com/11737-popularity-increases-aggression-kids-study-finds.html research study on the connections between popularity and bullying. From their study of 8th, 9th, and 10th graders in 19 North Carolina schools, they found that aggression increased as adolescents’ popularity increased. This pattern was found until adolescents reached the top 2% in the popularity ranks. After that, aggression declines.

The choice between descriptive, exploratory, and explanatory research should be made with your research question in mind. What does your question ask? Are you trying to learn the basics about a new area, establish a clear “why” relationship, or define or describe an activity or concept? In the next section, we will explore how each type of research is associated with different methods, paradigms, and forms of logic.


Key Takeaways

  • Exploratory research is usually conducted when a researcher has just begun an investigation and wishes to understand the topic generally.
  • Descriptive research is research that aims to describe or define the topic at hand.
  • Explanatory research is research that aims to explain why particular phenomena work in the way that they do.


Glossary

  • Descriptive research- research that describes or define a particular phenomenon
  • Explanatory research- explains why particular phenomena work in the way that they do, answers “why” questions
  • Exploratory research- conducted during the early stages of a project, usually when a researcher wants to test the feasibility of conducting a more extensive study


Image attributions

Pencil by kaboompics CC-0

Two men and one woman in a photo by Rawpixel.com CC-0


29

7.2 Causal relationships

Learning Objectives

  • Define and provide an example of idiographic and nomothetic causal relationships
  • Describe the role of causality in quantitative research as compared to qualitative research
  • Identify, define, and describe each of the main criteria for nomothetic causal relationships
  • Describe the difference between and provide examples of independent, dependent, and control variables
  • Define hypothesis, be able to state a clear hypothesis, and discuss the respective roles of quantitative and qualitative research when it comes to hypotheses


Most social scientific studies attempt to provide some kind of causal explanation. A study on an intervention to prevent child abuse is trying to draw a connection between the intervention and changes in child abuse. Causality refers to the idea that one event, behavior, or belief will result in the occurrence of another, subsequent event, behavior, or belief. In other words, it is about cause and effect. It seems simple, but you may be surprised to learn there is more than one way to explain how one thing causes another. How can that be? How could there be many ways to understand causality?


white 3-d cartoon knocking over a row of dominoes

Think back to our chapter on paradigms, which were analytic lenses comprised of assumptions about the world. You’ll remember the positivist paradigm as the one that believes in objectivity and social constructionist paradigm as the one that believes in subjectivity. Both paradigms are correct, though incomplete, viewpoints on the social world and social science.

A researcher operating in the social constructionist paradigm would view truth as subjective. In causality, that means that in order to try to understand what caused what, we would need to report what people tell us. Well, that seems pretty straightforward, right? Well, what if two different people saw the same event from the exact same viewpoint and came up with two totally different explanations about what caused what? A social constructionist would say that both people are correct. There is not one singular truth that is true for everyone, but many truths created and shared by people.

When social constructionists engage in science, they are trying to establish one type of causality—idiographic causality. An idiographic causal explanation means that you will attempt to explain or describe your phenomenon exhaustively, based on the subjective understandings of your participants. These explanations are bound with the narratives people create about their lives and experience, and are embedded in a cultural, historical, and environmental context. Idiographic causal explanations are so powerful because they convey a deep understanding of a phenomenon and its context. From a social constructionist perspective, the truth is messy. Idiographic research involves finding patterns and themes in the causal relationships established by your research participants.

If that doesn’t sound like what you normally think of as “science,” you’re not alone. Although the ideas behind idiographic research are quite old in philosophy, they were only applied to the sciences at the start of the last century. If we think of famous scientists like Newton or Darwin, they never saw truth as subjective. There were objectively true laws of science that were applicable in all situations. Another paradigm was dominant and continues its dominance today, the positivist paradigm. When positivists try to establish causality, they are like Newton and Darwin, trying to come up with a broad, sweeping explanation that is universally true for all people. This is the hallmark of a nomothetic causal explanation.

Nomothetic causal explanations are also incredibly powerful. They allow scientists to make predictions about what will happen in the future, with a certain margin of error. Moreover, they allow scientists to generalize—that is, make claims about a large population based on a smaller sample of people or items. Generalizing is important. We clearly do not have time to ask everyone their opinion on a topic, nor do we have the ability to look at every interaction in the social world. We need a type of causal explanation that helps us predict and estimate truth in all situations.

If these still seem like obscure philosophy terms, let’s consider an example. Imagine you are working for a community-based non-profit agency serving people with disabilities. You are putting together a report to help lobby the state government for additional funding for community support programs, and you need to support your argument for additional funding at your agency. If you looked at nomothetic research, you might learn how previous studies have shown that, in general, community-based programs like yours are linked with better health and employment outcomes for people with disabilities. Nomothetic research seeks to explain that community-based programs are better for everyone with disabilities. If you looked at idiographic research, you would get stories and experiences of people in community-based programs. These individual stories are full of detail about the lived experience of being in a community-based program. Using idiographic research, you can understand what it’s like to be a person with a disability and then communicate that to the state government. For example, a person might say “I feel at home when I’m at this agency because they treat me like a family member” or “this is the agency that helped me get my first paycheck.”

Neither kind of causal explanation is better than the other. A decision to conduct idiographic research means that you will attempt to explain or describe your phenomenon exhaustively, attending to cultural context and subjective interpretations. A decision to conduct nomothetic research, on the other hand, means that you will try to explain what is true for everyone and predict what will be true in the future. In short, idiographic explanations have greater depth, and nomothetic explanations have greater breadth. More importantly, social workers understand the value of both approaches to understanding the social world. A social worker helping a client with substance abuse issues seeks idiographic knowledge when they ask about that client’s life story, investigate their unique physical environment, or probe how they understand their addiction. At the same time, a social worker also uses nomothetic knowledge to guide their interventions. Nomothetic research may help guide them to minimize risk factors and maximize protective factors or use an evidence-based therapy, relying on knowledge about what in general helps people with substance abuse issues.


cartoon woman pointing to a chart showing probabilities of weather

Nomothetic causal relationships

One of my favorite classroom moments occurred in the early moments of my teaching career. Students were providing peer feedback on research questions. I overheard one group who was helping someone rephrase their research question. A student asked, “Are you trying to generalize or nah?” Teaching is full of fun moments like that one.

Answering that one question can help you understand how to conceptualize and design your research project. If you are trying to generalize, or create a nomothetic causal relationship, then the rest of these statements are likely to be true: you will use quantitative methods, reason deductively, and engage in explanatory research. How can I know all of that? Let’s take it part by part.

Because nomothetic causal relationships try to generalize, they must be able to reduce phenomena to a universal language, mathematics. Mathematics allows us to precisely measure, in universal terms, phenomena in the social world. Not all quantitative studies are explanatory. For example, a descriptive study could reveal the number of people without homes in your county, though it won’t tell you why they are homeless. But nearly all explanatory studies are quantitative. Because explanatory researchers want a clean “x causes y” explanation, they need to use the universal language of mathematics to achieve their goal. That’s why nomothetic causal relationships use quantitative methods.

What we’ve been talking about here is relationships between variables. When one variable causes another, we have what researchers call independent and dependent variables. For our example on spanking and aggressive behavior, spanking would be the independent variable and aggressive behavior addiction would be the dependent variable. An independent variable is the cause, and a dependent variable is the effect. Why are they called that? Dependent variables depend on independent variables. If all of that gets confusing, just remember this graphical relationship:


The letters IV on the left with an arrow pointing towards DV
Figure 7.1 Visual representation of a nomothetic causal relationship

Relationship strength is another important factor to take into consideration when attempting to make causal claims when your research approach is nomothetic. I’m not talking strength of your friendships or marriage. In this context, relationship strength refers to statistical significance. The more statistically significant a relationship between two variables is shown to be, the greater confidence we can have in the strength of that relationship. You’ll remember from our discussion of statistical significance in Chapter 3, that it is usually represented in statistics as the p value.

A hypothesis is a statement describing a researcher’s expectation regarding what she anticipates finding. Hypotheses in quantitative research are a nomothetic causal relationship that the researcher expects to demonstrate. It is written to describe the expected relationship between the independent and dependent variables. Your prediction should be taken from a theory or model of the social world. For example, you may hypothesize that treating clinical clients with warmth and positive regard is likely to help them achieve their therapeutic goals. That hypothesis would be using the humanistic theories of Carl Rogers. Using previous theories to generate hypotheses is an example of deductive research. If Rogers’ theory of unconditional positive regard is accurate, your hypothesis should be true. This is how we know that all nomothetic causal relationships must use deductive reasoning.

Let’s consider a couple of examples. In research on sexual harassment (Uggen & Blackstone, 2004), Uggen, C., & Blackstone, A. (2004). Sexual harassment as a gendered expression of power. American Sociological Review, 69, 64–92. one might hypothesize, based on feminist theories of sexual harassment, that more females than males will experience specific sexually harassing behaviors. What is the causal relationship being predicted here? Which is the independent and which is the dependent variable? In this case, we hypothesized that a person’s gender (independent variable) would predict their likelihood to experience sexual harassment (dependent variable).

Sometimes researchers will hypothesize that a relationship will take a specific direction. As a result, an increase or decrease in one area might be said to cause an increase or decrease in another. For example, you might choose to study the relationship between age and support for legalization of marijuana. Perhaps you’ve taken a sociology class and, based on the theories you’ve read, you hypothesize that age is negatively related to support for marijuana legalization. In fact, there are empirical data that support this hypothesis. Gallup has conducted research on this very question since the 1960s. For more on their findings, see Carroll, J. (2005). Who supports marijuana legalization? Retrieved from http://www.gallup.com/poll/19561/who-supports-marijuana-legalization.aspx What have you just hypothesized? You have hypothesized that as people get older, the likelihood of their supporting marijuana legalization decreases. Thus, as age (your independent variable) moves in one direction (up), support for marijuana legalization (your dependent variable) moves in another direction (down). So, positive relationships involve two variables going in the same direction and negative relationships involve two variables going in opposite directions. If writing hypotheses feels tricky, it is sometimes helpful to draw them out and depict each of the two hypotheses we have just discussed.


sex (IV) on the left with an arrow point towards sexual harassment (DV)
Figure 7.2 Hypothesis describing the expected relationship between sex and sexual harassment
age increases as support for marijuana decreases, represented with an upward arrow with age and a downward arrow with support
Figure 7.3 Hypothesis describing the expected direction of relationship between age and support for marijuana legalization

Figures 7.2 and 7.3 were copied from Blackstone, A. (2012) Principles of sociological inquiry: Qualitative and quantitative methods. Saylor Foundation. Retrieved from: https://saylordotorg.github.io/text_principles-of-sociological-inquiry-qualitative-and-quantitative-methods/ Shared under CC-BY-NC-SA 3.0 License (https://creativecommons.org/licenses/by-nc-sa/3.0/)

It’s important to note that once a study starts, it is unethical to change your hypothesis to match the data that you found. For example, what happens if you conduct a study to test the hypothesis from Figure 7.3 on support for marijuana legalization, but you find no relationship between age and support for legalization? It means that your hypothesis was wrong, but that’s still valuable information. It would challenge what the existing literature says on your topic, demonstrating that more research needs to be done to figure out the factors that impact support for marijuana legalization. Don’t be embarrassed by negative results, and definitely don’t change your hypothesis to make it appear correct all along!

Let’s say you conduct your study and you find evidence that supports your hypothesis, as age increases, support for marijuana legalization decreases. Success! Causal explanation complete, right? Not quite. You’ve only established one of the criteria for causality. The main criteria for causality have to do with covariation, plausibility, temporality, and spuriousness. In our example from Figure 7.3, we have established only one criteria—covariation. When variables covary, they vary together. Both age and support for marijuana legalization vary in our study. Our sample contains people of varying ages and varying levels of support for marijuana legalization.

Just because there might be some correlation between two variables does not mean that a causal relationship between the two is really plausible. Plausibility means that in order to make the claim that one event, behavior, or belief causes another, the claim has to make sense. It makes sense that people from previous generations would have different attitudes towards marijuana than younger generations. People who grew up in the time of Reefer Madness or the hippies may hold different views than those raised in an era of legalized medicinal and recreational use of marijuana.

Once we’ve established that there is a plausible relationship between the two variables, we also need to establish whether the cause happened before the effect, the criterion of temporality. A person’s age is a quality that appears long before any opinions on drug policy, so temporally the cause comes before the effect. It wouldn’t make any sense to say that support for marijuana legalization makes a person’s age increase. Even if you could predict someone’s age based on their support for marijuana legalization, you couldn’t say someone’s age was caused by their support for legalization.

Finally, scientists must establish nonspuriousness. A spurious relationship is one in which an association between two variables appears to be causal but can in fact be explained by some third variable. For example, we could point to the fact that older cohorts are less likely to have used marijuana. Maybe it is actually use of marijuana that leads people to be more open to legalization, not their age. This is often referred to as the third variable problem, where a seemingly true causal relationship is actually caused by a third variable not in the hypothesis. In this example, the relationship between age and support for legalization could be more about having tried marijuana than the age of the person.

Quantitative researchers are sensitive to the effects of potentially spurious relationships. They are an important form of critique of scientific work. As a result, they will often measure these third variables in their study, so they can control for their effects. These are called control variables, and they refer to variables whose effects are controlled for mathematically in the data analysis process. Control variables can be a bit confusing, but think about it as an argument between you, the researcher, and a critic.

Researcher: “The older a person is, the less likely they are to support marijuana legalization.”

Critic: “Actually, it’s more about whether a person has used marijuana before. That is what truly determines whether someone supports marijuana legalization.”

Researcher: “Well, I measured previous marijuana use in my study and mathematically controlled for its effects in my analysis. The relationship between age and support for marijuana legalization is still statistically significant and is the most important relationship here.”

Let’s consider a few additional, real-world examples of spuriousness. Did you know, for example, that high rates of ice cream sales have been shown to cause drowning? Of course, that’s not really true, but there is a positive relationship between the two. In this case, the third variable that causes both high ice cream sales and increased deaths by drowning is time of year, as the summer season sees increases in both (Babbie, 2010). Babbie, E. (2010). The practice of social research (12th ed.). Belmont, CA: Wadsworth. Here’s another good one: it is true that as the salaries of Presbyterian ministers in Massachusetts rise, so too does the price of rum in Havana, Cuba. Well, duh, you might be saying to yourself. Everyone knows how much ministers in Massachusetts love their rum, right? Not so fast. Both salaries and rum prices have increased, true, but so has the price of just about everything else (Huff & Geis, 1993). Huff, D. & Geis, I. (1993). How to lie with statistics. New York, NY: W. W. Norton & Co. Finally, research shows that the more firefighters present at a fire, the more damage is done at the scene. What this statement leaves out, of course, is that as the size of a fire increases so too does the amount of damage caused as does the number of firefighters called on to help (Frankfort-Nachmias & Leon-Guerrero, 2011). Frankfort-Nachmias, C. & Leon-Guerrero, A. (2011). Social statistics for a diverse society. Washington, DC: Pine Forge Press. In each of these examples, it is the presence of a third variable that explains the apparent relationship between the two original variables.

In sum, the following criteria must be met for a correlation to be considered causal:

Once these criteria are met, a researcher can say they have achieved a nomothetic causal explanation, one that is objectively true. It’s a difficult challenge for researchers to meet. You will almost never hear researchers say that they have proven their hypotheses. A statement that bold implies that a relationship has been shown to exist with absolute certainty and that there is no chance that there are conditions under which the hypothesis would not be true. Instead, researchers tend to say that their hypotheses have been supported (or not). This more cautious way of discussing findings allows for the possibility that new evidence or new ways of examining a relationship will be discovered. Researchers may also discuss a null hypothesis. We covered in Chapter 3 that the null hypothesis is one that predicts no relationship between the variables being studied. If a researcher rejects the null hypothesis, she is saying that the variables in question are somehow related to one another.

Idiographic causal relationships

Remember our question, “Are you trying to generalize or nah?” If you answered no, you are trying to establish an idiographic causal relationship. I can guess that if you are trying to establish an idiographic causal relationship, you are likely going to use qualitative methods, reason inductively, and engage in exploratory or descriptive research. We can understand these assumptions by walking through them, one by one.

Researchers seeking idiographic causal relationships are not trying to generalize, so they have no need to reduce phenomena to mathematics. In fact, using the language of mathematics to reduce the social world down is a bad thing, as it robs the causal relationship of its meaning and context. Idiographic causal relationships are bound within people’s stories and interpretations. Usually, these are expressed through words. Not all qualitative studies use word data, as some can use interpretations of visual or performance art, though the vast majority of social science studies do use word data.


an woman speaking to a group of children in a room

But wait, I predicted that an idiographic causal relationship would use descriptive or exploratory research. How can we build causal relationships if we are just describing or exploring a topic? Wouldn’t we need to do explanatory research to build any kind of causal explanation? Explanatory research attempts to establish nomothetic causal relationships—an independent variable is demonstrated to cause changes a dependent variable. Exploratory and descriptive qualitative research contains some causal relationships, but they are actually descriptions of the causal relationships established by the participants in your study. Instead of saying “x causes y,” your participants will describe their experiences with “x,” which they will tell you was caused by and influenced a variety of other factors, depending on time, environment, and subjective experience. As we stated before, idiographic causal explanations are messy. Your job as a social science researcher is to accurately describe the patterns in what your participants tell you.

Let’s consider an example. If I asked you why you decided to become a social worker, what might you say? For me, I would say that I wanted to be a mental health clinician since I was in high school. I was interested in how people thought. At my second internship in my undergraduate program, I got the advice to become a social worker because the license provided greater authority for insurance reimbursement and flexibility for career change. That’s not a simple explanation at all! But it does provide a description of the deeper understanding of the many factors that led me to become a social worker. If we interviewed many social workers about their decisions to become social workers, we might begin to notice patterns. We might find out that many social workers begin their careers based on a variety of factors, such as: personal experience with a disability or social injustice, positive experiences with social workers, or a desire to help others. No one factor is the “most important factor,” like with nomothetic causal relationships. Instead, a complex web of factors, contingent on context, emerge in the dataset when you interpret what people have said.

Finding patterns in data, as you’ll remember from Chapter 6, is what inductive reasoning is all about. A researcher collects data, usually word data, and notices patterns. Those patterns inform the theories we use in social work. In many ways, the idiographic causal relationships you create in qualitative research are like the social theories we reviewed in Chapter 6 (e.g. social exchange theory) and other theories you use in your practice and theory courses. Theories are explanations about how different concepts are associated with each other how that network of relationships works in the real world. While you can think of theories like Systems Theory as Theory (with a capital “T”), inductive causal relationships are like theory with a small “t.” They may apply only to the participants, environment, and moment in time in which you gathered your data. Nevertheless, they contribute important information to the body of knowledge on the topic you studied.

Over time, as more qualitative studies are done and patterns emerge across different studies and locations, more sophisticated theories emerge that explain phenomena across multiple contexts. In this way, qualitative researchers use idiographic causal explanations for theory building or the creation of new theories based on inductive reasoning. Quantitative researchers, on the other hand, use nomothetic causal relationships for theory testing, wherein a hypothesis is created from existing theory (big T or small t) and tested mathematically (i.e., deductive reasoning).

If you plan to study domestic and sexual violence, you will likely encounter the Power and Control Wheel. [6] The wheel is a model of how power and control operate in relationships with physical violence. The wheel was developed based on qualitative focus groups conducted by sexual and domestic violence advocates in Duluth, MN. While advocates likely had some tentative hypotheses about what was important in a relationship with domestic violence, participants in these focus groups provided the information that became the Power and Control Wheel. As qualitative inquiry like this one unfolds, hypotheses get more specific and clear, as researchers learn from what their participants share.

Once a theory is developed from qualitative data, a quantitative researcher can seek to test that theory. For example, a quantitative researcher may hypothesize that men who hold traditional gender roles are more likely to engage in domestic violence. That would make sense based on the Power and Control Wheel model, as the category of “using male privilege” speaks to this relationship. In this way, qualitatively-derived theory can inspire a hypothesis for a quantitative research project.

Unlike nomothetic causal relationships, there are no formal criteria (e.g., covariation) for establishing causality in idiographic causal relationships. In fact, some criteria like temporality and nonspuriousness may be violated. For example, if an adolescent client says, “It’s hard for me to tell whether my depression began before my drinking, but both got worse when I was expelled from my first high school,” they are recognizing that oftentimes it’s not so simple that one thing causes another. Sometimes, there is a reciprocal relationship where one variable (depression) impacts another (alcohol abuse), which then feeds back into the first variable (depression) and also into other variables (school). Other criteria, such as covariation and plausibility still make sense, as the relationships you highlight as part of your idiographic causal explanation should still be plausibly true and it elements should vary together.

Similarly, idiographic causal explanations differ in terms of hypotheses. If you recall from the last section, hypotheses in nomothetic causal explanations are testable predictions based on previous theory. In idiographic research, a researcher likely has hypotheses, but they are more tentative. Instead of predicting that “x will decrease y,” researchers will use previous literature to figure out what concepts might be important to participants and how they believe participants might respond during the study. Based on an analysis of the literature a researcher may formulate a few tentative hypotheses about what they expect to find in their qualitative study. Unlike nomothetic hypotheses, these are likely to change during the research process. As the researcher learns more from their participants, they might introduce new concepts that participants talk about. Because the participants are the experts in idiographic causal relationships, a researcher should be open to emerging topics and shift their research questions and hypotheses accordingly.

Two different baskets

Idiographic and nomothetic causal explanations form the “two baskets” of research design elements pictured in Figure 7.4 below. Later on, they will also determine the sampling approach, measures, and data analysis in your study.


two baskets of research, one with idiographic research and another with nomothetic research and their comopnents
Figure 7.4: Two baskets (or approaches) to research

In most cases, mixing components from one basket with the other would not make sense. If you are using quantitative methods with an idiographic question, you wouldn’t get the deep understanding you need to answer an idiographic question. Knowing, for example, that someone scores 20/35 on a numerical index of depression symptoms does not tell you what depression means to that person. Similarly, qualitative methods are not often used to deductive reasoning because qualitative methods usually seek to understand a participant’s perspective, rather than test what existing theory says about a concept.

However, these are not hard-and-fast rules. There are plenty of qualitative studies that attempt to test a theory. There are fewer social constructionist studies with quantitative methods, though studies will sometimes include quantitative information about participants. Researchers in the critical paradigm can fit into either bucket, depending on their research question, as they focus on the liberation of people from oppressive internal (subjective) or external (objective) forces.

We will explore later on in this chapter how researchers can use both buckets simultaneously in mixed methods research. For now, it’s important that you understand the logic that connects the ideas in each bucket. Not only is this fundamental to how knowledge is created and tested in social work, it speaks to the very assumptions and foundations upon which all theories of the social world are built!


Key Takeaways

  • Idiographic research focuses on subjectivity, context, and meaning.
  • Nomothetic research focuses on objectivity, prediction, and generalizing.
  • In qualitative studies, the goal is generally to understand the multitude of causes that account for the specific instance the researcher is investigating.
  • In quantitative studies, the goal may be to understand the more general causes of some phenomenon rather than the idiosyncrasies of one particular instance.
  • For nomothetic causal relationships, a relationship must be plausible and nonspurious, and the cause must precede the effect in time.
  • In a nomothetic causal relationship, the independent variable causes changes in a dependent variable.
  • Hypotheses are statements, drawn from theory, which describe a researcher’s expectation about a relationship between two or more variables.
  • Qualitative research may create theories that can be tested quantitatively.
  • The choice of idiographic or nomothetic causal relationships requires a consideration of methods, paradigm, and reasoning.
  • Depending on whether you seek a nomothetic or idiographic causal explanation, you are likely to employ specific research design components.


Glossary

  • Causality-the idea that one event, behavior, or belief will result in the occurrence of another, subsequent event, behavior, or belief
  • Control variables- potential “third variables” effects are controlled for mathematically in the data analysis process to highlight the relationship between the independent and dependent variable
  • Covariation- the degree to which two variables vary together
  • Dependent variable- a variable that depends on changes in the independent variable
  • Generalize- to make claims about a larger population based on an examination of a smaller sample
  • Hypothesis- a statement describing a researcher’s expectation regarding what she anticipates finding
  • Idiographic research- attempts to explain or describe your phenomenon exhaustively, based on the subjective understandings of your participants
  • Independent variable- causes a change in the dependent variable
  • Nomothetic research- provides a more general, sweeping explanation that is universally true for all people
  • Plausibility- in order to make the claim that one event, behavior, or belief causes another, the claim has to make sense
  • Spurious relationship- an association between two variables appears to be causal but can in fact be explained by some third variable
  • Statistical significance- confidence researchers have in a mathematical relationship
  • Temporality- whatever cause you identify must happen before the effect
  • Theory building- the creation of new theories based on inductive reasoning
  • Theory testing- when a hypothesis is created from existing theory and tested mathematically


Image attributions

Mikado by 3dman_eu CC-0

Weather TV Forecast by mohamed_hassan CC-0

Beatrice Birra Storytelling at African Art Museum by Anthony Cross public domain


30

7.3 Unit of analysis and unit of observation

Learning Objectives

  • Define units of analysis and units of observation, and describe the two common errors people make when they confuse the two


Another point to consider when designing a research project, and which might differ slightly in qualitative and quantitative studies, has to do with units of analysis and units of observation. These two items concern what you, the researcher, actually observe in the course of your data collection and what you hope to be able to say about those observations. A unit of analysis is the entity that you wish to be able to say something about at the end of your study, probably what you’d consider to be the main focus of your study. A unit of observation is the item (or items) that you actually observe, measure, or collect in the course of trying to learn something about your unit of analysis.

In a given study, the unit of observation might be the same as the unit of analysis, but that is not always the case. For example, a study on electronic gadget addiction may interview undergraduate students (our unit of observation) for the purpose of saying something about undergraduate students (our unit of analysis) and their gadget addiction. Perhaps, if we were investigating gadget addiction in elementary school children (our unit of analysis), we might collect observations from teachers and parents (our units of observation) because younger children may not report their behavior accurately. In this case and many others, units of analysis are not the same as units of observation. What is required, however, is for researchers to be clear about how they define their units of analysis and observation, both to themselves and to their audiences.


young boy peering through binoculars in a desert

More specifically, your unit of analysis will be determined by your research question. Your unit of observation, on the other hand, is determined largely by the method of data collection that you use to answer that research question. We’ll take a closer look at methods of data collection later on in the textbook. For now, let’s consider again a study addressing students’ addictions to electronic gadgets. We’ll consider first how different kinds of research questions about this topic will yield different units of analysis. Then, we’ll think about how those questions might be answered and with what kinds of data. This leads us to a variety of units of observation.

If we were to explore which students are most likely to be addicted to their electronic gadgets, our unit of analysis would be individual students. We might mail a survey to students on campus, and our aim would be to classify individuals according to their membership in certain social groups in order to see how membership in those classes correlated with gadget addiction. For example, we might find that majors in new media, men, and students with high socioeconomic status are all more likely than other students to become addicted to their electronic gadgets. Another possibility would be to explore how students’ gadget addictions differ and how are they similar. In this case, we could conduct observations of addicted students and record when, where, why, and how they use their gadgets. In both cases, one using a survey and the other using observations, data are collected from individual students. Thus, the unit of observation in both examples is the individual.

Another common unit of analysis in social science inquiry is groups. Groups of course vary in size, and almost no group is too small or too large to be of interest to social scientists. Families, friendship groups, and group therapy participants are some common examples of micro-level groups examined by social scientists. Employees in an organization, professionals in a particular domain (e.g., chefs, lawyers, social workers), and members of clubs (e.g., Girl Scouts, Rotary, Red Hat Society) are all meso-level groups that social scientists might study. Finally, at the macro-level, social scientists sometimes examine citizens of entire nations or residents of different continents or other regions.

A study of student addictions to their electronic gadgets at the group level might consider whether certain types of social clubs have more or fewer gadget-addicted members than other sorts of clubs. Perhaps we would find that clubs that emphasize physical fitness, such as the rugby club and the scuba club, have fewer gadget-addicted members than clubs that emphasize cerebral activity, such as the chess club and the women’s studies club. Our unit of analysis in this example is groups because groups are what we hope to say something about. If we had instead asked whether individuals who join cerebral clubs are more likely to be gadget-addicted than those who join social clubs, then our unit of analysis would have been individuals. In either case, however, our unit of observation would be individuals.

Organizations are yet another potential unit of analysis that social scientists might wish to say something about. Organizations include entities like corporations, colleges and universities, and even nightclubs. At the organization level, a study of students’ electronic gadget addictions might explore how different colleges address the problem of electronic gadget addiction. In this case, our interest lies not in the experience of individual students but instead in the campus-to-campus differences in confronting gadget addictions. A researcher conducting a study of this type might examine schools’ written policies and procedures, so her unit of observation would be documents. However, because she ultimately wishes to describe differences across campuses, the college would be her unit of analysis.

In sum, there are many potential units of analysis that a social worker might examine, but some of the most common units include the following:

Table 7.1 Units of analysis and units of observation: An example using a hypothetical study of students’ addictions to electronic gadgets
Research question Unit of analysis Data collection Unit of observation Statement of findings
Which students are most likely to be addicted to their electronic gadgets? Individuals Survey of students on campus Individuals New Media majors, men, and students with high socioeconomic status are all more likely than other students to become addicted to their electronic gadgets.
Do certain types of social clubs have more gadget-addicted members than other sorts of clubs? Groups Survey of students on campus Individuals Clubs with a scholarly focus, such as social work club and the math club, have more gadget-addicted members than clubs with a social focus, such as the 100-bottles-of- beer-on-the-wall club and the knitting club.
How do different colleges address the problem of electronic gadget addiction? Organizations Content analysis of policies Documents Campuses without strong computer science programs are more likely than those with such programs to expel students who have been found to have addictions to their electronic gadgets.
Note: Please remember that the findings described here are hypothetical. There is no reason to think that any of the hypothetical findings described here would actually bear out if tested with empirical research.

One common error people make when it comes to both causality and units of analysis is something called the ecological fallacy. This occurs when claims about one lower-level unit of analysis are made based on data from some higher-level unit of analysis. In many cases, this occurs when claims are made about individuals, but only group-level data have been gathered. For example, we might want to understand whether electronic gadget addictions are more common on certain campuses than on others. Perhaps different campuses around the country have provided us with their campus percentage of gadget-addicted students, and we learn from these data that electronic gadget addictions are more common on campuses that have business programs than on campuses without them. We then conclude that business students are more likely than non-business students to become addicted to their electronic gadgets. However, this would be an inappropriate conclusion to draw. Because we only have addiction rates by campus, we can only draw conclusions about campuses, not about the individual students on those campuses. Perhaps the social work majors on the business campuses are the ones that caused the addiction rates on those campuses to be so high. The point is we simply don’t know because we only have campus-level data. By drawing conclusions about students when our data are about campuses, we run the risk of committing the ecological fallacy.

On the other hand, another mistake to be aware of is reductionism. Reductionism occurs when claims about some higher-level unit of analysis are made based on data from some lower-level unit of analysis. In this case, claims about groups or macro-level phenomena are made based on individual-level data. An example of reductionism can be seen in some descriptions of the civil rights movement. On occasion, people have proclaimed that Rosa Parks started the civil rights movement in the United States by refusing to give up her seat to a white person while on a city bus in Montgomery, Alabama, in December 1955. Although it is true that Parks played an invaluable role in the movement, and that her act of civil disobedience gave others courage to stand up against racist policies, beliefs, and actions, to credit Parks with starting the movement is reductionist. Surely the confluence of many factors, from fights over legalized racial segregation to the Supreme Court’s historic decision to desegregate schools in 1954 to the creation of groups such as the Student Nonviolent Coordinating Committee (to name just a few), contributed to the rise and success of the American civil rights movement. In other words, the movement is attributable to many factors—some social, others political and others economic. Did Parks play a role? Of course she did—and a very important one at that. But did she cause the movement? To say yes would be reductionist.

It would be a mistake to conclude from the preceding discussion that researchers should avoid making any claims whatsoever about data or about relationships between levels of analysis. While it is important to be attentive to the possibility for error in causal reasoning about different levels of analysis, this warning should not prevent you from drawing well-reasoned analytic conclusions from your data. The point is to be cautious and conscientious in making conclusions between levels of analysis. Errors in analysis come from a lack of rigor and deviating from the scientific method.


Key Takeaways

  • A unit of analysis is the item you wish to be able to say something about at the end of your study while a unit of observation is the item that you actually observe.
  • When researchers confuse their units of analysis and observation, they may be prone to committing either the ecological fallacy or reductionism.


Glossary

  • Ecological fallacy- claims about one lower-level unit of analysis are made based on data from some higher-level unit of analysis
  • Reductionism- when claims about some higher-level unit of analysis are made based on data at some lower-level unit of analysis
  • Unit of analysis- entity that a researcher wants to say something about at the end of her study
  • Unit of observation- the item that a researcher actually observes, measures, or collects in the course of trying to learn something about her unit of analysis


Image attributions

Binoculars by nightowl CC-0


31

7.4 Mixed Methods

Learning Objectives

  • Define sequence and emphasis and describe how they work in qualitative research
  • List the five reasons why researchers use mixed methods


So far in this textbook, we have talked about quantitative and qualitative methods as an either/or choice—you can choose quantitative methods or qualitative methods. However, researchers often use both methods inside of their research projects. For example, I recently completed a study with the people who administer state-level services for people with intellectual and developmental disabilities on a program they implemented called self-direction, which allows people with disabilities greater self-determination over their supports. In this study, my research partners and I used a mixed methods approach to understand the implementation of the program. The goal of our project was to describe the implementation of self-direction across the United States. We distributed a short, written survey and also conducted phone interviews with program administrators. While we could have just sent out a questionnaire that asked states to provide basic information on their program (size, qualifications, services offered, etc.), that would not provide us much information about some of the issues administrators faced during implementation of the program. Similarly, we could have interviewed program administrators without the questionnaire, but then we wouldn’t know enough about the programs to ask good questions. Instead, we chose to use both qualitative and quantitative methods.


three hands, holding up one finger, two fingers, then three fingers

Sequence and emphasis

There are many different mixed methods designs, each with their own strengths. However, a more simplified synthesis of mixed methods approaches is provided by Engel and Schutt (2016) Rubin, C. & Babbie, S. (2017). Research methods for social work (9th edition). Boston, MA: Cengage. using two key terms. Sequence refers to the order that each method is used. Researchers can use both methods at the same time or concurrently. Or, they can use one and then the other, or sequentially. For our study of self-direction, we used a sequential design by sending out a questionnaire first, conducing some analysis, and then conducting the interview. We used the quantitative questionnaire to gather basic information about the programs before we began the interviews, so our questions were specific to the features of each program. If we wanted to use a concurrent design for some reason, we could have asked quantitative questions during the interview. However, we felt this would waste the administrators’ time and would break up the conversation and rhythm of the interviews.

The other key term in mixed methods research is emphasis. In our mixed methods study, the qualitative data was the most important data. The quantitative data was mainly used to provide background information for the qualitative interviews, and our write up of the study focused mostly on the qualitative information. Thus, qualitative methods were prioritized in our study. Many times, however, quantitative methods are emphasized. In these studies, qualitative data is used mainly to provide context for the quantitative findings. For example, demonstrating quantitatively that a particular therapy works is important. By adding a qualitative component, researchers could find out how the participants experienced the intervention, how they understood its effects, and the meaning it had on their lives. This data would add depth and context to the findings of the study and allow researchers to improve the therapeutic technique in the future.

A similar practice is when researchers use qualitative methods to solicit feedback on a quantitative scale or measure. The experiences of individuals allow researchers to refine the measure before they do the quantitative component of their study. Finally, it is possible that researchers are equally interested in qualitative and quantitative information. In studies of equal emphasis, researchers consider both methods as the focus of the research project.

Why researchers use mixed methods

Mixed methods research is more than just sticking an open-ended question at the end of a quantitative survey. Mixed methods researchers use mixed methods for both pragmatic and synergistic reasons. That is, they use both methods because it makes sense with their research questions and because they will get the answers they want by combining the two approaches.

Mixed methods also allows you to use both inductive and deductive reasoning. As we’ve discussed, qualitative research follows inductive logic, moving from data to empirical generalizations or theory. In a mixed methods study, a researcher could use the results from a qualitative component to inform a subsequent quantitative component. The quantitative component would use deductive logic, using the theory derived from qualitative data to create and test a hypothesis. In this way, mixed methods use the strengths of both research methods, using each method to understand different parts of the same phenomenon. Quantitative allows the researcher to test new ideas. Qualitative allows the researcher to create new ideas.

With these two concepts in mind, we can start to see why researchers use mixed methods in the real world. I mentioned previously that our research project used a sequential design because we wanted to use our quantitative data to shape what qualitative questions we asked our participants. Mixed methods are often used this way, to initiate ideas with one method to study with another. For example, researchers could begin a mixed methods project by using qualitative methods to interview or conduct a focus group with participants. Based on their responses, the researchers could then formulate a quantitative project to follow up on the results. This is the inverse of what we did in our project, which was use a quantitative survey to inform a more detailed qualitative interview.

In addition to providing information for subsequent investigation, using both quantitative and qualitative information provides additional context for the data. For example, in our questionnaire for the study on self-direction, we asked participants to list what services people could purchase. The qualitative data followed up on that answer by asking whether the administrators had added or taken away any services, how they decided that these services would be covered and not others, and problems that arose around providing these services. With that information, we could analyze what services were offered, why they were offered, and how administrators made those decisions. In this way, we learned the lived experience of program administrators, not just the basic information about their programs.

Finally, another purpose of mixed methods research is corroborating data from both quantitative and qualitative sources. Ideally, your qualitative and quantitative results should support each other. For example, if interviews with participants showed a relationship between two concepts, that relationship should also be present in the qualitative data you collected. Differences between quantitative and qualitative data require an explanation. Perhaps there are outliers or extreme cases that pushed your data in one direction or another, for example.

In summary, these are a few of the many reasons researchers use mixed methods. They are summarized below:

  1. Triangulation or convergence on the same phenomenon to improve validity
  2. Complementarity, which aims to get at related but different facets of a phenomenon
  3. Development or the use of results from one phase or a study to develop another phase
  4. Initiation or the intentional analysis of inconsistent qualitative and quantitative findings to derive new insights
  5. Expansion or using multiple components to extend the scope of a study (Burnett, 2012, p. 77). Burnett, D. (2012). Inscribing knowledge: Writing research in social work. In W. Green & B. L. Simon (Eds.), The Columbia guide to social work writing (pp. 65-82). New York, NY: Columbia University Press.


yellow sign reading caution

A word of caution

The use of mixed methods has many advantages. However, undergraduate researchers should approach mixed methods with caution. Conducting a mixed methods study may mean doubling or even tripling your work. You must conceptualize how to use one method, another method, and how they fit together. This may mean operationalizing and creating a questionnaire, then writing an interview guide, and thinking through how the data on each measure relate to one another—more work than using one quantitative or qualitative method alone. Similarly, in sequential studies, the researcher must collect and analyze data from one component and then conceptualize and conduct the second component. This may also impact how long a project may take. Before beginning a mixed methods project, you should have a clear vision for what the project will entail and how each methodology will contribute to that vision.


Key Takeaways

  • Mixed methods studies vary in sequence and emphasis.
  • Mixed methods allow the research to corroborate findings, provide context, follow up on ideas, and use the strengths of each method.


Glossary

  • Emphasis- in a mixed methods study, refers to the priority that each method is given
  • Sequence- in a mixed methods study, refers to the order that each method is used, either concurrently or sequentially


Image attributions

one two three/ un deux trois by Improulx CC-0

caution by geralt CC-0


VIII

8. Creating and refining a research question

32

8.0 Chapter introduction

Creating a research question is an iterative process, one version after another. In the preceding chapters, you started with an initial question and refined it as you learned more about the topic you’re studying. In this chapter, you will finalize your research question, making sure that is it empirical, correctly structured, and feasible to answer. Once this process is completed, you’ll be ready to start answering your question.

Chapter Outline

Content Advisory

This chapter discusses or mentions the following topics: suicide and depression, heterosexism, sexual assault, homelessness, foster care, the criminal justice system, and self-harm.

33

8.1 Empirical versus ethical questions

Learning Objectives

  • Define empirical questions and provide an example
  • Define ethical questions and provide an example


When it comes to research questions, social workers are best equipped to answer empirical questions—those that can be answered by real experience in the real world—as opposed to ethical questions—questions about which people have moral opinions and that may not be answerable in reference to the real world. While social workers have explicit ethical obligations (e.g., service, social justice), research projects ask empirical questions that help support those ethical principles.

For example, I had a student group who wanted to research the penalties for sexual assault. Their original research question was: “How can prison sentences for sexual assault be so much lower than the penalty for drug possession?” Outside of the research context, that is a darn good question! It speaks to how the War on Drugs and the patriarchy have distorted the criminal justice system towards policing of drug crimes over violent crimes. Unfortunately, it is an ethical question, not an empirical one. How could you answer that question by gathering data about people in the real world? What would an answer to that question even look like?

As the students worked on the project through the semester, they continued to focus on the topic of sexual assault in the criminal justice system. Their research question became more empirical because they read more empirical articles about their topic. One option that they considered was to evaluate intervention programs for perpetrators of sexual assault to see if they reduced the likelihood of committing sexual assault again. Another option they considered was seeing if counties or states with higher than average jail sentences for sexual assault perpetrators had lower rates of re-offense for sexual assault. These projects addressed the ethical question of punishing perpetrators of sexual violence but did so in a way that gathered and analyzed real-world information. Our job as social work researchers is to gather social facts about social work issues, not to judge or determine morality.


a picture of spongebob squarepants figurine

In order to help you better understand the difference between ethical and empirical questions, let’s consider a topic about which people have moral opinions. How about SpongeBob SquarePants? Not familiar with SpongeBob SquarePants? You can learn more about him on Nickelodeon’s site dedicated to all things SpongeBob: http://www.nick.com/spongebob-squarepants/ In early 2005, members of the conservative Christian group Focus on the Family (2005) Focus on the Family. (2005, January 26). Focus on SpongeBob. Christianity Today. Retrieved from http://www.christianitytoday.com/ct/2005/januaryweb-only/34.0c.html denounced this seemingly innocuous cartoon character as “morally offensive” because they perceived his character to be one that promotes a “pro-gay agenda.” Focus on the Family supported their claim that SpongeBob is immoral by citing his appearance in a children’s video designed to promote tolerance of all family forms (BBC News, 2005). BBC News. (2005, January 20). US right attacks SpongeBob video. Retrieved from: http://news.bbc.co.uk/2/hi/americas/4190699.stm They also cited SpongeBob’s regular hand-holding with his male sidekick Patrick as further evidence of his immorality.

So, can we now conclude that SpongeBob SquarePants is immoral? Not so fast. While your mother or a newspaper or television reporter may provide an answer, a social science researcher cannot. Questions of morality are ethical, not empirical. Of course, this doesn’t mean that social work researchers cannot study opinions about or social meanings surrounding SpongeBob SquarePants (Carter, 2010). In fact, an MA thesis examines representations of gender and relationships in the cartoon: Carter, A. C. (2010). Constructing gender and relationships in “SpongeBob SquarePants”: Who lives in a pineapple under the sea. MA thesis, Department of Communication, University of South Alabama, Mobile, AL. We study humans after all, and as you will discover in the following chapters of this textbook, we are trained to utilize a variety of scientific data-collection techniques to understand patterns of human beliefs and behaviors. Using these techniques, we could find out how many people in the United States find SpongeBob morally reprehensible, but we could never learn, empirically, whether SpongeBob is in fact morally reprehensible.


Key Takeaways

  • Empirical questions are distinct from ethical questions.
  • There are usually a number of ethical questions and a number of empirical questions that could be asked about any single topic.
  • While social workers may study topics about which people have moral opinions, their job is to gather empirical data that guides action on behalf of clients.


Glossary

  • Empirical questions- questions that can be answered by observing experiences in the real world
  • Ethical questions- questions that ask about general moral opinions about a topic and cannot be answered through science


Image attributions

Spongebob by InspiredImages CC-0


34

8.2 Writing a good research question

Learning Objectives

  • Identify and explain the seven key features of a good research question
  • Explain why it is important for social workers to be focused when creating a research question


Now that you’ve thought about what topics interest you and identified a topic that asks an empirical question about a target population, you need to form a research question about that topic. So, what makes a good research question? First, it is generally written in the form of a question. To say that your research question is “the opiate epidemic” or “animal assisted therapy” or “oppression” would not be correct. You need to frame your topic as a question, not a statement. A good research question is also one that is well-focused. A well-focused question helps you tune out irrelevant information and not try to answer everything about the world all at once. You could be the most eloquent writer in your class, or even in the world, but if the research question about which you are writing is unclear, your work will ultimately fall flat.

In addition to being written in the form of a question and being well-focused, a good research question is one that cannot be answered with a simple yes or no. For example, if your interest is in gender norms, you could ask, “Does gender affect a person’s performance of household tasks?” but you will have nothing left to say once you discover your yes or no answer. Instead, why not ask, about the relationship between gender and household tasks. Alternatively, maybe we are interested in how or to what extent gender affects a person’s contributions to housework in a marriage? By tweaking your question in this small way, you suddenly have a much more fascinating question and more to say as you attempt to answer it.


a human head in silhouette with questions populating the inside of the head

A good research question should also have more than one plausible answer. The student who studied the relationship between gender and household tasks had a specific interest in the impact of gender, but she also knew that preferences might be impacted by other factors. For example, she knew from her own experience that her more traditional and socially conservative friends were more likely to see household tasks as part of the female domain and were less likely to expect their male partners to contribute to those tasks. Thinking through the possible relationships between gender, culture, and household tasks led that student to realize that there were many plausible answers to her questions about how gender affects a person’s contribution to household tasks. Because gender doesn’t exist in a vacuum, she wisely felt that she needed to consider other characteristics that work together with gender to shape people’s behaviors, likes, and dislikes. By doing this, the student considered the third feature of a good research question–she thought about relationships between several concepts. While she began with an interest in a single concept—household tasks—by asking herself what other concepts (such as gender or political orientation) might be related to her original interest, she was able to form a question that considered the relationships among those concepts.

This student had one final component to consider. Social work research questions must contain a target population. Her study would be very different if she were to conduct it on older adults or newly arrived immigrants. The target population is the group of people whose needs your study addresses. If the student noticed issues with household tasks as part of her work with first-generation immigrants, perhaps that would be her target population. Maybe she wants to address the needs of a community of older adults. Whatever the case, the target population should be chosen while keeping in mind social work’s responsibility to work on behalf of marginalized and oppressed groups.

In sum, a good research question generally has the following features:


Key Takeaways

  • A poorly focused research question can lead to the demise of an otherwise well-executed study.
  • Research questions should address the needs of a target population.


Glossary

  • Target population- group of people whose needs your study addresses


Image attributions

Question by johnhain CC-0


35

8.3 Quantitative research questions

Learning Objectives

  • Describe how research questions for exploratory, descriptive, and explanatory quantitative questions differ and how to phrase them
  • Identify the differences between and provide examples of strong and weak explanatory research questions


Quantitative descriptive questions

The type of research you are conducting will impact the research question that you ask. Probably the easiest questions to think of are quantitative descriptive questions. For example, “What is the average student debt load of MSW students?” is a descriptive question—and an important one. We aren’t trying to build a causal relationship here. We’re simply trying to describe how much debt MSW students carry. Quantitative descriptive questions like this one are helpful in social work practice as part of community scans, in which human service agencies survey the various needs of the community they serve. If the scan reveals that the community requires more services related to housing, child care, or day treatment for people with disabilities, a nonprofit office can use the community scan to create new programs that meet a defined community need.


an illuminated street sign that reads "ask"

Quantitative descriptive questions will often ask for percentage, count the number of instances of a phenomenon, or determine an average. Descriptive questions may only include one variable, such as ours about debt load, or they may include multiple variables. Because these are descriptive questions, we cannot investigate causal relationships between variables. To do that, we need to use a quantitative explanatory question.

Quantitative explanatory questions

Most studies you read in the academic literature will be quantitative and explanatory. Why is that? If you recall from Chapter 7, explanatory research tries to build nomothetic causal relationships. They are generalizable across space and time, so they are applicable to a wide audience. The editorial board of a journal wants to make sure their content will be useful to as many people as possible, so it’s not surprising that quantitative research dominates the academic literature.

Structurally, quantitative explanatory questions must contain an independent variable and dependent variable. Questions should ask about the relationship between these variables. My standard format for an explanatory quantitative research question is: “What is the relationship between [independent variable] and [dependent variable] for [target population]?” You should play with the wording for your research question, revising it as you see fit. The goal is to make the research question reflect what you really want to know in your study.

Let’s take a look at a few more examples of possible research questions and consider the relative strengths and weaknesses of each. Table 8.1 does just that. While reading the table, keep in mind that I have only noted what I view to be the most relevant strengths and weaknesses of each question. Certainly each question may have additional strengths and weaknesses not noted in the table.

Table 8.1 Sample research questions: Strengths and weaknesses
Sample question Question’s strengths Question’s weaknesses Proposed alternative
What are the internal and external effects/problems associated with children witnessing domestic violence? Written as a question Not clearly focused How does witnessing domestic violence impact a child’s romantic relationships in adulthood?
Considers relationships among multiple concepts Not specific and clear about the concepts it addresses
Contains a population
What causes foster children who are transitioning to adulthood to become homeless, jobless, pregnant, unhealthy, etc.? Considers relationships among multiple concepts Concepts are not specific and clear What is the relationship between sexual orientation or gender identity and homelessness for late adolescents in foster care?
Contains a population
Not written as a yes/no question
How does income inequality predict ambivalence in the Stereo Content Model using major U.S. cities as target populations? Written as a question Unclear wording How does income inequality affect ambivalence in high-density urban areas?
Considers relationships among multiple concepts Population is unclear
Why are mental health rates higher in white foster children then African Americans and other races? Written as a question Concepts are not clear How does race impact rates of mental health diagnosis for children in foster care?
Not written as a yes/no question Does not contain a target population

Making it more specific

A good research question should also be specific and clear about the concepts it addresses. A student investigating gender and household tasks knows what they mean by “household tasks.” You likely also have an impression of what “household tasks” means. But are your definition and the student’s definition the same? A participant in their study may think that managing finances and performing home maintenance are household tasks, but the researcher may be interested in other tasks like childcare or cleaning. The only way to ensure your study stays focused and clear is to be specific about what you mean by a concept. The student in our example could pick a specific household task that was interesting to them or that the literature indicated was important—for example, childcare. Or, the student could have a broader view of household tasks, one that encompasses childcare, food preparation, financial management, home repair, and care for relatives. Any option is probably okay, as long as the researcher is clear on what they mean by “household tasks.”

Table 8.2 contains some “watch words” that indicate you may need to be more specific about the concepts in your research question.

Table 8.2 “Watch words”
Watch words How to get more specific
Factors, Causes, Effects, Outcomes What causes or effects are you interested in? What causes and effects are important, based on the literature in your topic area? Try to choose one or a handful that you consider to be the most important.
Effective, Effectiveness, Useful, Efficient Effective at doing what? Effectiveness is meaningless on its own. What outcome should the program or intervention have? Reduced symptoms of a mental health issue? Better socialization?
Etc., and so forth Get more specific. You need to know enough about your topic to clearly address the concepts within it. Don’t assume that your reader understands what you mean by “and so forth.”

It can be challenging in social work research to be this specific, particularly when you are just starting out your investigation of the topic. If you’ve only read one or two articles on the topic, it can be hard to know what you are interested in studying. Broad questions like “What are the causes of chronic homelessness, and what can be done to prevent it?” are common at the beginning stages of a research project. However, social work research demands that you examine the literature on the topic and refine your question over time to be more specific and clear before you begin your study. Perhaps you want to study the effect of a specific anti-homelessness program that you found in the literature. Maybe there is a particular model to fighting homelessness, like Housing First or transitional housing that you want to investigate further. You may want to focus on a potential cause of homelessness such as LGBTQ discrimination that you find interesting or relevant to your practice. As you can see, the possibilities for making your question more specific are almost infinite.

Quantitative exploratory questions

In exploratory research, the researcher doesn’t quite know the lay of the land yet. If someone is proposing to conduct an exploratory quantitative project, the watch words highlighted in Table 8.2 are not problematic at all. In fact, questions such as “What factors influence the removal of children in child welfare cases?” are good because they will explore a variety of factors or causes. In this question, the independent variable is less clearly written, but the dependent variable, family preservation outcomes, is quite clearly written. The inverse can also be true. If we were to ask, “What outcomes are associated with family preservation services in child welfare?”, we would have a clear independent variable, family preservation services, but an unclear dependent variable, outcomes. Because we are only conducting exploratory research on a topic, we may not have an idea of what concepts may comprise our “outcomes” or “factors.” Only after interacting with our participants will we be able to understand which concepts are important.


Key Takeaways

  • Quantitative descriptive questions are helpful for community scans but cannot investigate causal relationships between variables.
  • Quantitative explanatory questions must include an independent and dependent variable.


Image attributions

Ask by terimakasih0 CC-0


36

8.4 Qualitative research questions

Learning Objectives

  • List the key terms associated with qualitative research questions
  • Distinguish between qualitative and quantitative research questions


Qualitative research questions differ from quantitative research questions. Because qualitative research questions seek to explore or describe phenomena, not provide a neat nomothetic explanation, they are often more general and vaguely worded. They may include only one concept, though many include more than one. Instead of asking how one variable causes changes in another, we are instead trying to understand the experiences, understandings, and meanings that people have about the concepts in our research question.

Let’s work through an example from our last section. In Table 8.1, a student asked, “What is the relationship between sexual orientation or gender identity and homelessness for late adolescents in foster care?” In this question, it is pretty clear that the student believes that adolescents in foster care who identify as LGBTQ may be at greater risk for homelessness. This is a nomothetic causal relationship—LGBTQ status causes homelessness.


two people thinking about each other with the word empathy above

However, what if the student were less interested in predicting homelessness based on LGBTQ status and more interested in understanding the stories of foster care youth who identify as LGBTQ and may be at risk for homelessness? In that case, the researcher would be building an idiographic causal explanation. The youths whom the researcher interviews may share stories of how their foster families, caseworkers, and others treated them. They may share stories about how they thought of their own sexuality or gender identity and how it changed over time. They may have different ideas about what it means to transition out of foster care.

Because qualitative questions usually look for idiographic causal relationships, they look different than quantitative questions. Table 8.3 below takes the final research questions from Table 8.1 and adapts them for qualitative research. The guidelines for research questions previously described in this chapter still apply, but there are some new elements to qualitative research questions that are not present in quantitative questions. First, qualitative research questions often ask about lived experience, personal experience, understanding, meaning, and stories. These keywords indicate that you will be using qualitative methods. Second, qualitative research questions may be more general and less specific. Instead of asking how one concept causes another, we are asking about how people understand or feel about a concept. They may also contain only one variable, rather than asking about relationships between multiple variables.

Table 8.3 Qualitative research questions
Quantitative Research Questions Qualitative Research Questions
How does witnessing domestic violence impact a child’s romantic relationships in adulthood? How do people who witness domestic violence understand how it affects their current relationships?
What is the relationship between sexual orientation or gender identity and homelessness for late adolescents in foster care? What is the experience of identifying as LGBTQ in the foster care system?
How does income inequality affect ambivalence in high-density urban areas? What does racial ambivalence mean to residents of an urban neighborhood with high income inequality?
How does race impact rates of mental health diagnosis for children in foster care? How do African-Americans experience seeking help for mental health concerns?

Qualitative research questions have one final feature that distinguishes them from quantitative research questions. They can change over the course of a study. Qualitative research is a reflexive process, one in which the researcher adapts her approach based on what participants say and do. The researcher must constantly evaluate whether their question is important and relevant to the participants. As the researcher gains information from participants, it is normal for the focus of the inquiry to shift.

For example, a qualitative researcher may want to study how a new truancy rule impacts youth at risk of expulsion. However, after interviewing some of the youth in her community, a researcher might find that the rule is actually irrelevant to their behavior and thoughts. Instead, her participants will direct the discussion to their frustration with the school administrators or their family’s economic insecurity. This is a natural part of qualitative research, and it is normal for research questions and hypothesis to evolve based on the information gleaned from participants.


Key Takeaways

  • Qualitative research questions often contain words like lived experience, personal experience, understanding, meaning, and stories.
  • Qualitative research questions can change and evolve as the researcher conducts the study.


Image attributions

Empathy by  Sean MacEntee  CC-BY-2.0


37

8.5 Feasibility and importance

Learning Objectives

  • Identify the aspects of feasibility that shape a researcher’s ability to conduct research
  • Analyze the importance of research projects


Now that you have thought about topics that interest you and you’ve learned how to frame those topics as social work research questions, you have probably come up with a few potential research questions—questions to which you are dying to know the answers. However, even if you have identified the most brilliant research question ever, you are still not ready to begin conducting research. First, you’ll need to think about and come up with a plan for your research design, which we discussed in Chapter 7. Once you’ve settled on a research question, your next step is to think about the feasibility of your research question.

There are a few practical matters related to feasibility that all researchers should consider before beginning a research project. Are you interested in better understanding the day-to-day experiences of maximum security prisoners? This sounds fascinating, but unless you plan to commit a crime that lands you in a maximum security prison, gaining access to that facility would be difficult for an undergraduate student project. Perhaps your interest is in the inner workings of toddler peer groups. If you’re much older than four or five, however, it might be tough for you to access that sort of group. Your ideal research topic might require you to live on a chartered sailboat in the Bahamas for a few years, but unless you have unlimited funding, it will be difficult to make even that happen. The point, of course, is that while the topics about which social work questions can be asked may seem limitless, there are limits to which aspects of topics we can study or at least to the ways we can study them.


a man looking at a corkboard with pieces of paper, planning and thinking

One of the most important questions in feasibility is whether or not you have access to the people you want to study. For example, let’s say you wanted to better understand students who engaged in self-harm behaviors in middle school. That is a topic of social importance, to be sure. But if you were a principal in charge of a middle school, would you want the parents to hear in the news about students engaging in self-harm at your school? Building a working relationship with the principal and the school administration will be a complicated task, but necessary in order to gain access to the population you need to study. Social work research must often satisfy multiple stakeholders. Stakeholders are individuals or groups who have an interest in the outcome of the study you conduct. Your goal of answering your research question can only be realized when you account for the goals of the other stakeholders. School administrators also want to help their students struggling with self-harm, so they may support your research project. But they may also need to avoid scandal and panic, providing support to students without making the problem worse.

Assuming you can gain approval to conduct research with the population that most interests you, do you know if that population will let you in? Researchers like Barrie Thorne (1993), Thorne, B. (1993). Gender play: Girls and boys in school. New Brunswick, NJ: Rutgers University Press. who study the behaviors of children, sometimes face this dilemma. In the course of her work, Professor Thorne has studied how children teach each other gender norms. She also studied how adults “gender” children, but here we’ll focus on just the former aspect of her work. Thorne had to figure out how to study the interactions of elementary school children when they probably would not accept her as one of their own. They were also unlikely to be able to read and complete a written questionnaire. Since she could not join them or ask them to read and write on a written questionnaire, Thorne’s solution was to watch the children. While this seems like a reasonable solution to the problem of not being able to actually enroll in elementary school herself, there is always the possibility that Thorne’s observations differed from what they might have been had she been able to actually join a class. What this means is that a researcher’s identity, in this case Thorne’s age, might sometimes limit (or enhance) her ability to study a topic in the way that she most wishes to study it. Think about Laud Humphreys’s research on the tearoom trade. Would he have been able to conduct this work if he had been a woman?

In addition to personal characteristics, there are also the very practical matters of time and money that shape what you are able to study or how you are able to study it. In terms of time, your personal time frame for conducting research may be the semester during which you are taking your research methods course. Perhaps, one day your employer will give you an even shorter timeline in which to conduct some research—or perhaps longer. By what time a researcher must complete her work may depend on a number of factors and will certainly shape what sort of research that person is able to conduct. Money, as always, is also relevant. For example, your ability to conduct research while living on a chartered sailboat in the Bahamas may be hindered unless you have unlimited funds or win the lottery. And if you wish to conduct survey research, you may have to think about the fact that mailing paper surveys costs not only time but money—from printing them to paying for the postage required to mail them. Interviewing people face to face may require that you offer your research participants a cup of coffee or glass of lemonade while you speak with them—and someone has to pay for the drinks.

In sum, feasibility is always a factor when deciding what, where, when, and how to conduct research. Aspects of your own identity may play a role in determining what you can and cannot investigate, as will the availability of resources such as time and money.

Importance

Another consideration before beginning a research project is whether the question is important enough. For the researcher, answering the question should be important enough to put in the effort, time, and often money required to complete a research project. As we discussed in Chapter 2, you should choose a topic that is important to you, one you wouldn’t mind learning about for at least a few months, if not a few years. Your time and effort are your most precious resources, particularly when you are in school. Make sure you dedicate them to topics and projects you consider important.


the word important spelled out using letters written on polaroid photos and tacked to a white background

Your research question should also be important and relevant to the scientific literature in your topic area. Scientific relevance can be a challenging concept to assess. An example I often provide students is as follows. If you plan to research if cognitive behavioral therapy (CBT) is an effective treatment for depression, you are a little late to be asking that question. Hundreds of scientists have published articles demonstrating its effectiveness at treating depression. If CBT is a therapy of interest to you, perhaps you can consider applying it to a population like older adults for which there may be little evidence for CBT’s effectiveness or to a social problem like mobile phone addiction for which CBT has not been tested. Your project should have something new to say that we don’t already know. For a good reason, Google Scholar’s motto at the bottom of their search page is “stand on the shoulders of giants.” Social science research rests on the work of previous scholars, building off of what they found to learn more about the social world. Ensure that your question will bring our scientific understanding of your topic to new heights.

Finally, your research question should be important to the social world. Social workers conduct research on behalf of target populations. Just as clients in a clinician’s office rely on social workers to help them, target populations rely on social work researchers to help them by illuminating aspects their life. Your research should matter to the people you are trying to help. By helping this client population, your study should be important to society as a whole. In Chapter 4, we discussed the problem statement, which contextualizes your study within a social problem and target population. The purpose of your study is to address this social problem and further social justice. Research projects, obviously, do not need to address all aspects of a problem or fix all of society. Just making a small stride in the right direction is more than enough to make your study of importance to the social world.

If your study requires money to complete, and almost all of them do, you will also have to make the case that your study is important enough to fund. Research grants can be as small as a few hundred or thousand dollars to multi-million dollar grants and anywhere in between. Generally speaking, scientists rarely fund their own research. Instead, they must convince governments, foundations, or others to support their research. Conducting expensive research often involves aligning your research question with what the funder identifies as important. In our previous example on CBT and older adults, you may want to seek funding from an Area Office on Aging or the American Association of Retired Persons. However, you will need to fit your research into their funding priorities or make the case that your study is important enough on its own merits. Perhaps they are interested in reducing suicides or increasing social connectedness. These funding priorities seem like a natural fit for a study on treating depression. If you’re successful, funders become important stakeholders in the research process. Researchers must take great care not to create conflicts of interest in which the funder is able to dictate the outcome of the study before it is even conducted.


Key Takeaways

  • When thinking about the feasibility of their research questions, researchers should consider their own identities and characteristics along with any potential constraints related to time and money.
  • Your research question should be important to you, social scientists, the target population, and funding sources.


Glossary

  • Stakeholders- individuals or groups who have an interest in the outcome of the study a researcher conducts


38

8.6 Matching question and design

Learning Objectives

  • Identify which research designs may be useful for answering your research question


This chapter described how to create a good quantitative and qualitative research question. Starting in Chapter 10, we will detail some of the basic designs that social scientists use to answer their research questions. But which design should you choose?


a chalkboard with "what's next?" written on it

As with most things, it all depends on your research question. If your research question involves, for example, testing a new intervention, you will likely want to use an experimental design. On the other hand, if you want to know the lived experience of people in a public housing building, you probably want to use an interview or focus group design.

We will learn more about each one of these designs in the remainder of this textbook. We will also learn about using data that already exists, studying an individual client inside clinical practice, and evaluating programs, which are other examples of designs. Below is a list of designs we will cover in this textbook:

The design of your research study determines what you and your participants will do. In an experiment, for example, the researcher will introduce a stimulus or treatment to participants and measure their responses. In contrast, a content analysis may not have participants at all, and the researcher may simply read the marketing materials for a corporation or look at a politician’s speeches to conduct the data analysis for the study.

If you think about your project, I imagine that a content analysis probably seems easier to accomplish than an experiment. As a researcher, you have to choose a research design that makes sense for your question and that is feasible to complete with the resources you have. All research projects require some resources to accomplish. Make sure your design is one you can carry out with the resources (time, money, staff, etc.) that you have.

There are so many different designs that exist in the social science literature that it would be impossible to include them all in this textbook. For example, photovoice is a qualitative method in which participants take photographs of meaningful scenes in their lives and discuss them in focus groups. This qualitative method can be particularly impactful, as pictures can illustrate the meaning behind concepts often better than mere words. I encourage you through your undergraduate and graduate studies in social work to come to know more advanced and specialized designs. The purpose of the subsequent chapters is to help you understand the basic designs upon which these more advanced designs are built.


Key Takeaways

  • The design you choose should follow from the research question you ask.
  • Research design will determine what the researchers and participants do during the project.


Image attributions

Board by geralt CC-0


IX

9. Defining and measuring concepts

39

9.0 Chapter introduction

This chapter is mainly focused on quantitative research methods, as the level of specificity required to begin quantitative research is far greater than that of qualitative research. In quantitative research, you must specify how you define and plan to measure each concept before you can interact with your participants. In qualitative research, definitions emerge from how participants respond to your questions. Because your participants are the experts, qualitative research does not reach the level of specificity and clarity required for quantitative research. For this reason, we will focus mostly on quantitative measurement and conceptualization in this chapter, with subsections addressing qualitative research.

Chapter Outline

Content Advisory

This chapter discusses or mentions the following topics: mental health diagnoses and depression, masculinity, suicide, juvenile delinquency and the criminal justice system, substance abuse, and shooting guns.

40

9.1 Measurement

Learning Objectives

  • Define measurement
  • Describe Kaplan’s three categories of the things that social scientists measure


Measurement is important. Recognizing that fact, and respecting it, will be of great benefit to you—both in research methods and in other areas of life as well. If, for example, you have ever baked a cake, you know well the importance of measurement. As someone who much prefers rebelling against precise rules over following them, I once learned the hard way that measurement matters. A couple of years ago I attempted to bake my wife a birthday cake without the help of any measuring utensils. I’d baked before, I reasoned, and I had a pretty good sense of the difference between a cup and a tablespoon. How hard could it be? As it turns out, it’s not easy guesstimating precise measures. That cake was the lumpiest, most lopsided cake I’ve ever seen. And it tasted kind of like Play-Doh. Unfortunately for my wife, I did not take measurement seriously and it showed.


blue measuring tape

Just as measurement is critical to successful baking, it is as important to successfully pulling off a social scientific research project. In social science, when we use the term measurement we mean the process by which we describe and ascribe meaning to the key facts, concepts, or other phenomena that we are investigating. At its core, measurement is about defining one’s terms in as clear and precise a way as possible. Of course, measurement in social science isn’t quite as simple as using a measuring cup or spoon, but there are some basic tenants on which most social scientists agree when it comes to measurement. We’ll explore those, as well as some of the ways that measurement might vary depending on your unique approach to the study of your topic.

What do social scientists measure?

 The question of what social scientists measure can be answered by asking yourself what social scientists study. Think about the topics you’ve learned about in other social work classes you’ve taken or the topics you’ve considered investigating yourself. Let’s consider Melissa Milkie and Catharine Warner’s study (2011) Milkie, M. A., & Warner, C. H. (2011). Classroom learning environments and the mental health of first grade children. Journal of Health and Social Behavior, 52, 4–22. of first graders’ mental health. In order to conduct that study, Milkie and Warner needed to have some idea about how they were going to measure mental health. What does mental health mean, exactly? And how do we know when we’re observing someone whose mental health is good and when we see someone whose mental health is compromised? Understanding how measurement works in research methods helps us answer these sorts of questions.

As you might have guessed, social scientists will measure just about anything that they have an interest in investigating. For example, those who are interested in learning something about the correlation between social class and levels of happiness must develop some way to measure both social class and happiness. Those who wish to understand how well immigrants cope in their new locations must measure immigrant status and coping. Those who wish to understand how a person’s gender shapes their workplace experiences must measure gender and workplace experiences. You get the idea. Social scientists can and do measure just about anything you can imagine observing or wanting to study. Of course, some things are easier to observe or measure than others.

In 1964, philosopher Abraham Kaplan (1964) Kaplan, A. (1964). The conduct of inquiry: Methodology for behavioral science. San Francisco, CA: Chandler Publishing Company. wrote The Conduct of Inquiry, which has since become a classic work in research methodology (Babbie, 2010). Earl Babbie offers a more detailed discussion of Kaplan’s work in his text. You can read it in: Babbie, E. (2010). The practice of social research (12th ed.). Belmont, CA: Wadsworth. In his text, Kaplan describes different categories of things that behavioral scientists observe. One of those categories, which Kaplan called “observational terms,” is probably the simplest to measure in social science. Observational terms are the sorts of things that we can see with the naked eye simply by looking at them. They are terms that “lend themselves to easy and confident verification” (Kaplan, 1964, p. 54). If, for example, we wanted to know how the conditions of playgrounds differ across different neighborhoods, we could directly observe the variety, amount, and condition of equipment at various playgrounds.


three people sitting on a bench in front of a wall composed of different people's photographs

Indirect observables, on the other hand, are less straightforward to assess. They are “terms whose application calls for relatively more subtle, complex, or indirect observations, in which inferences play an acknowledged part. Such inferences concern presumed connections, usually causal, between what is directly observed and what the term signifies” (Kaplan, 1964, p. 55). If we conducted a study for which we wished to know a person’s income, we’d probably have to ask them their income, perhaps in an interview or a survey. Thus, we have observed income, even if it has only been observed indirectly. Birthplace might be another indirect observable. We can ask study participants where they were born, but chances are good we won’t have directly observed any of those people being born in the locations they report.

Sometimes the measures that we are interested in are more complex and more abstract than observational terms or indirect observables. Think about some of the concepts you’ve learned about in other social work classes—for example, ethnocentrism. What is ethnocentrism? Well, from completing an introduction to social work class you might know that it has something to do with the way a person judges another’s culture. But how would you measure it? Here’s another construct: bureaucracy. We know this term has something to do with organizations and how they operate, but measuring such a construct is trickier than measuring, say, a person’s income. In both cases, ethnocentrism and bureaucracy, these theoretical notions represent ideas whose meaning we have come to agree on. Though we may not be able to observe these abstractions directly, we can observe the things that they are made up of.

Kaplan referred to these more abstract things that behavioral scientists measure as constructs. Constructs are “not observational either directly or indirectly” (Kaplan, 1964, p. 55), but they can be defined based on observables. For example, the construct of bureaucracy could be measured by counting the number of supervisors that need to approve routine spending by public administrators. The greater the number of administrators that must sign off on routine matters, the greater the degree of bureaucracy. Similarly, we might be able to ask a person the degree to which they trust people from different cultures around the world and then assess the ethnocentrism inherent in their answers. We can measure constructs like bureaucracy and ethnocentrism by defining them in terms of what we can observe.

Thus far, we have learned that social scientists measure what Kaplan called observational terms, indirect observables, and constructs. These terms refer to the different sorts of things that social scientists may be interested in measuring. But how do social scientists measure these things? That is the next question we’ll tackle.

How do social scientists measure?

 Measurement in social science is a process. It occurs at multiple stages of a research project: in the planning stages, in the data collection stage, and sometimes even in the analysis stage. Recall that previously we defined measurement as the process by which we describe and ascribe meaning to the key facts, concepts, or other phenomena that we are investigating. Once we’ve identified a research question, we begin to think about what some of the key ideas are that we hope to learn from our project. In describing those key ideas, we begin the measurement process.

Let’s say that our research question is the following: How do new college students cope with the adjustment to college? In order to answer this question, we’ll need some idea about what coping means. We may come up with an idea about what coping means early in the research process, as we begin to think about what to look for (or observe) in our data-collection phase. Once we’ve collected data on coping, we also have to decide how to report on the topic. Perhaps, for example, there are different types or dimensions of coping, some of which lead to more successful adjustment than others. However we decide to proceed, and whatever we decide to report, the point is that measurement is important at each of these phases.

As the preceding example demonstrates, measurement is a process in part because it occurs at multiple stages of conducting research. We could also think of measurement as a process because it involves multiple stages. From identifying your key terms to defining them to figuring out how to observe them and how to know if your observations are any good, there are multiple steps involved in the measurement process. An additional step in the measurement process involves deciding what elements your measures contain. A measure’s elements might be very straightforward and clear, particularly if they are directly observable. Other measures are more complex and might require the researcher to account for different themes or types. These sorts of complexities require paying careful attention to a concept’s level of measurement and its dimensions. We’ll explore these complexities in greater depth at the end of this chapter, but first let’s look more closely at the early steps involved in the measurement process, starting with conceptualization.


Key Takeaways

  • Measurement is the process by which we describe and ascribe meaning to the key facts, concepts, or other phenomena that we are investigating.
  • Kaplan identified three categories of things that social scientists measure including observational terms, indirect observables, and constructs.
  • Measurement occurs at all stages of research.


Glossary

  • Constructs- are not observable but can be defined based on observable characteristics
  • Indirect observables- things that require indirect observation and inference to measure
  • Measurement- the process by which researchers describe and ascribe meaning to the key facts, concepts, or other phenomena they are investigating
  • Observational terms- things that we can see with the naked eye simply by looking at them


Image attributions

measuring tape by unknown CC-0

human observer by geralt CC-0


41

9.2 Conceptualization

Learning Objectives

  • Define concept
  • Identify why defining our concepts is important
  • Describe how conceptualization works in quantitative and qualitative research
  • Define dimensions in terms of social scientific measurement
  • Apply reification to conceptualization


In this section, we’ll take a look at one of the first steps in the measurement process, which is conceptualization. This has to do with defining our terms as clearly as possible and also not taking ourselves too seriously in the process. Our definitions mean only what we say they mean—nothing more and nothing less. Let’s talk first about how to define our terms, and then we’ll examine what I mean about not taking ourselves (or our terms, rather) too seriously.

Concepts and conceptualization

 So far, the word concept has come up quite a bit, and it would behoove us to make sure we have a shared understanding of that term. A concept is the notion or image that we conjure up when we think of some cluster of related observations or ideas. For example, masculinity is a concept. What do you think of when you hear that word? Presumably, you imagine some set of behaviors and perhaps even a particular style of self-presentation. Of course, we can’t necessarily assume that everyone conjures up the same set of ideas or images when they hear the word masculinity. In fact, there are many possible ways to define the term. And while some definitions may be more common or have more support than others, there isn’t one true, always-correct-in-all-settings definition. What counts as masculine may shift over time, from culture to culture, and even from individual to individual (Kimmel, 2008). Kimmel, M. (2008). Masculinity. In W. A. Darity Jr. (Ed.), International encyclopedia of the social sciences (2nd ed., Vol. 5, p. 1–5). Detroit, MI: Macmillan Reference USA. This is why defining our concepts is so important.


a lightbulb inside of a thought bubble on a chalkboard

You might be asking yourself why you should bother defining a term for which there is no single, correct definition. Believe it or not, this is true for any concept you might measure in a research study—there is never a single, always-correct definition. When we conduct empirical research, our terms mean only what we say they mean. There’s a New Yorker cartoon that aptly represents this idea (https://condenaststore.com/featured/it-all-depends-on-how-you-define-chop-tom-cheney.html). It depicts a young George Washington holding an axe and standing near a freshly chopped cherry tree. Young George is looking up at a frowning adult who is standing over him, arms crossed. The caption depicts George explaining, “It all depends on how you define ‘chop.’” Young George Washington gets the idea—whether he actually chopped down the cherry tree depends on whether we have a shared understanding of the term chop.

Without a shared understanding of this term, our understandings of what George has just done may differ. Likewise, without understanding how a researcher has defined her key concepts, it would be nearly impossible to understand the meaning of that researcher’s findings and conclusions. Thus, any decision we make based on findings from empirical research should be made based on full knowledge not only of how the research was designed, as described in Chapter 7 but also of how its concepts were defined and measured.

So, how do we define our concepts? This is part of the process of measurement, and this portion of the process is called conceptualization. The answer depends on how we plan to approach our research. We will begin with quantitative conceptualization and then discuss qualitative conceptualization.

In quantitative research, conceptualization involves writing out clear, concise definitions for our key concepts. Sticking with the previously mentioned example of masculinity, think about what comes to mind when you read that term. How do you know masculinity when you see it? Does it have something to do with men? With social norms? If so, perhaps we could define masculinity as the social norms that men are expected to follow. That seems like a reasonable start, and at this early stage of conceptualization, brainstorming about the images conjured up by concepts and playing around with possible definitions is appropriate. However, this is just the first step.

It would make sense as well to consult other previous research and theory to understand if other scholars have already defined the concepts we’re interested in. This doesn’t necessarily mean we must use their definitions, but understanding how concepts have been defined in the past will give us an idea about how our conceptualizations compare with the predominant ones out there. Understanding prior definitions of our key concepts will also help us decide whether we plan to challenge those conceptualizations or rely on them for our own work. Finally, working on conceptualization is likely to help in the process of refining your research question to one that is specific and clear in what it asks.

If we turn to the literature on masculinity, we will surely come across work by Michael Kimmel, one of the preeminent masculinity scholars in the United States. After consulting Kimmel’s prior work (2000; 2008), Kimmel, M. (2000). The gendered society. New York, NY: Oxford University Press; Kimmel, M. (2008). Masculinity. In W. A. Darity Jr. (Ed.), International encyclopedia of the social sciences (2nd ed., Vol. 5, p. 1–5). Detroit, MI: Macmillan Reference USA. we might tweak our initial definition of masculinity just a bit. Rather than defining masculinity as “the social norms that men are expected to follow,” perhaps instead we’ll define it as “the social roles, behaviors, and meanings prescribed for men in any given society at any one time” (Kimmel & Aronson, 2004, p. 503). Kimmel, M. & Aronson, A. B. (2004). Men and masculinities: A-J. Denver, CO: ABL-CLIO. Our revised definition is both more precise and more complex. Rather than simply addressing one aspect of men’s lives (norms), our new definition addresses three aspects: roles, behaviors, and meanings. It also implies that roles, behaviors, and meanings may vary across societies and over time. To be clear, we’ll also have to specify the particular society and time period we’re investigating as we conceptualize masculinity.

As you can see, conceptualization isn’t quite as simple as merely applying any random definition that we come up with to a term. Sure, it may involve some initial brainstorming, but conceptualization goes beyond that. Once we’ve brainstormed a bit about the images a particular word conjures up for us, we should also consult prior work to understand how others define the term in question. And after we’ve identified a clear definition that we’re happy with, we should make sure that every term used in our definition will make sense to others. Are there terms used within our definition that also need to be defined? If so, our conceptualization is not yet complete. And there is yet another aspect of conceptualization to consider—concept dimensions. We’ll consider that aspect along with an additional word of caution about conceptualization in the next subsection.

Conceptualization in qualitative research proceeds a bit differently than in quantitative research. Because qualitative researchers are interested in the understandings and experiences of their participants, it is less important for the researcher to find one fixed definition for a concept before starting to interview or interact with participants. The researcher’s job is to accurately and completely represent how their participants understand a concept, not to test their own definition of that concept.

If you were conducting qualitative research on masculinity, you would likely consult previous literature like Kimmel’s work mentioned above. From your literature review, you may come up with a working definition for the terms you plan to use in your study, which can change over the course of the investigation. However, the definition that matters is the definition that your participants share during data collection. A working definition is merely a place to start, and researchers should take care not to think it is the only or best definition out there.

In qualitative inquiry, your participants are the experts (sound familiar, social workers?) on the concepts that arise during the research study. Your job as the researcher is to accurately and reliably collect and interpret their understanding of the concepts they describe while answering your questions. Conceptualization of qualitative concepts is likely to change over the course of qualitative inquiry, as you learn more information from your participants. Indeed, getting participants to comment on, extend, or challenge the definitions and understandings of other participants is a hallmark of qualitative research. This is the opposite of quantitative research, in which definitions must be completely set in stone before the inquiry can begin.

A word of caution about conceptualization

 Whether you have chosen qualitative or quantitative methods, you should have a clear definition for the term masculinity and make sure that the terms we use in our definition are equally clear—and then we’re done, right? Not so fast. If you’ve ever met more than one man in your life, you’ve probably noticed that they are not all exactly the same, even if they live in the same society and at the same historical time period. This could mean there are dimensions of masculinity. In terms of social scientific measurement, concepts can be said to have multiple dimensions when there are multiple elements that make up a single concept. With respect to the term masculinity, dimensions could be regional (is masculinity defined differently in different regions of the same country?), age-based (is masculinity defined differently for men of different ages?), or perhaps power-based (does masculinity differ based on membership to privileged groups?). In any of these cases, the concept of masculinity would be considered to have multiple dimensions. While it isn’t necessarily required to spell out every possible dimension of the concepts you wish to measure, it may be important to do so depending on the goals of your research. The point here is to be aware that some concepts have dimensions and to think about whether and when dimensions may be relevant to the concepts you intend to investigate.


a lightbulb on a chalkboard with lines to other thought bubbles

Before we move on to the additional steps involved in the measurement process, it would be wise to remind ourselves not to take our definitions too seriously. Conceptualization must be open to revisions, even radical revisions, as scientific knowledge progresses. While I’ve suggested that we should consult prior scholarly definitions of our concepts, it would be wrong to assume that just because prior definitions exist that they are more real than the definitions we create (or, likewise, that our own made-up definitions are any more real than any other definition). It would also be wrong to assume that just because definitions exist for some concept that the concept itself exists beyond some abstract idea in our heads. This idea, assuming that our abstract concepts exist in some concrete, tangible way, is known as reification.

To better understand reification, take a moment to think about the concept of social structure. This concept is central to critical thinking. When social scientists talk about social structure, they are talking about an abstract concept. Social structures shape our ways of being in the world and of interacting with one another, but they do not exist in any concrete or tangible way. A social structure isn’t the same thing as other sorts of structures, such as buildings or bridges. Sure, both types of structures are important to how we live our everyday lives, but one we can touch, and the other is just an idea that shapes our way of living.

Here’s another way of thinking about reification: Think about the term family. If you were interested in studying this concept, we’ve learned that it would be good to consult prior theory and research to understand how the term has been conceptualized by others. But we should also question past conceptualizations. Think, for example, about how different the definition of family was 50 years ago. Because researchers from that time period conceptualized family using now outdated social norms, social scientists from 50 years ago created research projects based on what we consider now to be a very limited and problematic notion of what family means. Their definitions of family were as real to them as our definitions are to us today. If researchers never challenged the definitions of terms like family, our scientific knowledge would be filled with the prejudices and blind spots from years ago. It makes sense to come to some social agreement about what various concepts mean. Without that agreement, it would be difficult to navigate through everyday living. But at the same time, we should not forget that we have assigned those definitions, they are imperfect and subject to change as a result of critical inquiry.


Key Takeaways

  • Conceptualization is a process that involves coming up with clear, concise definitions.
  • Conceptualization in quantitative research comes from the researcher’s ideas or the literature.
  • Qualitative researchers conceptualize by creating working definitions which will be revised based on what participants say.
  • Some concepts have multiple elements or dimensions.
  • Researchers should acknowledge the limitations of their definitions for concepts.


Glossary

  • Concept- notion or image that we conjure up when we think of some cluster of related observations or ideas
  • Conceptualization- writing out clear, concise definitions for our key concepts, particularly in quantitative research
  • Multi-dimensional concepts- concepts that are comprised of multiple elements
  • Reification- assuming that abstract concepts exist in some concrete, tangible way


Image attributions

thought by TeroVesalainen CC-0

mindmap by TeroVesalainen CC-0


42

9.3 Operationalization

Learning Objectives

  • Define and give an example of indicators for a variable
  • Identify the three components of an operational definition
  • Describe the purpose of multi-dimensional measures such as indexes, scales, and typologies and why they are used


Now that we have figured out how to define, or conceptualize, our terms we’ll need to think about operationalizing them. Operationalization is the process by which researchers conducting quantitative research spell out precisely how a concept will be measured. It involves identifying the specific research procedures we will use to gather data about our concepts. This of course requires that we know what research method(s) we will employ to learn about our concepts, and we’ll examine specific research methods later on in the text. For now, let’s take a broad look at how operationalization works. We can then revisit how this process works when we examine specific methods of data collection in later chapters. Remember, operationalization is only a process in quantitative research. Measurement in qualitative research will be discussed at the end of this section.

Indicators

Operationalization works by identifying specific indicators that will be taken to represent the ideas we are interested in studying. If, for example, we are interested in studying masculinity, indicators for that concept might include some of the social roles prescribed to men in society such as breadwinning or fatherhood. Being a breadwinner or a father might therefore be considered indicators of a person’s masculinity. The extent to which a man fulfills either, or both, of these roles might be understood as clues (or indicators) about the extent to which he is viewed as masculine.

Let’s look at another example of indicators. Each day, Gallup researchers poll 1,000 randomly selected Americans to ask them about their well-being. To measure well-being, Gallup asks these people to respond to questions covering six broad areas: physical health, emotional health, work environment, life evaluation, healthy behaviors, and access to basic necessities. Gallup uses these six factors as indicators of the concept that they are really interested in, which is well-being (http://www.well-beingindex.com/).

Identifying indicators can be even simpler than the examples described thus far. What are the possible indicators of the concept of gender? Most of us would probably agree that “man” and “woman” are both reasonable indicators of gender, but you may want to include other options for people who identify as non-binary or other genders. Political party is another relatively easy concept for which to identify indicators. In the United States, likely indicators include Democrat and Republican and, depending on your research interest, you may include additional indicators such as Independent, Green, or Libertarian as well. Age and birthplace are additional examples of concepts for which identifying indicators is a relatively simple process. What concepts are of interest to you, and what are the possible indictors of those concepts?


two people comparing charts and notes

We have now considered a few examples of concepts and their indicators, but it is important we don’t make the process of coming up with indicators too arbitrary or casual. One way to avoid taking an overly casual approach in identifying indicators, as described previously, is to turn to prior theoretical and empirical work in your area. Theories will point you in the direction of relevant concepts and possible indicators; empirical work will give you some very specific examples of how the important concepts in an area have been measured in the past and what sorts of indicators have been used. Often, it makes sense to use the same indicators as researchers who have come before you. On the other hand, perhaps you notice some possible weaknesses in measures that have been used in the past that your own methodological approach will enable you to overcome.

Speaking of your methodological approach, another very important thing to think about when deciding on indicators and how you will measure your key concepts is the strategy you will use for data collection. A survey implies one way of measuring concepts, while focus groups imply a quite different way of measuring concepts. Your design choices will play an important role in shaping how you measure your concepts.

Operationalizing your variables

 Moving from identifying concepts to conceptualizing them and then to operationalizing them is a matter of increasing specificity. You begin the research process with a general interest, identify a few concepts that are essential for studying that interest you, work to define those concepts, and then spell out precisely how you will measure those concepts. In quantitative research, that final stage is called operationalization.

An operational definition consists of the following components: (1) the variable being measured, (2) the measure you will use, (3) how you plan to interpret the results of that measure.

The first component, the variable, should be the easiest part. By now in quantitative research, you should have a research question that has at least one independent and at least one dependent variable. Remember that variables have to be able to vary. For example, the United States is not a variable. Country of birth is a variable, as is patriotism. Similarly, if your sample only includes men, gender is a constant in your study…not a variable.

Let’s pick a social work research question and walk through the process of operationalizing variables. I’m going to hypothesize that individuals on a residential psychiatric unit who are more depressed are less likely to be satisfied with care. Remember, this would be a negative relationship—as depression increases, satisfaction decreases. In this question, depression is my independent variable (the cause) and satisfaction with care is my dependent variable (the effect). We have our two variables—depression and satisfaction with care—so the first component is done. Now, we move onto the second component–the measure.

How do you measure depression or satisfaction? Many students begin by thinking that they could look at body language to see if a person were depressed. Maybe they would also verbally express feelings of sadness or hopelessness more often. A satisfied person might be happy around service providers and express gratitude more often. These may indicate depression, but they lack coherence. Unfortunately, what this “measure” is actually saying is that “I know depression and satisfaction when I see them.” While you are likely a decent judge of depression and satisfaction, you need to provide more information in a research study for how you plan to measure your variables. Your judgment is subjective, based on your own idiosyncratic experiences with depression and satisfaction. They couldn’t be replicated by another researcher. They also can’t be done consistently for a large group of people. Operationalization requires that you come up with a specific and rigorous measure for seeing who is depressed or satisfied.

Finding a good measure for your variable can take less than a minute. To measure a variable like age, you would probably put a question on a survey that asked, “How old are you?” To evaluate someone’s length of stay in a hospital, you might ask for access to their medical records and count the days from when they were admitted to when they were discharged. Measuring a variable like income might require some more thought, though. Are you interested in this person’s individual income or the income of their family unit? This might matter if your participant does not work or is dependent on other family members for income. Do you count income from social welfare programs? Are you interested in their income per month or per year? Measures must be specific and clear.

Depending on your research design, your measure may be something you put on a survey or pre/post-test that you give to your participants. For a variable like age or income, one well-worded question may suffice. Unfortunately, most variables in the social world so simple. Depression and satisfaction are multi-dimensional variables, as they each contain multiple elements. Asking someone “Are you depressed?” does not do justice to the complexity of depression, which includes issues with mood, sleeping, eating, relationships, and happiness. Asking someone “Are you satisfied with the services you received?” similarly omits multiple dimensions of satisfaction, such as timeliness, respect, meeting needs, and likelihood of recommending to a friend, among many others.


checking off checkmarks on a paper with a pink highlighter

To account for a variable’s dimensions, a researcher might rely on indexes, scales, or typologies. An index is a type of measure that contains several indicators and is used to summarize some more general concept. An index of depression might ask if the person has experienced any of the following indicators in the past month: pervasive feelings of hopelessness, thoughts of suicide, over- or under-eating, and a lack of enjoyment in normal activities. On their own, some of these indicators like over- or under-eating might not be considered depression, but collectively, the answers to each of these indicators add up to an overall experience of depression. The index allows the researcher in this case to better understand what shape a respondent’s depression experience takes. If the researcher had only asked whether a respondent had ever experienced depression, she wouldn’t know what sorts of behaviors actually made up that respondent’s experience of depression.

Taking things one step further, if the researcher decides to rank order the various behaviors that make up depression, perhaps weighting suicidal thoughts more heavily than eating disturbances, then she will have created a scale rather than an index. Like an index, a scale is also a measure composed of multiple items or questions. But unlike indexes, scales are designed in a way that accounts for the possibility that different items may vary in intensity.

If creating your own scale sounds painful, don’t worry! For most multidimensional variables, you would likely be duplicating work that has already been done by other researchers. You do not need to create a scale for depression because scales such as the Patient Health Questionnaire (PHQ-9) and the Center for Epidemiologic Studies Depression Scale (CES-D) and Beck’s Depression Inventory (BDI) have been developed and refined over dozens of years to measure variables like depression. Similarly, scales such as the Patient Satisfaction Questionnaire (PSQ-18) have been developed to measure satisfaction with medical care. As we will discuss in the next section, these scales have been shown to be reliable and valid. While you could create a new scale to measure depression or satisfaction, a study with rigor would pilot test and refine that scale over time to make sure it measures the concept accurately and consistently. This high level of rigor is often unachievable in undergraduate research projects, so using existing scales is recommended.

Another reason existing scales are preferable is that they can save time and effort. The Mental Measurements Yearbook provides a searchable database of measures for different variables. You can access this database from your library’s list of databases. If you can’t find anything in there, your next stop should be the methods section of the articles in your literature review. The methods section of each article will detail how the researchers measured their variables. In a quantitative study, researchers likely used a scale to measure key variables and will provide a brief description of that scale. A Google Scholar search such as “depression scale” or “satisfaction scale” should also provide some relevant results. As a last resort, a general web search may bring you to a scale for your variable.

Unfortunately, all of these approaches do not guarantee that you will be able to actually see the scale itself or get information on how it is interpreted. Many scales cost money to use and may require training to properly administer. You may also find scales that are related to your variable but would need to be slightly modified to match your study’s needs. Adapting a scale to fit your study is a possibility; however, you should remember that changing even small parts of a scale can influence its accuracy and consistency. Pilot testing is always recommended for adapted scales.

A final way of measuring multidimensional variables is a typology.  A typology is a way of categorizing concepts according to particular themes.  Probably the most familiar version of a typology is the 2×2 matrix.  Let’s take an example from self-determination theory (Abery & Stancliffe, 2003). Abery, B. & Stancliffe, R. (2003). An ecological theory of self-determination: Theoretical foundations. In M.L. Wehmeyer, B.H. Abery, D.E. Mithaug, & R.J. Stancliffe’s (Eds.), Theory in self-determination: Foundations for educational practice (pp. 25-42). Springfield, Illinois: Charles C. Thomas Publisher. The authors opearationalize self-determination by creating a typology based on the desired amount of control a person has over an action, the amount of control they are able to exercise, and its important to the person. Let’s think of an example. If a person wants a high degree of control what they eat for breakfast; it’s important to them.  But perhaps their parents or support workers do not allow them to do so.  They would have low-self-determination this model–exercised control low, importance high, desired control high.  It is easier to visualize these relationships in in Figure 9.1, from the Avery and Stancliffe book chapter mentioned above.  For our example, we would fit into the bottom left corner.


typology showing how self-determination varies based on exercised control, desired control, and importance
Figure 9.1 A typology of self-determination

Once you have your variable (1) and your measure (2), you need to describe how you plan to interpret your measure. For the example above on juvenile rehabilitation programs, the student created definitions of how each category was defined (e.g., job skills programs included resume writing, dress for success, etc.) and counted the number of times a client was referred to those programs by their parole officer. Our previous example on age, you might choose to use the raw number that the participant provides (e.g., 22), or you might put that person into categories (e.g., under 25 or 20-29-years-old).

When using a scale as your measure, you should look at the information provided by the scale’s authors for how to interpret the scale. If you can’t find enough information from the scale’s creator, look at how the results of that scale are reported in the results section of research articles. For example, Beck’s Depression Inventory (BDI-II) uses 21 questions to measure depression. A person indicates on a scale of 0-3 how much they agree with a statement. The results for each question are added up, and the respondent is put into one of three categories: low levels of depression (1-16), moderate levels of depression (17-30), or severe levels of depression (31 and over).

In sum, operationalization specifies what measure you will be using to measure your variable and how you plan to interpret that measure. Operationalization is probably the trickiest component of basic research methods. Don’t get frustrated if it takes a few drafts and a lot of feedback to get to a workable definition. I’m currently trying operationalize the concept attitudes towards research methods. Originally, I thought I could use the course evaluations students completed at the end of the semester to gauge their attitudes towards research methods. As I looked into the methodological problems with student course evaluations, I reconsidered how I measured attitudes towards research. I used focus groups of students to figure out common beliefs about research. I mentioned these opinions in Chapter 1—including that research is boring, useless, and too difficult. I then created a scale based on these opinions, and plan to pilot test it with another group of students. I expect that after the pilot test I will have to revise it yet again before I can implement the measure in a real social work research project. At the time I’m writing this, I’m still not completely done operationalizing this concept.

Qualitative research and operationalization

As we discussed in the previous section, qualitative research takes a more open approach towards defining the concepts in your research question. The questions you choose to ask in your interview, focus group, or content analysis will determine what data you end up getting from your participants. For example, if you are researching depression qualitatively, you would not use a scale like the Beck’s Depression Inventory, which is a quantitative measure we described above. Instead, you should start off with a tentative definition of what depression means based on your literature review and use that definition to come up with questions for your participants. We will cover how those questions fit into qualitative research designs later on in the textbook. For now, remember that qualitative researchers use the questions they ask participants to measure their variables and that qualitative researchers can change their questions as they gather more information from participants. Ultimately, the concepts in a qualitative study will be defined by the researcher’s interpretation of what her participants say. Unlike in quantitative research in which definitions must be explicitly spelled out in advance, qualitative research allows the definitions of concepts to emerge during data analysis.


Key Takeaways

  • Operationalization involves spelling out precisely how a concept will be measured.
  • Operational definitions must include the variable, the measure, and how you plan to interpret the measure.
  • Indexes, scales, and typologies are used to measure multi-dimensional concepts.
  • It’s a good idea to look at how researchers have measured the concept in previous studies.


Glossary

  • Index- measure that contains several indicators and is used to summarize a more general concept
  • Indicators- represent the concepts that we are interested in studying
  • Operationalization- process by which researchers conducting quantitative research spell out precisely how a concept will be measured and how to interpret that measure
  • Scale- composite measure designed in a way that accounts for the possibility that different items on an index may vary in intensity
  • Typology- measure that categorizes concepts according to particular themes


Image attributions

Business charts by Pixabay CC-0

Checklist by TeroVesalainen CC-0


43

9.4 Measurement quality

Learning Objectives

  • Define reliability and describe the types of reliability
  • Define validity and describe the types of validity
  • Analyze the rigor of qualitative measurement using the criteria of trustworthiness and authenticity


In quantitative research, once we’ve managed to define our terms and specify the operations for measuring them, how do we know that our measures are any good? Without some assurance of the quality of our measures, we cannot be certain that our findings have any meaning or, at the least, that our findings mean what we think they mean. When social scientists measure concepts, they aim to achieve reliability and validity in their measures. These two aspects of measurement quality are the focus of this section. We’ll consider reliability first and then take a look at validity. For both aspects of measurement quality, let’s say our interest is in measuring the concepts of alcoholism and alcohol intake. What are some potential problems that could arise when attempting to measure this concept, and how might we work to overcome those problems?


the word quality with a checkmark next to it

Reliability

First, let’s say we’ve decided to measure alcoholism by asking people to respond to the following question: Have you ever had a problem with alcohol? If we measure alcoholism in this way, it seems likely that anyone who identifies as an alcoholic would respond with a yes to the question. So, this must be a good way to identify our group of interest, right? Well, maybe. Think about how you or others you know would respond to this question. Would responses differ after a wild night out from what they would have been the day before? Might an infrequent drinker’s current headache from the single glass of wine she had last night influence how she answers the question this morning? How would that same person respond to the question before consuming the wine? In each of these cases, if the same person would respond differently to the same question at different points, it is possible that our measure of alcoholism has a reliability problem. Reliability in measurement is about consistency.

One common problem of reliability with social scientific measures is memory. If we ask research participants to recall some aspect of their own past behavior, we should try to make the recollection process as simple and straightforward for them as possible. Sticking with the topic of alcohol intake, if we ask respondents how much wine, beer, and liquor they’ve consumed each day over the course of the past 3 months, how likely are we to get accurate responses? Unless a person keeps a journal documenting their intake, there will very likely be some inaccuracies in their responses. If, on the other hand, we ask a person how many drinks of any kind they have consumed in the past week, we might get a more accurate set of responses.

Reliability can be an issue even when we’re not reliant on others to accurately report their behaviors. Perhaps a researcher is interested in observing how alcohol intake influences interactions in public locations. She may decide to conduct observations at a local pub, noting how many drinks patrons consume and how their behavior changes as their intake changes. But what if the researcher has to use the restroom and misses the three shots of tequila that the person next to her downs during the brief period she is away? The reliability of this researcher’s measure of alcohol intake, counting numbers of drinks she observes patrons consume, depends on her ability to actually observe every instance of patrons consuming drinks. If she is unlikely to be able to observe every such instance, then perhaps her mechanism for measuring this concept is not reliable.

If a measure is reliable, it means that if the measure is given multiple times, the results will be consistent each time. For example, if you took the SATs on multiple occasions before coming to school, your scores should be relatively the same from test to test. This is what is known as test-retest reliability. In the same way, if a person is clinically depressed, a depression scale should give similar (though not necessarily identical) results today that it does two days from now.

Additionally, if your study involves observing people’s behaviors, for example watching sessions of mothers playing with infants, you may also need to assess inter-rater reliability. Inter-rater reliability is the degree to which different observers agree on what happened. Did you miss when the infant offered an object to the mother and the mother dismissed it? Did the other person rating miss that event? Do you both similarly rate the parent’s engagement with the child? Again, scores of multiple observers should be consistent, though perhaps not perfectly identical.

Finally, for scales, internal consistency reliability is an important concept. The scores on each question of a scale should be correlated with each other, as they all measure parts of the same concept. Think about a scale of depression, like Beck’s Depression Inventory. A person who is depressed would score highly on most of the measures, but there would be some variation. If we gave a group of people that scale, we would imagine there should be a correlation between scores on, for example, mood disturbance and lack of enjoyment. They aren’t the same concept, but they are related. So, there should be a mathematical relationship between them. A specific statistical test known as Cronbach’s Alpha provides a way to measure how well each question of a scale is related to the others.

Test-retest, inter-rater, and internal consistency are three important subtypes of reliability. Researchers use these types of reliability to make sure their measures are consistently measuring the concepts in their research questions.

Validity

While reliability is about consistency, validity is about accuracy. What image comes to mind for you when you hear the word alcoholic? Are you certain that the image you conjure up is similar to the image others have in mind? If not, then we may be facing a problem of validity.

For a measure to have validity, we must be certain that our measures accurately get at the meaning of our concepts. Think back to the first possible measure of alcoholism we considered in the previous few paragraphs. There, we initially considered measuring alcoholism by asking research participants the following question: Have you ever had a problem with alcohol? We realized that this might not be the most reliable way of measuring alcoholism because the same person’s response might vary dramatically depending on how they are feeling that day. Likewise, this measure of alcoholism is not particularly valid. What is “a problem” with alcohol? For some, it might be having had a single regrettable or embarrassing moment that resulted from consuming too much. For others, the threshold for “problem” might be different; perhaps a person has had numerous embarrassing drunken moments but still gets out of bed for work every day, so they don’t perceive themselves as having a problem. Because what each respondent considers to be problematic could vary so dramatically, our measure of alcoholism isn’t likely to yield any useful or meaningful results if our aim is to objectively understand, say, how many of our research participants are alcoholics. Of course, if our interest is in how many research participants perceive themselves to have a problem, then our measure may be just fine.

In the last paragraph, critical engagement with our measure for alcoholism “Do you have a problem with alcohol?” was shown to be flawed. We assessed its face validity or whether it is plausible that the question measures what it intends to measure. Face validity is a subjective process. Sometimes face validity is easy, as a question about height wouldn’t have anything to do with alcoholism. Other times, face validity can be more difficult to assess. Let’s consider another example.

Perhaps we’re interested in learning about a person’s dedication to healthy living. Most of us would probably agree that engaging in regular exercise is a sign of healthy living, so we could measure healthy living by counting the number of times per week that a person visits their local gym. But perhaps they visit the gym to use their tanning beds or to flirt with potential dates or sit in the sauna. These activities, while potentially relaxing, are probably not the best indicators of healthy living. Therefore, recording the number of times a person visits the gym may not be the most valid way to measure their dedication to healthy living.

Another problem with this measure of healthy living is that it is incomplete. Content validity assesses for whether the measure includes all of the possible meanings of the concept. Think back to the previous section on multidimensional variables. Healthy living seems like a multidimensional concept that might need an index, scale, or typology to measure it completely. Our one question on gym attendance doesn’t cover all aspects of healthy living. Once you have created one, or found one in the existing literature, you need to assess for content validity. Are there other aspects of healthy living that aren’t included in your measure?

Let’s say you have created (or found) a good scale, index, or typology for your measure of healthy living. A valid measure of healthy living would be able to predict, for example, scores of a blood panel test during their annual physical. This is called predictive validity, and it means that your measure predicts things it should be able to predict. In this case, I assume that if you have a healthy lifestyle, a standard blood test done a few months later during an annual checkup would show healthy results. If we were to administer the blood panel measure at the same time as you administer your scale of healthy living, we would be assessing concurrent validity. Concurrent validity is the same as predictive validity—the scores on your measure should be similar to an established measure—except that both measures are given at the same time.

Another closely related concept is convergent validity. In assessing for convergent validity, one should look for existing measures of the same concept, for example the Healthy Lifestyle Behaviors Scale (HLBS). If you give someone your scale and the HLBS at the same time, their scores should be pretty similar. Convergent validity takes an existing measure of the same concept and compares your measure to it. If their scores are similar, then it’s probably likely that they are both measuring the same concept. Discriminant validity is a similar concept, except you would be comparing your measure to one that is entirely unrelated. A participant’s scores on your healthy lifestyle measure shouldn’t be statistically correlated with a scale that measures knowledge of the Italian language.

These are the basic subtypes of validity, though there are certainly others you can read more about. One way to think of validity is to think of it as you would a portrait. Some portraits of people look just like the actual person they are intended to represent. But other representations of people’s images, such as caricatures and stick drawings, are not nearly as accurate. While a portrait may not be an exact representation of how a person looks, what’s important is the extent to which it approximates the look of the person it is intended to represent. The same goes for validity in measures. No measure is exact, but some measures are more accurate than others.

If you are still confused about validity and reliability, Figure 9.2 shows what a validity and reliability look like. On the first target, our shooter’s aim is all over the place. It is neither reliable (consistent) nor valid (accurate). The second (top right) target shows an unreliable or inconsistent shot, but one that is centered around the target (accurate). The third (bottom left) target demonstrates consistency…but it is reliably off-target, or invalid. The fourth and final target (bottom right) represents a reliable and valid result. The person is able to hit the target accurately and consistently. This is what you should aim for in your research.

targets showing a reliable and valid shooter, as well as unrealiable and invalid shooters

Figure 9.2 was adapted from Nevit Dilmen’s “Reliability and validity” (2012) Shared under a CC-BY 3.0 license Retrieved from: https://commons.wikimedia.org/wiki/File:Reliability_and_validity.svg I changed the word unvalid to invalid to reflect more commonly used language.

Trustworthiness and authenticity

In qualitative research, the standards for measurement quality differ than quantitative research for an important reason. Measurement in quantitative research is done objectively or impartially. That is, the researcher doesn’t have much to do with it. The researcher chooses a measure, applies it, and reads the results. The extent to which the results are accurate and consistent is a problem with the measure, not the researcher.

The same cannot be said for qualitative research. Qualitative researchers are deeply involved in the data analysis process. There is no external measurement tool, like a quantitative scale. Rather, the researcher herself is the measurement instrument. Researchers build connections between different ideas that participants discuss and draft an analysis that accurately reflects the depth and complexity of what participants have said. This is a challenging task for a researcher. It involves acknowledging her own biases, either from personal experience or previous knowledge about the topic, and allowing the meaning that participants shared to emerge as the data is read. It’s not necessarily about being objective, as there is always some subjectivity in qualitative analysis, but more about the rigor with which the individual researcher engages in data analysis.


a metal sign with the word trust on it

For this reason, researchers speak of rigor in more personal terms. Trustworthiness refers to the “truth value, applicability, consistency, and neutrality” of the results of a research study (Rodwell, 1998, p. 96). Rodwell, M. K. (1998). Social work constructivist research. New York, NY: Garland Publishing. Authenticity refers to the degree to which researchers capture the multiple perspectives and values of participants in their study and foster change across participants and systems during their analysis. Both trustworthiness and authenticity contain criteria that help a researcher gauge the rigor with which the study was conducted.

Most relevant to the discussion of validity and reliability are the trustworthiness criteria of credibility, dependability, and confirmability. Credibility refers to the degree to which the results are accurate and viewed as important and believable by participants. Qualitative researchers will often check with participants before finalizing and publishing their results to make sure participants agree with them. They may also seek out assistance from another qualitative researcher to review or audit their work. As you might expect, it’s difficult to view your own research without bias, so another set of eyes is often helpful. Unlike in quantitative research, the ultimate goal is not to find the Truth (with a capital T) using a predetermined measure, but to create a credible interpretation of the data.

Credibility is seen as akin to validity, as it mainly speaks to the accuracy of the research product. The criteria of dependability, on the other hand, is similar to reliability. As we just reviewed, reliability is the consistency of a measure. If you give the same measure each time, you should get similar results. However, qualitative research questions, hypotheses, and interview questions may change during the research process. How can one achieve reliability under such conditions?

Because emergence is built into the procedures of qualitative data analysis, there isn’t a need for everyone to get the exact same questions each time. Indeed, because qualitative research understands the importance of context, it would be impossible to control all of the things that would make a qualitative measure the same when you give it to each person. The location, timing, or even the weather can and do influence participants to respond differently. Researchers assessing dependability make sure that proper qualitative procedures were followed and that any changes that emerged during the research process are accounted for, justified, and described in the final report. Researchers should document changes to their methodology and the justification for them in a journal or log. In addition, researchers may again use another qualitative researcher to examine their logs and results to ensure dependability.

Finally, the criteria of confirmability refers to the degree to which the results reported are linked to the data obtained from participants. While it is possible that another researcher could view the same data and come up with a different analysis, confirmability ensures that a researcher’s results are actually grounded in what participants said. Another researcher should be able to read the results of your study and trace each point made back to something specific that one or more participants shared. This process is called an audit.

The criteria for trustworthiness were created as a reaction to critiques of qualitative research as unscientific (Guba, 1990). Guba, E. G. (1990). The paradigm dialog. Newbury Park, CA: Sage Publications. They demonstrate that qualitative research is equally as rigorous as quantitative research. Subsequent scholars conceptualized the dimension of authenticity without referencing the standards of quantitative research at all. Instead, they wanted to understand the rigor of qualitative research on its own terms. What comes from acknowledging the importance of the words and meanings that people use to express their experiences?

While there are multiple criteria for authenticity, the one that is most important for undergraduate social work researchers to understand is fairness. Fairness refers to the degree to which “different constructions, perspectives, and positions are not only allowed to emerge, but are also seriously considered for merit and worth” (Rodwell, 1998, p. 107). Qualitative researchers, depending on their design, may involve participants in the data analysis process, try to equalize power dynamics among participants, and help negotiate consensus on the final interpretation of the data. As you can see from the talk of power dynamics and consensus-building, authenticity attends to the social justice elements of social work research.

After fairness, the criteria for authenticity become more radical, focusing on transforming individuals and systems examined in the study. For our purposes, it is important for you to know that qualitative research and measurement are conducted with the same degree of rigor as quantitative research. The standards may be different, but they speak to the goals of accurate and consistent results that reflect the views of the participants in the study.


Key Takeaways

  • Reliability is a matter of consistency.
  • Validity is a matter of accuracy.
  • There are many types of validity and reliability.
  • The criteria that qualitative researchers use to assess rigor are trustworthiness and authenticity.
  • Quantitative research is not inherently more rigorous than qualitative research. Both are equally rigorous, though the standards for assessing rigor differ between the two.


Glossary

  • Authenticity- the degree to which researchers capture the multiple perspectives and values of participants in their study and foster change across participants and systems during their analysis
  • Concurrent validity- if a measure is able to predict outcomes from an established measure given at the same time
  • Confirmability- the degree to which the results reported are linked to the data obtained from participants
  • Content validity- if the measure includes all of the possible meanings of the concept
  • Convergent validity- if a measure is conceptually similar to an existing measure of the same concept
  • Credibility- the degree to which the results are accurate and viewed as important and believable by participants
  • Dependability- ensures that proper qualitative procedures were followed and that any changes that emerged during the research process are accounted for, justified, and described in the final report
  • Discriminant validity- if a measure is not related to measures to which it shouldn’t be statistically correlated
  • Face validity- if it is plausible that the measure measures what it intends to
  • Fairness- the degree to which “different constructions, perspectives, and positions are not only allowed to emerge, but are also seriously considered for merit and worth” (Rodwell, 1998, p. 107)
  • Internal consistency reliability- degree to which scores on each question of a scale are correlated with each other
  • Inter-rater reliability- the degree to which different observers agree on what happened
  • Predictive validity- if a measure predicts things it should be able to predict in the future
  • Reliability- a measure’s consistency.
  • Test-retest reliability- if a measure is given multiple times, the results will be consistent each time
  • Trustworthiness- the “truth value, applicability, consistency, and neutrality” of the results of a research study (Rodwell, 1998, p. 96)
  • Validity- a measure’s accuracy


Image attributions

Quality by geralt CC-0

Trust by Terry Johnston CC-BY-2.0


44

9.5 Complexities in quantitative measurement

Learning Objectives

  • Define and provide examples for the four levels of measurement
  • Identify potential sources of error
  • Differentiate between systematic and random error


For quantitative methods, you should now have some idea about how conceptualization and operationalization work, and you should also know how to assess the quality of your measures. But measurement is sometimes a complex process, and some concepts are more complex than others. Measuring a person’s political party affiliation, for example, is less complex than measuring their sense of alienation. In this section, we’ll consider some of these complexities in measurement. First, we’ll take a look at the various levels of measurement that exist, and then we’ll consider how measures can be subject to bias and error.

Levels of measurement

 When social scientists measure concepts, they sometimes use the language of variables and attributes. A variable refers to a grouping of several characteristics. Attributes are the characteristics that make up a variable. For example, the variable hair color would contain attributes like blonde, brown, black, red, gray, etc. A variable’s attributes determine its level of measurement. There are four possible levels of measurement: nominal, ordinal, interval, and ratio. The first two levels of measurement are categorical, meaning their attributes are categories rather than numbers. The latter two levels of measurement are continuous, meaning their attributes are numbers, not categories.

Hair color is an example of a nominal level of measurement. Nominal measures are categorical, and those categories cannot be mathematically ranked. As a brown-haired person (with some gray), I can’t say for sure that brown-haired people are better than blonde-haired people. There is no ranking order between hair colors. They are simply different. That is what constitutes a nominal level of measurement. Gender and race are also measured at the nominal level.

But what attributes are contained in the variable hair color? Blonde, brown, black, and red are common colors. However, if we listed only these attributes, my wife, who currently has purple hair, wouldn’t fit anywhere. That means our attributes were not exhaustive. Exhaustiveness means that all possible attributes are listed. We may have to list a lot of colors before we can meet the criteria of exhaustiveness. Clearly, there is a point at which exhaustiveness has been reasonably met. If a person insists that their hair color is light burnt sienna, it is not your responsibility to list that as an option. Rather, that person would reasonably be described as brown-haired. Perhaps listing a category for other color would suffice to make our list of colors exhaustive.

What about a person who has multiple hair colors at the same time, such as red and black? They would fall into multiple attributes. This violates the rule of mutual exclusivity, in which a person cannot fall into two different attributes. Instead of listing all of the possible combinations of colors, perhaps you might include a multi-color attribute to describe people with more than one hair color.

The discussion of hair color elides an important point with measurement—reification. You should remember reification from our previous discussion in this chapter. For many years, the attributes for gender were male and female. Now, our understanding of gender has evolved to encompass more attributes including transgender, non-binary, or genderqueer. Children of parents from different races were often classified as one race or another, even if they identified with both cultures equally. The option for bi-racial or multi-racial on a survey not only more accurately reflects the racial diversity in the real world but validates and acknowledges people who identify in that manner.

Unlike nominal-level measures, attributes at the ordinal level can be rank ordered. For example, someone’s degree of satisfaction in their romantic relationship can be ordered by rank. That is, you could say you are not at all satisfied, a little satisfied, moderately satisfied, or highly satisfied. Note that even though these have a rank order to them (not at all satisfied is certainly worse than highly satisfied), we cannot calculate a mathematical distance between those attributes. We can simply say that one attribute of an ordinal-level variable is more or less than another attribute.

This can get a little confusing when using Likert scales. If you have ever taken a customer satisfaction survey or completed a course evaluation for school, you are familiar with Likert scales. “On a scale of 1-5, with one being the lowest and 5 being the highest, how likely are you to recommend our company to other people?” Sound familiar? Likert scales use numbers but only as a shorthand to indicate what attribute (highly likely, somewhat likely, etc.) the person feels describes them best. You wouldn’t say you are “2” more likely to recommend the company. But you could say you are not very likely to recommend the company. Ordinal-level attributes must also be exhaustive and mutually exclusive, as with nominal-level variables.

a cartoon of a person choosing between a happy, neutral, and sad face

At the interval level, attributes must also be exhaustive and mutually exclusive. As well, the distance between attributes is known to be equal. Interval measures are also continuous, meaning their attributes are numbers, rather than categories. IQ scores are interval level, as are temperatures. Interval-level variables are not particularly common in social science research, but their defining characteristic is that we can say how much more or less one attribute differs from another. We cannot, however, say with certainty what the ratio of one attribute is in comparison to another. For example, it would not make sense to say that 50 degrees is half as hot as 100 degrees.

Finally, at the ratio level, attributes are mutually exclusive and exhaustive, attributes can be rank ordered, the distance between attributes is equal, and attributes have a true zero point. Thus, with these variables, we can say what the ratio of one attribute is in comparison to another. Examples of ratio-level variables include age and years of education. We know, for example, that a person who is 12 years old is twice as old as someone who is 6 years old. The differences between each level of measurement are visualized in Table 9.1.

Table 9.1 Criteria for Different Levels of Measurement
Nominal Ordinal Interval Ratio
Exhaustive X X X X
Mutually exclusive X X X X
Rank-ordered X X X
Equal distance between attributes X X
True zero point X

Challenges in measurement

Unfortunately, measures never perfectly describe what exists in the real world. Good measures demonstrate validity and reliability but will always have some degree of error. Systematic error causes our measures to consistently output incorrect data, usually due to an identifiable process. Imagine you created a measure of height, but you didn’t put an option for anyone over six feet tall. If you gave that measure to your local college or university, some of the taller members of the basketball team might not be measured accurately. In fact, you would be under the mistaken impression that the tallest person at your school was six feet tall, when in actuality there are likely people taller than six feet at your school. This error seems innocent, but if you were using that measure to help you build a new building, those people might hit their heads!

A less innocent form of error arises when researchers using question wording that might cause participants to think one answer choice is preferable to another. For example, if I were to ask you “Do you think global warming is caused by human activity?” you would probably feel comfortable answering honestly. But what if I asked you “Do you agree with 99% of scientists that global warming is caused by human activity?” Would you feel comfortable saying no, if that’s what you honestly felt? I doubt it. That is an example of a leading question, a question with wording that influences how a participant responds. We’ll discuss leading questions and other problems in question wording in greater detail in Chapter 11.


two cartoon people, one with question marks emanating from their head another with lightbulbs

In addition to error created by the researcher, your participants can cause error in measurement. Some people will respond without fully understanding a question, particularly if the question is worded in a confusing way. That’s one source of error. Let’s consider another. If we asked people if they always washed their hands after using the bathroom, would we expect people to be perfectly honest? Polling people about whether they wash their hands after using the bathroom might only elicit what people would like others to think they do, rather than what they actually do. This is an example of social desirability bias, in which participants in a research study want to present themselves in a positive, socially desirable way to the researcher. People in your study will want to seem tolerant, open-minded, and intelligent, but their true feelings may be closed-minded, simple, and biased. So, they lie. This occurs often in political polling, which may show greater support for a candidate from a minority race, gender, or political party than actually exists in the electorate.

A related form of bias is called acquiescence bias, also known as “yea-saying.” It occurs when people say yes to whatever the researcher asks, even when doing so contradicts previous answers. For example, a person might say yes to both “I am a confident leader in group discussions” and “I feel anxious interacting in group discussions.” Those two responses are unlikely to both be true for the same person. Why would someone do this? Similar to social desirability, people want to be agreeable and nice to the researcher asking them questions or they might ignore contradictory feelings when responding to each question. Respondents may also act on cultural reasons, trying to “save face” for themselves or the person asking the questions. Regardless of the reason, the results of your measure don’t match what the person truly feels.

So far, we have discussed sources of error that come from choices made by respondents or researchers. Usually, systematic errors will result in responses that are incorrect in one direction or another. For example, social desirability bias usually means more people will say they will vote for a third party in an election than actually do. Systematic errors such as these can be reduced, but there is another source of error in measurement that can never be eliminated, and that is random error. Unlike systematic error, which biases responses consistently in one direction or another, random error is unpredictable and does not consistently result in scores that are consistently higher or lower on a given measure. Instead, random error is more like statistical noise, which will likely average out across participants.


coffee spilled on papers

Random error is present in any measurement. If you’ve ever stepped on a bathroom scale twice and gotten two slightly different results, maybe a difference of a tenth of a pound, then you’ve experienced random error. Maybe you were standing slightly differently or had a fraction of your foot off of the scale the first time. If you were to take enough measures of your weight on the same scale, you’d be able to figure out your true weight. In social science, if you gave someone a scale measuring depression on a day after they lost their job, they would likely score differently than if they had just gotten a promotion and a raise. Even if the person were clinically depressed, our measure is subject to influence by the random occurrences of life. Thus, social scientists speak with humility about our measures. We are reasonably confident that what we found is true, but we must always acknowledge that our measures are only an approximation of reality.

Humility is important in scientific measurement, as errors can have real consequences. At the time of the writing of this textbook, my wife and I are expecting our first child. Like most people, we used a pregnancy test from the pharmacy. If the test said my wife was pregnant when she was not pregnant, that would be a false positive. On the other hand, if the test indicated that she was not pregnant when she was in fact pregnant, that would be a false negative. Even if the test is 99% accurate, that means that one in a hundred women will get an erroneous result when they use a home pregnancy test. For us, a false positive would have been initially exciting, then devastating when we found out we were not having a child. A false negative would have been disappointing at first and then quite shocking when we found out we were indeed having a child. While both false positives and false negatives are not very likely for home pregnancy tests (when taken correctly), measurement error can have consequences for the people being measured.


Key Takeaways

  • In social science, our variables can be one of four different levels of measurement: nominal, ordinal, interval, or ratio.
  • Systematic error may arise from the researcher, participant, or measurement instrument.
  • Systematic error biases results in a particular direction, whereas random error can be in any direction.
  • All measures are prone to error and should interpreted with humility.


Glossary

  • Acquiescence bias- when respondents say yes to whatever the researcher asks
  • Attributes- are the characteristics that make up a variable
  • Categorical measures- a measure with attributes that are categories
  • Continuous measures- a measures with attributes that are numbers
  • Exhaustiveness- all possible attributes are listed
  • False negative- when a measure does not indicate the presence of a phenomenon, when in reality it is present
  • False positive- when a measure indicates the presence of a phenomenon, when in reality it is not present
  • Interval level- a level of measurement that is continuous, can be rank ordered, is exhaustive and mutually exclusive, and for which the distance between attributes is known to be equal
  • Leading question- a question with wording that influences how a participant responds
  • Likert scales- ordinal measures that use numbers as a shorthand (e.g., 1=highly likely, 2=somewhat likely, etc.) to indicate what attribute the person feels describes them best
  • Mutual exclusivity- a person cannot identify with two different attributes simultaneously
  • Nominal- level of measurement that is categorical and those categories cannot be mathematically ranked, though they are exhaustive and mutually exclusive
  • Ordinal- level of measurement that is categorical, those categories can be rank ordered, and they are exhaustive and mutually exclusive
  • Random error- unpredictable error that does not consistently result in scores that are consistently higher or lower on a given measure
  • Ratio level- level of measurement in which attributes are mutually exclusive and exhaustive, attributes can be rank ordered, the distance between attributes is equal, and attributes have a true zero point
  • Social desirability bias- when respondents answer based on what they think other people would like, rather than what is true
  • Systematic error- measures consistently output incorrect data, usually in one direction and due to an identifiable process
  • Variable- refers to a grouping of several characteristics


Image attributions

user satisfaction by mcmurryjulie CC-0

question by jambulboy CC-0

mistake by stevepb CC-0


X

10. Sampling

45

10.0 Chapter introduction

Sampling involves selecting a subset of a population and drawing conclusions from that subset. How you sample and who you sample shapes what conclusions you are able to draw. Ultimately, this chapter focuses on questions about the who or the what that you want to be able to make claims about in your research. In the following sections, we’ll define sampling, discuss different types of sampling strategies, and consider how to judge the quality of samples as consumers and creators of social scientific research.

Chapter Outline

Content Advisory

This chapter discusses or mentions the following topics: cancer, substance abuse, homelessness, anti-LGBTQ discrimination, mental health, sexually transmitted infections, and intimate partner violence.

46

10.1 Basic concepts of sampling

Learning Objectives

  • Differentiate between populations, sampling frames, and samples
  • Describe inclusion and exclusion criteria
  • Explain recruitment of participants in a research project


In social scientific research, a population is the cluster of people you are most interested in; it is often the “who” that you want to be able to say something about at the end of your study. Populations in research may be rather large, such as “the American people,” but they are more typically a little less vague than that. For example, a large study for which the population of interest really is the American people will likely specify which American people, such as adults over the age of 18 or citizens or legal permanent residents.

As I’ve now said a couple of times, it is quite rare for a researcher to gather data from their entire population of interest. This might sound surprising or disappointing until you think about the kinds of research questions that social workers typically ask. For example, let’s say we wish to answer the following research question: “How does gender impact success in a batterer intervention program?” Would you expect to be able to collect data from all people in batterer intervention programs across all nations from all historical time periods? Unless you plan to make answering this research question your entire life’s work (and then some), I’m guessing your answer is a resounding no. So, what to do? Does not having the time or resources to gather data from every single person of interest mean having to give up your research interest?

Absolutely not. Instead, researchers use what’s called a sampling frame as an intermediate point between the overall population and the sample that is drawn. A sampling frame is a—real or hypothetical—list of people from which you will draw your sample. But where do you find a sampling frame? Answering this question is the first step in conducting human subjects research. Social work researchers must think about locations or groups in which your target population gathers or interacts. For example, a study on quality of care in nursing homes may choose a local nursing home because it’s easy to access. The sampling frame could be all of the patients at the nursing home. You would select your participants for your study from the list of patients at the nursing home. Note that this is a real list. That is, an administrator at the nursing home would give you a list with every resident’s name on it from which you would select your participants. If you decided to include more nursing homes in your study, then your sampling frame could be all of the patients at all of the nursing homes you included.


groups of objects arranged by color

The nursing home example is perhaps an easy one. Let’s consider some more examples. Unlike nursing home patients, cancer survivors do not live in an enclosed location and may no longer receive treatment at a hospital or clinic. For social work researchers to reach participants, they may consider partnering with a support group that services this population. Perhaps there is a support group at a local church in which survivors may cycle in and out based on need. Without a set list of people, your sampling frame would simply be the people who showed up to the support group on the nights you were there, which is an imaginary list.

More challenging still is recruiting people who are homeless, those with very low income, or people who belong to stigmatized groups. For example, a research study by Johnson and Johnson (2014) Johnson, P. S., & Johnson, M. W. (2014). Investigation of “bath salts” use patterns within an online sample of users in the United States. Journal of psychoactive drugs46(5), 369-378. attempted to learn usage patterns of “bath salts,” or synthetic stimulants that are marketed as “legal highs.” Users of “bath salts” don’t often gather for meetings, and reaching out to individual treatment centers is unlikely to produce enough participants for a study as use of bath salts is rare. To reach participants, these researchers ingeniously used online discussion boards in which users of these drugs share information. Their sampling frame included everyone who participated in the online discussion boards during the time they collected data. Regardless of whether a sampling frame is easy or challenging, the first rule of sampling is: go where your participants are.

Once you have an idea of where your participants are, you need to recruit your participants into your study. Recruitment refers to the process by which the researcher informs potential participants about the study and attempts to get them to participate. Recruitment comes in many different forms. If you have ever received a phone call asking for you to participate in a survey, someone has attempted to recruit you for their study. Perhaps you’ve seen print advertisements on buses, in student centers, or in a periodical. I’ve received many emails that were passed around my school asking for participants, usually for a graduate student. (As an aside, researchers sometimes speak of “research karma.” If you participate in others’ research studies, they will participate in yours.)  As we learn more about specific types of sampling, make sure your recruitment strategy makes sense with your sampling approach. For example, if you put up a flyer in the student health office to recruit for your study, you would likely be using availability or convenience sampling.


two women shaking hands

As you think about sampling frame and recruitment, another level of specificity that researchers add at this stage is deciding if there are certain characteristics or attributes that individuals must have if they participate in your study. These are known as inclusion and exclusion criteria. Inclusion criteria are the characteristics a person must possess in order to be included in your sample. If you were conducting a survey on LGBTQ discrimination at your agency, you might want to sample only clients who identify as LGBTQ. In that case, your inclusion criteria for your sample would be that individuals have to identify as LGBTQ. Comparably, exclusion criteria are characteristics that disqualify a person from being included in your sample. In the previous example, you could think of heterosexuality as one of your exclusion criteria because no person who identifies as heterosexual would be included in your sample. Exclusion criteria are often like the mirror image of inclusion criteria. However, there may be other criteria by which we want to exclude people from our sample. For example, we may exclude clients who were recently discharged or those who have just begun to receive services.

Once you find a sampling frame from which you can recruit your participants, you end up with a sample. A sample is the group of people you successfully recruit from your sampling frame to participate in your study. If you are a participant in a research project—answering survey questions, participating in interviews, etc.—you are part of the sample of that research project. Some research projects social workers may engage in don’t use people at all. Instead of people, the elements selected for inclusion into a sample are documents, including client records, blog entries, or television shows. A researcher conducting this kind of analysis, described in detail in Chapter 14, still goes through the stages of sampling—identifying a sampling frame, applying inclusion criteria, and gathering the sample.

Applying sampling terms

Sampling terms can be a bit daunting at first. However, with some practice, they will become second nature. Let’s walk through an example from a research project of mine. I am currently collecting data for a research project on how much it costs to become a licensed clinical social worker or LCSW. An LCSW is necessary for private clinical practice and is used by supervisors in human service organizations to sign off on clinical charts from less credentialed employees, as well as provide clinical supervision. If you are interested in providing clinical services as a social worker, you should become familiar with the licensing laws in your state.


concentric circles with population on the outside, sampling frame next, and sample in the middle circle
Figure 10.1 Sampling terms by size

Using Figure 10.1 as a guide, my population is clearly clinical social workers, as these are the people about whom I want to draw conclusions. The next step inward would be a sampling frame. Unfortunately, there is no list of every licensed clinical social worker in the United States. I could write to each state’s social work licensing board and ask for a list of names and addresses, perhaps even using a Freedom of Information Act request if they were unwilling to share the information. That option sounds time-consuming and has a low likelihood of success. Instead, I tried to figure out where social workers are likely to congregate. I considered setting up a booth at a National Association of Social Workers (NASW) conference and asking people to participate in my survey. Ultimately, this would prove too costly, and I wouldn’t be able to draw a truly random sample. I finally discovered the NASW membership email list, which is available to advertisers, including researchers advertising for research projects. While the NASW list does not contain every social worker, it reaches over one hundred thousand social workers via email regularly through its monthly newsletter.

My sampling frame became the members of the NASW membership list. I decided to recruit 5000 participants because I knew that email advertisements don’t have the best return rates. I sent a recruitment email to the 5000 participants and specified that I only wanted to hear from social workers who were either currently or recently received clinical supervision for licensure—my inclusion criteria. This was important because many of the people on the NASW membership list may not be licensed. While I would love it if my sample were all 5000 participants I attempted to recruit, my actual sample contained only 150 people. These are the people I successfully recruited using my email advertisement—the people who filled out my survey on licensure.

From this example, you can see that sampling is a process. The process flows sequentially from figuring out your target population to thinking about where to find people from your target population to finding a real or imaginary list of people in your population to recruiting people from that list to be a part of your sample. Through the sampling process, you must consider where people in your target population are likely to be and how best to get their attention for your study. Sampling can be an easy process, like calling every 100th name from the phone book one afternoon, or challenging, like standing every day for a few weeks in an area in which people who are homeless gather for shelter. In either case, your goal is to recruit enough people who will participate in your study so you can learn about your population.

In the next two sections of this chapter, we will discuss sampling approaches, also known as sampling techniques or types of samples. Sampling approach determines how a researcher selects people from the sampling frame to recruit into her sample. Because the goals of qualitative and quantitative research differ, so too does the sampling approach. Quantitative approaches allow researchers to make claims about populations that are much larger than their actual sample with a fair amount of confidence. Qualitative approaches are designed to allow researchers to make conclusions that are specific to one time, place, context, and group of people. We will review both of these approaches to sampling in the coming sections of this chapter. First, we examine sampling types and techniques used in qualitative research. After that, we’ll look at how sampling typically works in quantitative research.


Key Takeaways

  • A population is the group who is the main focus of a researcher’s interest; a sample is the group from whom the researcher actually collects data.
  • Sampling involves selecting the observations that you will analyze.
  • To conduct sampling, a researcher starts by going where your participants are.
  • Sampling frames can be real or imaginary.
  • Recruitment involves informing potential participants about your study and seeking their participation.


Glossary

  • Exclusion criteria- characteristics that disqualify a person from being included in a sample
  • Inclusion criteria- the characteristics a person must possess in order to be included in a sample
  • Population- the cluster of people about whom a researcher is most interested
  • Recruitment- the process by which the researcher informs potential participants about the study and attempts to get them to participate
  • Sample- the group of people you successfully recruit from your sampling frame to participate in your study
  • Sampling frame- a real or hypothetical list of people from which a researcher will draw her sample


Image attributions

crowd by mwewering CC-0

job interview by styles66 CC-0


47

10.2 Sampling in qualitative research

Learning Objectives

  • Define nonprobability sampling, and describe instances in which a researcher might choose a nonprobability sampling technique
  • Describe the different types of nonprobability samples


Qualitative researchers typically make sampling choices that enable them to achieve a deep understanding of whatever phenomenon it is that they are studying. In this section, we’ll examine the techniques that qualitative researchers typically employ when sampling as well as the various types of samples that qualitative researchers are most likely to use in their work.

Nonprobability sampling

Nonprobability sampling refers to sampling techniques for which a person’s likelihood of being selected for membership in the sample is unknown. Because we don’t know the likelihood of selection, we don’t know with nonprobability samples whether a sample is truly representative of a larger population. But that’s okay. Generalizing to a larger population is not the goal with nonprobability samples or qualitative research. That said, the fact that nonprobability samples do not represent a larger population does not mean that they are drawn arbitrarily or without any specific purpose in mind (that would mean committing one of the errors of informal inquiry discussed in Chapter 1). We’ll take a closer look at the process of selecting research elements when drawing a nonprobability sample. But first, let’s consider why a researcher might choose to use a nonprobability sample.


two people filling out a clipboard survey in a crowd of people

When are nonprobability samples ideal? One instance might be when we’re starting a big research project. For example, if we’re conducting survey research, we may want to administer a draft of our survey to a few people who seem to resemble the folks we’re interested in studying in order to help work out kinks in the survey. We might also use a nonprobability sample if we’re conducting a pilot study or some exploratory research. This can be a quick way to gather some initial data and help us get some idea of the lay of the land before conducting a more extensive study. From these examples, we can see that nonprobability samples can be useful for setting up, framing, or beginning research, even quantitative research. But it isn’t just early stage research that relies on and benefits from nonprobability sampling techniques. Researchers also use nonprobability samples in full-blown research projects. These projects are usually qualitative in nature, where the researcher’s goal is in-depth, idiographic understanding rather than more general, nomothetic understanding.

Types of nonprobability samples

There are several types of nonprobability samples that researchers use. These include purposive samples, snowball samples, quota samples, and convenience samples. While the latter two strategies may be used by quantitative researchers from time to time, they are more typically employed in qualitative research, and because they are both nonprobability methods, we include them in this section of the chapter.

To draw a purposive sample, a researcher selects participants from their sampling frame because they have characteristics that the researcher desires. A researcher begins with specific characteristics in mind that she wishes to examine and then seeks out research participants who cover that full range of characteristics. For example, if you are studying mental health supports on your campus, you may want to be sure to include not only students, but mental health practitioners and student affairs administrators. You might also select students who currently use mental health supports, those who dropped out of supports, and those who are waiting to receive supports. The purposive part of purposive sampling comes from selecting specific participants on purpose because you already know they have characteristics—being an administrator, dropping out of mental health supports—that you need in your sample.

Note that these are different than inclusion criteria, which are more general requirements a person must possess to be a part of your sample. For example, one of the inclusion criteria for a study of your campus’ mental health supports might be that participants had to have visited the mental health center in the past year. That is different than purposive sampling. In purposive sampling, you know characteristics of individuals and recruit them because of those characteristics. For example, I might recruit Jane because she stopped seeking supports this month, JD because she has worked at the center for many years, and so forth.

Also, it’s important to recognize that purposive sampling requires you to have prior information about your participants before recruiting them because you need to know their perspectives or experiences before you know whether you want them in your sample. This is a common mistake that many students make. What I often hear is, “I’m using purposive sampling because I’m recruiting people from the health center,” or something like that. That’s not purposive sampling. Purposive sampling is recruiting specific people because of the various characteristics and perspectives they bring to your sample. Imagine we were creating a focus group. A purposive sample might gather clinicians, patients, administrators, staff, and former patients together so they can talk as a group. Purposive sampling would seek out people that have each of those attributes.

Quota sampling is another nonprobability sampling strategy that takes purposive sampling one step further. When conducting quota sampling, a researcher identifies categories that are important to the study and for which there is likely to be some variation. Subgroups are created based on each category, and the researcher decides how many people to include from each subgroup and collects data from that number for each subgroup. Let’s consider a study of student satisfaction with on-campus housing. Perhaps there are two types of housing on your campus: apartments that include full kitchens and dorm rooms where residents do not cook for themselves and instead eat in a dorm cafeteria. As a researcher, you might wish to understand how satisfaction varies across these two types of housing arrangements. Perhaps you have the time and resources to interview 20 campus residents, so you decide to interview 10 from each housing type. It is possible as well that your review of literature on the topic suggests that campus housing experiences vary by gender. If that is that case, perhaps you’ll decide on four important subgroups: men who live in apartments, women who live in apartments, men who live in dorm rooms, and women who live in dorm rooms. Your quota sample would include five people from each of the four subgroups.

In 1936, up-and-coming pollster George Gallup made history when he successfully predicted the outcome of the presidential election using quota sampling methods. The leading polling entity at the time, The Literary Digest, predicted that Alfred Landon would beat Franklin Roosevelt in the presidential election by a landslide, but Gallup’s polling disagreed. Gallup successfully predicted Roosevelt’s win and subsequent elections based on quota samples, but in 1948, Gallup incorrectly predicted that Dewey would beat Truman in the US presidential election. For more information about the 1948 election and other historically significant dates related to measurement, see the PBS timeline of “The first measured century” at http://www.pbs.org/fmc/timeline/e1948election.htm. Among other problems, the fact that Gallup’s quota categories did not represent those who actually voted (Neuman, 2007) Neuman, W. L. (2007). Basics of social research: Qualitative and quantitative approaches (2nd ed.). Boston, MA: Pearson. underscores the point that one should avoid attempting to make statistical generalizations from data collected using quota sampling methods. If you are interested in the history of polling, I recommend reading Fried, A. (2011). Pathways to polling: Crisis, cooperation, and the making of public opinion professions. New York, NY: Routledge. While quota sampling offers the strength of helping the researcher account for potentially relevant variation across study elements, it would be a mistake to think of this strategy as yielding statistically representative findings. For that, you need probability sampling, which we will discuss in the next section.

Qualitative researchers can also use snowball sampling techniques to identify study participants. In snowball sampling, a researcher identifies one or two people she’d like to include in her study but then relies on those initial participants to help identify additional study participants. Thus, the researcher’s sample builds and becomes larger as the study continues, much as a snowball builds and becomes larger as it rolls through the snow. Snowball sampling is an especially useful strategy when a researcher wishes to study a stigmatized group or behavior. For example, a researcher who wanted to study how people with genital herpes cope with their medical condition would be unlikely to find many participants by posting a call for interviewees in the newspaper or making an announcement about the study at some large social gathering. Instead, the researcher might know someone with the condition, interview that person, and ask the person to refer others they may know with the genital herpes to contact you to participate in the study. Having a previous participant vouch for the researcher may help new potential participants feel more comfortable about being included in the study.


a person pictured next to a network of associates and their interrelationships noted through lines connecting the photos

Snowball sampling is sometimes referred to as chain referral sampling. One research participant refers another, and that person refers another, and that person refers another—thus a chain of potential participants is identified. In addition to using this sampling strategy for potentially stigmatized populations, it is also a useful strategy to use when the researcher’s group of interest is likely to be difficult to find, not only because of some stigma associated with the group, but also because the group may be relatively rare. This was the case for Steven Kogan and colleagues (Kogan, Wejnert, Chen, Brody, & Slater, 2011) Kogan, S. M., Wejnert, C., Chen, Y., Brody, G. H., & Slater, L. M. (2011). Respondent-driven sampling with hard-to-reach emerging adults: An introduction and case study with rural African Americans. Journal of Adolescent Research, 26, 30–60. who wished to study the sexual behaviors of non-college-bound African American young adults who lived in high-poverty rural areas. The researchers first relied on their own networks to identify study participants, but because members of the study’s target population were not easy to find, access to the networks of initial study participants was very important for identifying additional participants. Initial participants were given coupons to pass on to others they knew who qualified for the study. Participants were given an added incentive for referring eligible study participants; they received $50 for participating in the study and an additional $20 for each person they recruited who also participated in the study. Using this strategy, Kogan and colleagues succeeded in recruiting 292 study participants.

Finally, convenience sampling is another nonprobability sampling strategy that is employed by both qualitative and quantitative researchers. To draw a convenience sample, a researcher simply collects data from those people or other relevant elements to which she has most convenient access. This method, also sometimes referred to as availability sampling, is most useful in exploratory research or in student projects in which probability sampling is too costly or difficult. If you’ve ever been interviewed by a fellow student for a class project, you have likely been a part of a convenience sample. While convenience samples offer one major benefit—convenience—they do not offer the rigor needed to make conclusions about larger populations. That is the subject of our next section on probability sampling.

Table 10.1 Types of nonprobability samples
Sample type Description
Purposive Researcher seeks out participants with specific characteristics.
Snowball Researcher relies on participant referrals to recruit new participants.
Quota Researcher selects cases from within several different subgroups.
Convenience Researcher gathers data from whatever cases happen to be convenient.


Key Takeaways

  • Nonprobability samples might be used when researchers are conducting qualitative (or idiographic) research, exploratory research, student projects, or pilot studies.
  • There are several types of nonprobability samples including purposive samples, snowball samples, quota samples, and convenience samples.


Glossary

  • Convenience sample- researcher gathers data from whatever cases happen to be convenient
  • Nonprobability sampling- sampling techniques for which a person’s likelihood of being selected for membership in the sample is unknown
  • Purposive sample- when a researcher seeks out participants with specific characteristics
  • Quota sample- when a researcher selects cases from within several different subgroups
  • Snowball sample- when a researcher relies on participant referrals to recruit new participants


Image attributions

business by helpsg CC-0

network by geralt CC-0


48

10.3 Sampling in quantitative research

Learning Objectives

  • Describe how probability sampling differs from nonprobability sampling
  • Define generalizability, and describe how it is achieved in probability samples
  • Identify the various types of probability samples, and describe why a researcher may use one type over another


Quantitative researchers are often interested in making generalizations about groups larger than their study samples; they seek nomothetic causal explanations. While there are certainly instances when quantitative researchers rely on nonprobability samples (e.g., when doing exploratory research), quantitative researchers tend to rely on probability sampling techniques. The goals and techniques associated with probability samples differ from those of nonprobability samples. We’ll explore those unique goals and techniques in this section.

Probability sampling

Unlike nonprobability sampling, probability sampling refers to sampling techniques for which a person’s likelihood of being selected from the sampling frame is known. You might ask yourself why we should care about a potential participant’s likelihood of being selected for the researcher’s sample. The reason is that, in most cases, researchers who use probability sampling techniques are aiming to identify a representative sample from which to collect data. A representative sample is one that resembles the population from which it was drawn in all the ways that are important for the research being conducted. If, for example, you wish to be able to say something about differences between men and women at the end of your study, you better make sure that your sample doesn’t contain only women. That’s a bit of an oversimplification, but the point with representativeness is that if your population varies in some way that is important to your study, your sample should contain the same sorts of variation.


animated people walking in unison in a crowd

Obtaining a representative sample is important in probability sampling because of generalizability. In fact, generalizability is perhaps the key feature that distinguishes probability samples from nonprobability samples. Generalizability refers to the idea that a study’s results will tell us something about a group larger than the sample from which the findings were generated. In order to achieve generalizability, a core principle of probability sampling is that all elements in the researcher’s sampling frame have an equal chance of being selected for inclusion in the study. In research, this is the principle of random selection. Researchers use a computer’s random number generator to determine who from the sampling frame gets recruited into the sample.

Using random selection does not mean that your sample will be perfect. No sample is perfect. The only way to come with a perfect result would be to include everyone in the population in your sample, which defeats the whole point of sampling. Generalizing from a sample to a population always contains some degree of error. This is referred to as sampling error, a statistical calculation of the difference between results from a sample and the actual parameters of a population.

Generalizability is a pretty easy concept to grasp. Imagine a professor were to take a sample of individuals in your class to see if the material is too hard or too easy. The professor, however, only sampled individuals whose grades were over 90% in the class. Would that be a representative sample of all students in the class? That would be a case of sampling error—a mismatch between the results of the sample and the true feelings of the overall class. In other words, the results of the professor’s study don’t generalize to the overall population of the class.

Taking this one step further, imagine your professor is conducting a study on binge drinking among college students. The professor uses undergraduates at your school as her sampling frame. Even if that professor were to use probability sampling, perhaps your school differs from other schools in important ways. There are schools that are “party schools” where binge drinking may be more socially accepted, “commuter schools” at which there is little nightlife, and so on. If your professor plans to generalize her results to all college students, she will have to make an argument that her sampling frame (undergraduates at your school) is representative of the population (all undergraduate college students).

Types of probability samples

There are a variety of probability samples that researchers may use. These include simple random samples, systematic samples, stratified samples, and cluster samples. Let’s build on the previous example. Imagine we were concerned with binge drinking and chose the target population of fraternity members. How might you go about getting a probability sample of fraternity members that is representative of the overall population?


three dice hitting the ground under a spotlight

Simple random samples are the most basic type of probability sample. A simple random sample requires a real sampling frame—an actual list of each person in the sampling frame. Your school likely has a list of all of the fraternity members on campus, as Greek life is subject to university oversight. You could use this as your sampling frame. Using the university’s list, you would number each fraternity member, or element, sequentially and then randomly select the elements from which you will collect data.

True randomness is difficult to achieve, and it takes complex computational calculations to do so. Although you think you can select things at random, human-generated randomness is actually quite predictable, as it falls into patterns called heuristics. To truly randomly select elements, researchers must rely on computer-generated help. Many free websites have good pseudo-random number generators. A good example is the website Random.org, which contains a random number generator that can also randomize lists of participants. Sometimes, researchers use a table of numbers that have been generated randomly. There are several possible sources for obtaining a random number table. Some statistics and research methods textbooks offer such tables as appendices to the text.

As you might have guessed, drawing a simple random sample can be quite tedious. Systematic sampling techniques are somewhat less tedious but offer the benefits of a random sample. As with simple random samples, you must possess a list of everyone in your sampling frame. Once you’ve done that, to draw a systematic sample you’d simply select every kth element on your list. But what is k, and where on the list of population elements does one begin the selection process? k is your selection interval or the distance between the elements you select for inclusion in your study. To begin the selection process, you’ll need to figure out how many elements you wish to include in your sample. Let’s say you want to interview 25 fraternity members on your campus, and there are 100 men on campus who are members of fraternities. In this case, your selection interval, or k, is 4. To arrive at 4, simply divide the total number of population elements by your desired sample size. This process is represented in Figure 10.2.


100 frat members divided by 25 fraternity members is 4 which is our selection interval or k
Figure 10.2 Formula for determining selection interval for systematic sample

Figure 10.2 copied from Blackstone, A. (2012) Principles of sociological inquiry: Qualitative and quantitative methods. Saylor Foundation. Retrieved from: https://saylordotorg.github.io/text_principles-of-sociological-inquiry-qualitative-and-quantitative-methods/ Shared under CC-BY-NC-SA 3.0 License (https://creativecommons.org/licenses/by-nc-sa/3.0/)

To determine where on your list of population elements to begin selecting the names of the 25 men you will interview, select a number between 1 and k, and begin there. If we select 3 as our starting point, we’d begin by selecting the third fraternity member on the list and then select every fourth member from there. This might be easier to understand if you can see it visually. Table 10.2 lists the names of our hypothetical 100 fraternity members on campus. You’ll see that the third name on the list has been selected for inclusion in our hypothetical study, as has every fourth name after that. A total of 25 names have been selected.

Table 10.2 Systematic sample of 25 fraternity members
Number  Name Include in study? Number Name Include in study?
1 Jacob 51 Blake Yes
2 Ethan 52 Oliver
3 Michael Yes 53 Cole
4 Jayden 54 Carlos
5 William 55 Jaden Yes
6 Alexander 56 Jesus
7 Noah Yes 57 Alex
8 Daniel 58 Aiden
9 Aiden 59 Eric Yes
10 Anthony 60 Hayden
11 Joshua Yes 61 Brian
12 Mason 62 Max
13 Christopher 63 Jaxon Yes
14 Andrew 64 Brian
15 David Yes 65 Mathew
16 Logan 66 Elijah
17 James 67 Joseph Yes
18 Gabriel 68 Benjamin
19 Ryan Yes 69 Samuel
20 Jackson 70 John
21 Nathan 71 Jonathan Yes
22 Christian 72 Liam
23 Dylan Yes 73 Landon
24 Caleb 74 Tyler
25 Lucas 75 Evan Yes
26 Gavin 76 Nicholas
27 Isaac Yes 77 Braden
28 Luke 78 Angel
29 Brandon 79 Jack
30 Isaiah 80 Jordan
31 Owen Yes 81 Carter
32 Conner 82 Justin
33 Jose 83 Jeremiah Yes
34 Julian 84 Robert
35 Aaron Yes 85 Adrian
36 Wyatt 86 Kevin
37 Hunter 87 Cameron Yes
38 Zachary 88 Thomas
39 Charles Yes 89 Austin
40 Eli 90 Chase
41 Henry 91 Sebastian Yes
42 Jason 92 Levi
43 Xavier Yes 93 Ian
44 Colton 94 Dominic
45 Juan 95 Cooper Yes
46 Josiah 96 Luis
47 Ayden Yes 97 Carson
48 Adam 98 Nathaniel
49 Brody 99 Tristan Yes
50 Diego 100 Parker
In case you’re wondering how I came up with 100 unique names for this table, I’ll let you in on a little secret: lists of popular baby names can be great resources for researchers. I used the list of top 100 names for boys based on Social Security Administration statistics for this table. I often use baby name lists to come up with pseudonyms for field research subjects and interview participants. See Family Education. (n.d.). Name lab. Retrieved from http://baby-names.familyeducation.com/popular-names/boys.

There is one clear instance in which systematic sampling should not be employed. If your sampling frame has any pattern to it, you could inadvertently introduce bias into your sample by using a systemic sampling strategy. (Bias will be discussed in more depth in the next section.) This is sometimes referred to as the problem of periodicity. Periodicity refers to the tendency for a pattern to occur at regular intervals. Let’s say, for example, that you wanted to observe binge drinking on campus each day of the week. Perhaps you need to have your observations completed within 28 days and you wish to conduct four observations on randomly chosen days. Table 10.3 shows a list of the population elements for this example. To determine which days we’ll conduct our observations, we’ll need to determine our selection interval. As you’ll recall from the preceding paragraphs, to do so we must divide our population size, in this case 28 days, by our desired sample size, in this case 4 days. This formula leads us to a selection interval of 7. If we randomly select 2 as our starting point and select every seventh day after that, we’ll wind up with a total of 4 days on which to conduct our observations. You’ll see how that works out in the following table.

Table 10.3 Systematic sample of observation days
Day # Day Drinking Observe? Day # Day Drinking Observe?
1 Monday Low 15 Monday Low
2 Tuesday Low Yes 16 Tuesday Low Yes
3 Wednesday Low 17 Wednesday Low
4 Thursday High 18 Thursday High
5 Friday High 19 Friday High
6 Saturday High 20 Saturday High
7 Sunday Low 21 Sunday Low
8 Monday Low 22 Monday Low
9 Tuesday Low Yes 23 Tuesday Low Yes
10 Wednesday Low 24 Wednesday Low
11 Thursday High 25 Thursday High
12 Friday High 26 Friday High
13 Saturday High 27 Saturday High
14 Sunday Low 28 Sunday Low

Do you notice any problems with our selection of observation days in Table 1? Apparently, we’ll only be observing on Tuesdays. Moreover, Tuesdays may not be an ideal day to observe binge drinking behavior. Unless alcohol consumption patterns have changed significantly since I was in my undergraduate program, I would assume binge drinking is more likely to happen over the weekend.

In cases such as this, where the sampling frame is cyclical, it would be better to use a stratified sampling technique. In stratified sampling, a researcher will divide the study population into relevant subgroups and then draw a sample from each subgroup. In this example, we might wish to first divide our sampling frame into two lists: weekend days and weekdays. Once we have our two lists, we can then apply either simple random or systematic sampling techniques to each subgroup.

Stratified sampling is a good technique to use when, as in our example, a subgroup of interest makes up a relatively small proportion of the overall sample. In our example of a study of binge drinking, we want to include weekdays and weekends in our sample, but because weekends make up less than a third of an entire week, there’s a chance that a simple random or systematic strategy would not yield sufficient weekend observation days. As you might imagine, stratified sampling is even more useful in cases where a subgroup makes up an even smaller proportion of the sampling frame—for example, if we want to be sure to include in our study students who are in year five of their undergraduate program but this subgroup makes up only a small percentage of the population of undergraduates. There’s a chance simple random or systematic sampling strategy might not yield any fifth-year students, but by using stratified sampling, we could ensure that our sample contained the proportion of fifth-year students that is reflective of the larger population.

In this case, class year (e.g., freshman, sophomore, junior, senior, and fifth-year) is our strata, or the characteristic by which the sample is divided. In using stratified sampling, we are often concerned with how well our sample reflects the population. A sample with too many freshmen may skew our results in one direction because perhaps they binge drink more (or less) than students in other class years. Using stratified sampling allows us to make sure our sample has the same proportion of people from each class year as the overall population of the school.

Up to this point in our discussion of probability samples, we’ve assumed that researchers will be able to access a list of population elements in order to create a sampling frame. This, as you might imagine, is not always the case. Let’s say, for example, that you wish to conduct a study of binge drinking across fraternity members at each undergraduate program in your state. Just imagine trying to create a list of every single fraternity member in the state. Even if you could find a way to generate such a list, attempting to do so might not be the most practical use of your time or resources. When this is the case, researchers turn to cluster sampling. Cluster sampling occurs when a researcher begins by sampling groups (or clusters) of population elements and then selects elements from within those groups.

Let’s work through how we might use cluster sampling in our study of binge drinking. While creating a list of all fraternity members in your state would be next to impossible, you could easily create a list of all undergraduate colleges in your state. Thus, you could draw a random sample of undergraduate colleges (your cluster) and then draw another random sample of elements (in this case, fraternity members) from within the undergraduate college you initially selected. Cluster sampling works in stages. In this example, we sampled in two stages— (1) undergraduate colleges and (2) fraternity members at the undergraduate colleges we selected. However, we could add another stage if it made sense to do so. We could randomly select (1) undergraduate colleges (2) specific fraternities at each school and (3) individual fraternity members. As you might have guessed, sampling in multiple stages does introduce the possibility of greater error (each stage is subject to its own sampling error), but it is nevertheless a highly efficient method.

Jessica Holt and Wayne Gillespie (2008) Holt, J. L., & Gillespie, W. (2008). Intergenerational transmission of violence, threatened egoism, and reciprocity: A test of multiple psychosocial factors affecting intimate partner violence. American Journal of Criminal Justice, 33, 252–266. used cluster sampling in their study of students’ experiences with violence in intimate relationships. Specifically, the researchers randomly selected 14 classes on their campus and then drew a random subsample of students from those classes. But you probably know from your experience with college classes that not all classes are the same size. So, if Holt and Gillespie had simply randomly selected 14 classes and then selected the same number of students from each class to complete their survey, then students in the smaller of those classes would have had a greater chance of being selected for the study than students in the larger classes. Keep in mind, with random sampling the goal is to make sure that each element has the same chance of being selected. When clusters are of different sizes, as in the example of sampling college classes, researchers often use a method called probability proportionate to size (PPS). This means that they take into account that their clusters are of different sizes. They do this by giving clusters different chances of being selected based on their size so that each element within those clusters winds up having an equal chance of being selected.

To summarize, probability samples allow a researcher to make conclusions about larger groups. Probability samples require a sampling frame from which elements, usually human beings, can be selected at random from a list. The use of random selection reduces the error and bias present in nonprobability samples reviewed in the previous section, though some error will always remain. In relying on a random number table or generator, researchers can more accurately state that their sample represents the population from which it was drawn. This strength is common to all probability sampling approaches summarized in Table 10.4.

Table 10.4 Types of probability samples
Sample type Description
Simple random Researcher randomly selects elements from sampling frame.
Systematic Researcher selects every kth element from sampling frame.
Stratified Researcher creates subgroups then randomly selects elements from each subgroup.
Cluster Researcher randomly selects clusters then randomly selects elements from selected clusters.

In determining which probability sampling approach makes the most sense for your project, it helps to know more about your population. A simple random sample and systematic sample are relatively similar to carry out. They both require a list all elements in your sampling frame. Systematic sampling is slightly easier in that it does not require you to use a random number generator, instead using a sampling interval that is easy to calculate by hand.

The relative simplicity of both approaches is counterweighted by their lack of sensitivity to characteristics in of your population. Stratified samples can better account for periodicity by creating strata that reduce or eliminate the effects of periodicity. Stratified samples also ensure that smaller subgroups are included in your sample, thus making your sample more representative of the overall population. While these benefits are important, creating strata for this purpose requires knowing information about your population before beginning the sampling process. In our binge drinking example, we would need to know how many students are in each class year to make sure our sample contained the same proportions. We would need to know that, for example, fifth-year students make up 5% of the student population to make sure 5% of our sample is comprised of fifth-year students. If the true population parameters are unknown, stratified sampling becomes significantly more challenging.

Common to each of the previous probability sampling approaches is the necessity of using a real list of all elements in your sampling frame. Cluster sampling is different. It allows a researcher to perform probability sampling in cases for which a list of elements is not available or pragmatic to create. Cluster sampling is also useful for making claims about a larger population, in our example, all fraternity members within a state. However, because sampling occurs at multiple stages in the process, in our example at the university and student level, sampling error increases. For many researchers, this weakness is outweighed by the benefits of cluster sampling.


Key Takeaways

  • In probability sampling, the aim is to identify a sample that resembles the population from which it was drawn.
  • There are several types of probability samples including simple random samples, systematic samples, stratified samples, and cluster samples.
  • Probability samples usually require a real list of elements in your sampling frame, though cluster sampling can be conducted without one.


Glossary

  • Cluster sampling- a sampling approach that begins by sampling groups (or clusters) of population elements and then selects elements from within those groups
  • Generalizability – the idea that a study’s results will tell us something about a group larger than the sample from which the findings were generated
  • Periodicity- the tendency for a pattern to occur at regular intervals
  • Probability proportionate to size- in cluster sampling, giving clusters different chances of being selected based on their size so that each element within those clusters has an equal chance of being selected
  • Probability sampling- sampling approaches for which a person’s likelihood of being selected from the sampling frame is known
  • Random selection- using a randomly generated numbers to determine who from the sampling frame gets recruited into the sample
  • Representative sample- a sample that resembles the population from which it was drawn in all the ways that are important for the research being conducted
  • Sampling error- a statistical calculation of the difference between results from a sample and the actual parameters of a population
  • Simple random sampling- selecting elements from a list using randomly generated numbers
  • Strata- the characteristic by which the sample is divided
  • Stratified sampling- dividing the study population into relevant subgroups and then draw a sample from each subgroup
  • Systematic sampling- selecting every kth element from a list


Image attributions

crowd men women by DasWortgewand CC-0

roll the dice by 955169 CC-0


49

10.4 A word of caution: Questions to ask about samples

Learning Objectives

  • Identify three questions you should ask about samples when reading research results
  • Describe how bias impacts sampling


We read and hear about research results so often that we might sometimes overlook the need to ask important questions about where the research participants came from and how they are identified for inclusion. It is easy to focus only on findings when we’re busy and when the really interesting stuff is in a study’s conclusions, not its procedures. But now that you have some familiarity with the variety of procedures for selecting study participants, you are equipped to ask some very important questions about the findings you read and to be a more responsible consumer of research.

Who sampled, how, and for what purpose?

 Have you ever been a participant in someone’s research? If you have ever taken an introductory psychology or sociology class at a large university, that’s probably a silly question to ask. Social science researchers on college campuses have a luxury that researchers elsewhere may not share—they have access to a whole bunch of (presumably) willing and able human guinea pigs. But that luxury comes at a cost—sample representativeness. One study of top academic journals in psychology found that over two-thirds (68%) of participants in studies published by those journals were based on samples drawn in the United States (Arnett, 2008). Arnett, J. J. (2008). The neglected 95%: Why American psychology needs to become less American. American Psychologist, 63, 602–614. Further, the study found that two-thirds of the work that derived from US samples published in the Journal of Personality and Social Psychology was based on samples made up entirely of American undergraduates taking psychology courses.


two white people and a dog lounging with coffee

These findings certainly raise the question: What do we actually learn from social scientific studies and about whom do we learn it? That is exactly the concern raised by Joseph Henrich and colleagues (Henrich, Heine, & Norenzayan, 2010), Henrich, J., Heine, S. J., & Norenzayan, A. (2010). The weirdest people in the world? Behavioral and Brain Sciences, 33, 61–135. authors of the article “The Weirdest People in the World?” In their piece, Henrich and colleagues point out that behavioral scientists very commonly make sweeping claims about human nature based on samples drawn only from WEIRD (Western, Educated, Industrialized, Rich, and Democratic) societies, and often based on even narrower samples, as is the case with many studies relying on samples drawn from college classrooms. As it turns out, many robust findings about the nature of human behavior when it comes to fairness, cooperation, visual perception, trust, and other behaviors are based on studies that excluded participants from outside the United States and sometimes excluded anyone outside the college classroom (Begley, 2010). Newsweek magazine published an interesting story about Henrich and his colleague’s study: Begley, S. (2010). What’s really human? The trouble with student guinea pigs. Retrieved from http://www.newsweek.com/2010/07/23/what-s-really- human.html This certainly raises questions about what we really know about human behavior as opposed to US resident or US undergraduate behavior. Of course, not all research findings are based on samples of WEIRD folks like college students. But even then, it would behoove us to pay attention to the population on which studies are based and the claims that are being made about to whom those studies apply.

In the preceding discussion, the concern is with researchers making claims about populations other than those from which their samples were drawn. A related, but slightly different, potential concern is sampling bias. Bias in sampling occurs when the elements selected for inclusion in a study do not represent the larger population from which they were drawn. For example, if you were to sample people walking into the social work building on campus during each weekday, your sample would include too many social work majors and not enough non-social work majors. Furthermore, you would  completely exclude graduate students whose classes are at night. Bias may be introduced by the sampling method used or due to conscious or unconscious bias introduced by the researcher (Rubin & Babbie, 2017). Rubin, C. & Babbie, S. (2017). Research methods for social work (9th edition). Boston, MA: Cengage. A researcher might select people who “look like good research participants,” in the process transferring their unconscious biases to their sample.


a cartoon of a man standing on a plinth with the word ignorance on it

Another thing to keep in mind is that just because a sample may be representative in all respects that a researcher thinks are relevant, there may be aspects that are relevant that didn’t occur to the researcher when she was drawing her sample. You might not think that a person’s phone would have much to do with their voting preferences, for example. But had pollsters making predictions about the results of the 2008 presidential election not been careful to include both cell phone-only and landline households in their surveys, it is possible that their predictions would have underestimated Barack Obama’s lead over John McCain because Obama was much more popular among cell-only users than McCain (Keeter, Dimock, & Christian, 2008). Keeter, S., Dimock, M., & Christian, L. (2008). Calling cell phones in ’08 pre-election polls. The Pew Research Center for the People and the Press. Retrieved from http://people-press.org/files/legacy-pdf/cell-phone-commentary.pdf

So how do we know when we can count on results that are being reported to us? While there might not be any magic or always-true rules we can apply, there are a couple of things we can keep in mind as we read the claims researchers make about their findings.

First, remember that sample quality is determined only by the sample actually obtained, not by the sampling method itself. A researcher may set out to administer a survey to a representative sample by correctly employing a random selection technique, but if only a handful of the people sampled actually respond to the survey, the researcher will have to be very careful about the claims she can make about her survey findings.

Another thing to keep in mind, as demonstrated by the preceding discussion, is that researchers may be drawn to talking about implications of their findings as though they apply to some group other than the population actually sampled. Though this tendency is usually quite innocent and does not come from a place of malice, it is all too tempting a way to talk about findings; as consumers of those findings, it is our responsibility to be attentive to this sort of (likely unintentional) bait and switch.

Finally, keep in mind that a sample that allows for comparisons of theoretically important concepts or variables is certainly better than one that does not allow for such comparisons. In a study based on a nonrepresentative sample, for example, we can learn about the strength of our social theories by comparing relevant aspects of social processes. We talked about this as theory-testing in Chapter 7.

At their core, questions about sample quality should address who has been sampled, how they were sampled, and for what purpose they were sampled. Being able to answer those questions will help you better understand, and more responsibly read, research results.


Key Takeaways

  • Sometimes researchers may make claims about populations other than those from whom their samples were drawn; other times they may make claims about a population based on a sample that is not representative. As consumers of research, we should be attentive to both possibilities.
  • A researcher’s findings need not be generalizable to be valuable; samples that allow for comparisons of theoretically important concepts or variables may yield findings that contribute to our social theories and our understandings of social processes.


Glossary

  • Bias- in sampling, when the elements selected for inclusion in a study do not represent the larger population from which they were drawn due to sampling method or thought processes of the researcher


Image attributions

men women apparel couple by 5688709 CC-0

ignorance by Rilsonav CC-0


XI

11. Survey research

50

11.0 Chapter introduction

In 2008, the voters of the United States elected our first African American president, Barack Obama. It may not surprise you to learn that when President Obama was coming of age in the 1970s, one-quarter of Americans reported they would not vote for a qualified African American presidential nominee. Three decades later, when President Obama ran for the presidency, fewer than 8% of Americans still held that position, and President Obama won the election (Smith, 2009). Smith, T. W. (2009). Trends in willingness to vote for a black and woman for president, 1972–2008. GSS Social Change Report No. 55. Chicago, IL: National Opinion Research Center. We know about these trends in voter opinion because the General Social Survey (http://www.norc.uchicago.edu/GSS+Website), a nationally representative survey of American adults, included questions about race and voting over the years described here. Without survey research, we may not know how Americans’ perspectives on race and the presidency shifted over these years.

Chapter Outline

Content Advisory

This chapter discusses or mentions the following topics: racism, mental health, terrorism and 9/11, substance use, and sexism and ageism in the workplace.

51

11.1 Survey research: What is it and when should it be used?

Learning Objectives

  • Define survey research
  • Identify when it is appropriate to employ survey research as a data-collection strategy


Most of you have probably taken a survey at one time or another, so you probably have a pretty good idea of what a survey is. Sometimes students in my research methods classes feel that understanding what a survey is and   how to write one is so obvious there’s no need to dedicate any class time to learning about it. This feeling is understandable—surveys are very much a part of our everyday lives—we’ve probably all taken one, we hear about their results in the news, and perhaps we’ve even administered one ourselves. What students quickly learn is that there is more to constructing a good survey than meets the eye. Survey design takes a great deal of thoughtful planning and often a great many rounds of revision. But it is worth the effort. As we’ll learn in this chapter, there are many benefits to choosing survey research as one’s method of data collection. We’ll take a look at what a survey is exactly, what some of the benefits and drawbacks of this method are, how to construct a survey, and what to do with survey data once one has it in hand.


a person checking boxes in a paper survey with a pen

Survey research is a quantitative method in which a researcher poses a set of predetermined questions to an entire group, or sample, of individuals. Survey research is an especially useful approach when a researcher aims to describe or explain features of a very large group or groups. This method may also be used as a way of quickly gaining some general details about one’s population of interest to help prepare for a more focused, in-depth study using time-intensive methods such as in-depth. In this case, a survey may help a researcher identify specific individuals or locations from which to collect additional data.

As is true of all methods of data collection, survey research is better suited to answering some kinds of research questions more than others. In addition, as you’ll recall from Chapter 9, operationalization works differently with different research methods. If your interest is in political activism, for example, you likely operationalize that concept differently in a survey than you would for an experimental study of the same topic.


Key Takeaways

  • Survey research is often used by researchers who wish to explain trends or features of large groups. It may also be used to assist those planning some more focused, in-depth study.


Glossary

  • Survey research- a quantitative method whereby a researcher poses some set of predetermined questions to a sample


Image attributions

survey by andibreit CC-0


52

11.2 Strengths and weaknesses of survey research

Learning Objectives

  • Identify and explain the strengths of survey research
  • Identify and explain the weaknesses of survey research


Survey research, as with all methods of data collection, comes with both strengths and weaknesses. We’ll examine both in this section.

Strengths of survey methods

 Researchers employing survey methods to collect data enjoy a number of benefits. First, surveys are an excellent way to gather lots of information from many people. In a study of older people’s experiences in the workplace, researchers were able to mail a written questionnaire to around 500 people who lived throughout the state of Maine at a cost of just over $1,000. This cost included printing copies of a seven-page survey, printing a cover letter, addressing and stuffing envelopes, mailing the survey, and buying return postage for the survey. I realize that $1,000 is nothing to sneeze at, but just imagine what it might have cost to visit each of those people individually to interview them in person. You would have to dedicate a few weeks of your life at least, drive around the state, and pay for meals and lodging to interview each person individually. We could double, triple, or even quadruple our costs pretty quickly by opting for an in-person method of data collection over a mailed survey. Thus, surveys are relatively cost-effective.


a cartoon of a person choosing between a happy, neutral, and sad face

Related to the benefit of cost-effectiveness is a survey’s potential for generalizability. Because surveys allow researchers to collect data from very large samples for a relatively low cost, survey methods lend themselves to probability sampling techniques, which we discussed in Chapter 10. Of all the data collection methods described in this textbook, survey research is probably the best method to use when one hopes to gain a representative picture of the attitudes and characteristics of a large group.

Survey research also tends to be a reliable method of inquiry. This is because surveys are standardized in that the same questions, phrased in exactly the same way, are posed to participants. Other methods, such as qualitative interviewing, which we’ll learn about in Chapter 13, do not offer the same consistency that a quantitative survey offers. This is not to say that all surveys are always reliable. A poorly phrased question can cause respondents to interpret its meaning differently, which can reduce that question’s reliability. Assuming well-constructed questions and survey design, one strength of this methodology is its potential to produce reliable results.

The versatility of survey research is also an asset. Surveys are used by all kinds of people in all kinds of professions. The versatility offered by survey research means that understanding how to construct and administer surveys is a useful skill to have for all kinds of jobs. Lawyers might use surveys in their efforts to select juries, social service and other organizations (e.g., churches, clubs, fundraising groups, activist groups) use them to evaluate the effectiveness of their efforts, businesses use them to learn how to market their products, governments use them to understand community opinions and needs, and politicians and media outlets use surveys to understand their constituencies.

In sum, the following are benefits of survey research:

Weaknesses of survey methods

As with all methods of data collection, survey research also comes with a few drawbacks. First, while one might argue that surveys are flexible in the sense that we can ask any number of questions on any number of topics in them, the fact that the survey researcher is generally stuck with a single instrument for collecting data, the questionnaire. Surveys are in many ways rather inflexible. Let’s say you mail a survey out to 1,000 people and then discover, as responses start coming in, that your phrasing on a particular question seems to be confusing a number of respondents. At this stage, it’s too late for a do-over or to change the question for the respondents who haven’t yet returned their surveys. When conducting in-depth interviews, on the other hand, a researcher can provide respondents further explanation if they’re confused by a question and can tweak their questions as they learn more about how respondents seem to understand them.

Depth can also be a problem with surveys. Survey questions are standardized; thus, it can be difficult to ask anything other than very general questions that a broad range of people will understand. Because of this, survey results may not be as valid as results obtained using methods of data collection that allow a researcher to more comprehensively examine whatever topic is being studied. Let’s say, for example, that you want to learn something about voters’ willingness to elect an African American president, as in our opening example in this chapter. General Social Survey respondents were asked, “If your party nominated an African American for president, would you vote for him if he were qualified for the job?” Respondents were then asked to respond either yes or no to the question. But what if someone’s opinion was more complex than could be answered with a simple yes or no? What if, for example, a person was willing to vote for an African American woman but not an African American man? I am not at all suggesting that such a perspective makes any sense.

In sum, potential drawbacks to survey research include the following:


Key Takeaways

  • Strengths of survey research include its cost effectiveness, generalizability, reliability, and versatility.
  • Weaknesses of survey research include inflexibility and issues with depth.


Image attributions

experience by mohamed_hassan CC-0


53

11.3 Types of surveys

Learning Objectives

  • Define cross-sectional surveys, provide an example of a cross-sectional survey, and outline some of the drawbacks of cross-sectional research
  • Describe the three types of longitudinal surveys
  • Describe retrospective surveys and identify their strengths and weaknesses
  • Discuss the benefits and drawbacks of the various methods of administering surveys


There is immense variety when it comes to surveys. This variety comes both in terms of time—when or with what frequency a survey is administered—and in terms of administration—how a survey is delivered to respondents. In this section, we’ll look at what types of surveys exist when it comes to both time and administration.

Time

In terms of time, there are two main types of surveys: cross-sectional and longitudinal. Cross-sectional surveys are those that are administered at just one point in time. These surveys offer researchers a snapshot in time and offer an idea about how things are for the respondents at the particular point in time that the survey is administered.

An example of a cross-sectional survey comes from Aniko Kezdy and colleagues’ study (Kezdy, Martos, Boland, & Horvath-Szabo, 2011) Kezdy, A., Martos, T., Boland, V., & Horvath-Szabo, K. (2011). Religious doubts and mental health in adolescence and young adulthood: The association with religious attitudes. Journal of Adolescence, 34, 39–47. of the association between religious attitudes, religious beliefs, and mental health among students in Hungary. These researchers administered a single, one-time-only, cross-sectional survey to a convenience sample of 403 high school and college students. The survey focused on how religious attitudes impact various aspects of one’s life and health. The researchers found from analysis of their cross- sectional data that anxiety and depression were highest among those who had both strong religious beliefs and some doubts about religion.

Yet another recent example of cross-sectional survey research can be seen in Bateman and colleagues’ study (Bateman, Pike, & Butler, 2011) Bateman, P. J., Pike, J. C., & Butler, B. S. (2011). To disclose or not: Publicness in social networking sites. Information Technology & People, 24, 78–100. of how the perceived publicness of social networking sites influences users’ self-disclosures. These researchers administered an online survey to undergraduate and graduate business students. They found that even though revealing information about oneself is viewed as key to realizing many of the benefits of social networking sites, respondents were less willing to disclose information about themselves as their perceptions of a social networking site’s publicness rose. That is, there was a negative relationship between perceived publicness of a social networking site and plans to self-disclose on the site.


a cartoon of a person thinking with a crowd standing behind them

One problem with cross-sectional surveys is that the events, opinions, behaviors, and other phenomena that such surveys are designed to assess don’t generally remain stagnant. They change over time. Thus, generalizing from a cross-sectional survey about the way things are can be tricky; perhaps you can say something about the way things were in the moment that you administered your survey, but it is difficult to know whether things remained that way for long after you administered your survey. Think, for example, about how Americans might have responded if administered a survey asking for their opinions on terrorism on September 10, 2001. Now imagine how responses to the same set of questions might differ were they administered on September 12, 2001. The point is not that cross-sectional surveys are useless; they have many important uses. But researchers must remember what they have captured by administering a cross-sectional survey—that is, as previously noted, a snapshot of life as it was at the time that the survey was administered.

One way to overcome this sometimes-problematic aspect of cross-sectional surveys is to administer a longitudinal survey. Longitudinal surveys are those that enable a researcher to make observations over some extended period of time. There are several types of longitudinal surveys, including trend, panel, and cohort surveys. We’ll discuss all three types here, along with retrospective surveys. Retrospective surveys fall somewhere in between cross-sectional and longitudinal surveys.

The first type of longitudinal survey is called a trend survey. The main focus of a trend survey is, perhaps not surprisingly, trends. Researchers conducting trend surveys are interested in how people in a specific group change over time. Each time the researchers gather data, they ask different people from the group they are describing because their concern is the group, not the individual people they survey. Let’s look at an example.

The Monitoring the Future Study (http://www.monitoringthefuture.org/) is a trend study that described the substance use of high school children in the United States. It’s conducted annually by the National Institute on Drug Abuse (NIDA). Each year, the NIDA distributes surveys to children in high schools around the country to understand how substance use and abuse in that population changes over time. Perhaps surprisingly, fewer high school children reported using alcohol in the past month than at any point over the last 20 years. Recent data also reflected an increased use of e-cigarettes and the popularity of e-cigarettes with no nicotine over those with nicotine. The data points provide insight into targeting substance abuse prevention programs towards the current issues facing the high school population.

Unlike in a trend survey, in a panel survey the same people participate in the survey each time it is administered. As you might imagine, panel studies can be difficult and costly. Imagine trying to administer a survey to the same 100 people every year for, say, 5 years in a row. Keeping track of where people live, when they move, and when they die takes resources that researchers often don’t have. When they do, however, the results can be quite powerful. The Youth Development Study (YDS), administered from the University of Minnesota, offers an excellent example of a panel study. You can read more about the Youth Development Study at its website: https://cla.umn.edu/sociology/graduate/collaboration-opportunities/youth-development-study.

Since 1988, YDS researchers have administered an annual survey to the same 1,000 people. Study participants were in ninth grade when the study began, and they are now in their thirties. Several hundred papers, articles, and books have been written using data from the YDS. One of the major lessons learned from this panel study is that work has a largely positive impact on young people (Mortimer, 2003). Mortimer, J. T. (2003). Working and growing up in America. Cambridge, MA: Harvard University Press. Contrary to popular beliefs about the impact of work on adolescents’ performance in school and transition to adulthood, work in fact increases confidence, enhances academic success, and prepares students for success in their future careers. Without this panel study, we may not be aware of the positive impact that working can have on young people.

Another type of longitudinal survey is a cohort survey. In a cohort survey, the participants have a defining characteristic that the researcher is interested in studying. The same people don’t necessarily participate from year to year, but all participants must meet whatever categorical criteria fulfill the researcher’s primary interest. Common cohorts that may be of interest to researchers include people of particular generations or those who were born around the same time period, graduating classes, people who began work in a given industry at the same time, or perhaps people who have some specific historical experience in common.

An example of this sort of research can be seen in Christine Percheski’s work (2008) Percheski, C. (2008). Opting out? Cohort differences in professional women’s employment rates from 1960 to 2005. American Sociological Review, 73, 497–517. on cohort differences in women’s employment. Percheski compared women’s employment rates across seven different generational cohorts, from Progressives born between 1906 and 1915 to Generation Xers born between 1966 and 1975. She found, among other patterns, that professional women’s labor force participation had increased across all cohorts. She also found that professional women with young children from Generation X had higher labor force participation rates than similar women from previous generations, concluding that mothers do not appear to be opting out of the workforce as some journalists have speculated (Belkin, 2003). Belkin, L. (2003, October 26). The opt-out revolution. New York Times, pp. 42–47, 58, 85–86.

All three types of longitudinal surveys share the strength that they permit a researcher to make observations over time. This means that if whatever behavior or other phenomenon the researcher is interested in changes, either because of some world event or because people age, the researcher will be able to capture those changes. Table 11.1 summarizes these three types of longitudinal surveys.

Table 11.1 Types of longitudinal surveys
Sample type Description
Trend Researcher examines changes in trends over time; the same people do not necessarily participate in the survey more than once.
Panel Researcher surveys the exact same sample several times over a period of time.
Cohort Researcher identifies a defining characteristic and then regularly surveys people who have that characteristic.

Finally, retrospective surveys are similar to other longitudinal studies in that they deal with changes over time, but like a cross-sectional study, they are administered only once. In a retrospective survey, participants are asked to report events from the past. By having respondents report past behaviors, beliefs, or experiences, researchers are able to gather longitudinal-like data without actually incurring the time or expense of a longitudinal survey. Of course, this benefit must be weighed against the possibility that people’s recollections of their pasts may be faulty. Imagine, for example, that you’re asked in a survey to respond to questions about where, how, and with whom you spent last Valentine’s Day. As last Valentine’s Day can’t have been more than 12 months ago, chances are good that you might be able to respond accurately to any survey questions about it. But now let’s say the researcher wants to know how last Valentine’s Day compares to previous Valentine’s Days, so she asks you to report on where, how, and with whom you spent the preceding six Valentine’s Days. How likely is it that you will remember? Will your responses be as accurate as they might have been had you been asked the question each year over the past 6 years, rather than asked to report on all years today?

In sum, when or with what frequency a survey is administered will determine whether your survey is cross-sectional or longitudinal. While longitudinal surveys are certainly preferable in terms of their ability to track changes over time, the time and cost required to administer a longitudinal survey can be prohibitive. As you may have guessed, the issues of time described here are not necessarily unique to survey research. Other methods of data collection can be cross-sectional or longitudinal—these are really matters of research design. But we’ve placed our discussion of these terms here because they are most commonly used by survey researchers to describe the type of survey administered. Another aspect of survey administration deals with how surveys are administered. We’ll examine that next.

Administration

Surveys vary not just in terms of when they are administered but also in terms of how they are administered. One common way to administer surveys is in the form of self-administered questionnaires. This means that a research participant is given a set of questions, in writing, to which they are asked to respond. Self-administered questionnaires can be delivered in hard copy format, typically via mail, or increasingly more commonly, online. We’ll consider both modes of delivery here.

Hard copy self-administered questionnaires may be delivered to participants in person or via snail mail. Perhaps you’ve take a survey that was given to you in person; on many college campuses, it is not uncommon for researchers to administer surveys in large social science classes (as you might recall from the discussion in our chapter on sampling). If you are ever asked to complete a survey in a similar setting, it might be interesting to note how your perspective on the survey and its questions could be shaped by the new knowledge you’re gaining about survey research in this chapter.

Researchers may also deliver surveys in person by going door-to-door and either asking people to fill them out right away or making arrangements for the researcher to return to pick up completed surveys. Though the advent of online survey tools has made door-to-door delivery of surveys less common, I still see an occasional survey researcher at my door, especially around election time. This mode of gathering data is apparently still used by political campaign workers, at least in some areas of the country.

If you are not able to visit each member of your sample personally to deliver a survey, you might consider sending your survey through the mail. While this mode of delivery may not be ideal (imagine how much less likely you’d probably be to return a survey that didn’t come with the researcher standing on your doorstep waiting to take it from you), sometimes it is the only available or the most practical option. As mentioned, though, this may not be the most ideal way of administering a survey because it can be difficult to convince people to take the time to complete and return your survey.

Often survey researchers who deliver their surveys via snail mail may provide some advance notice to respondents about the survey to get people thinking about and preparing to complete it. They may also follow up with their sample a few weeks after their survey has been sent out. This can be done not only to remind those who have not yet completed the survey to please do so but also to thank those who have already returned the survey. Most survey researchers agree that this sort of follow-up is essential for improving mailed surveys’ return rates (Babbie, 2010). Babbie, E. (2010). The practice of social research (12th ed.). Belmont, CA: Wadsworth. Other helpful tools to increase response rate are to create an attractive and professional survey, offer monetary incentives, and provide a pre-addressed, stamped return envelope.


laptop with an arm holding a magnifying glass coming out of it

Earlier, I mentioned online delivery as another way to administer a survey. This delivery mechanism is becoming increasingly common, no doubt because it is easy to use, relatively cheap, and may be quicker than knocking on doors or waiting for mailed surveys to be returned. To deliver a survey online, a researcher may subscribe to a service that offers online delivery or use some delivery mechanism that is available for free. SurveyMonkey offers both free and paid online survey services (https://www.surveymonkey.com). One advantage to using a service like SurveyMonkey, aside from the advantages of online delivery already mentioned, is that results can be provided to you in formats that are readable by data analysis programs such as SPSS. This saves you, the researcher, the step of having to manually enter data into your analysis program, as you would if you administered your survey in hard copy format.

Many of the suggestions provided for improving the response rate on a hard copy questionnaire apply to online questionnaires as well. One difference of course is that the sort of incentives one can provide in an online format differ from those that can be given in person or sent through the mail. But this doesn’t mean that online survey researchers cannot offer completion incentives to their respondents. I’ve taken a number of online surveys; many of these did not come with an incentive other than the joy of knowing that I’d helped a fellow social scientist do their job. However, for participating in one survey, I was given a coupon code to use for $30 off any order at a major online retailer. I’ve taken other online surveys where on completion I could provide my name and contact information if I wished to be entered into a lottery together with other study participants to win a larger gift, such as a $50 gift card or an iPad.

Online surveys, however, may not be accessible to individuals with limited, unreliable, or no access to the internet or less skill at using a computer. If those issues are common in your target population, online surveys may not work as well for your research study. While online surveys may be faster and cheaper than mailed surveys, mailed surveys are more likely to reach your entire sample but also more likely to be lost and not returned. The choice of which delivery mechanism is best depends on a number of factors, including your resources, the resources of your study participants, and the time you have available to distribute surveys and wait for responses. Understanding the characteristics of your study’s population is key to identifying the appropriate mechanism for delivering your survey.

Sometimes surveys are administered by having a researcher poses questions verbally to respondents rather than having respondents read the questions on their own. Researchers using phone or in-person surveys use an interview schedule which contains the list of questions and answer options that the researcher will read to respondents. Consistency in the way that questions and answer options are presented is very important with an interview schedule. The aim is to pose every question-and-answer option in the very same way to every respondent. This is done to minimize interviewer effect, or possible changes in the way an interviewee responds based on how or when questions and answer options are presented by the interviewer. In-person surveys may be recorded, but because questions tend to be closed ended, taking notes during the interview is less disruptive than it can be during a qualitative interview.


two girls in a field holding phones and laughing

Interview schedules are used in phone or in-person surveys and are also called quantitative interviews. Phone surveys are often conducted by political polling firms to understand how the electorate feels about certain candidates or policies. In both cases, researchers pose questions verbally to participants. As someone who has poor research karma, I often decline to participate in phone studies when I am called. It is easy, socially acceptable even, to hang up abruptly on an unwanted caller. Additionally, a distracted participant who is cooking dinner, tending to troublesome children, or driving may not provide accurate answers to your questions. Phone surveys make it difficult to control the environment in which a person answers your survey. Another challenge comes from the increasing number of people who only have cell phones and do not use landlines (Pew Research, n.d.). Pew Research (n.d.) Sampling. Retrieved from: http://www.pewresearch.org/methodology/u-s-survey-research/sampling/ Unlike landlines, cell phone numbers are portable across carriers, associated with individuals, not households, and do not change their first three numbers when people move to a new geographical area. Computer-assisted telephone interviewing (CATI) programs have also been developed to assist quantitative survey researchers. These programs allow an interviewer to enter responses directly into a computer as they are provided, thus saving hours of time that would otherwise have to be spent entering data into an analysis program by hand.

Quantitative interviews must also be administered in such a way that the researcher asks the same question the same way each time. While questions on hard copy questionnaires may create an impression based on the way they are presented, having a person administer questions introduces a slew of additional variables that might influence a respondent. Even a slight shift in emphasis on a word may bias the respondent to answer differently. As I’ve mentioned earlier, consistency is key with quantitative data collection—and human beings are not necessarily known for their consistency. Quantitative interviews can also help reduce a respondent’s confusion. If a respondent is unsure about the meaning of a question or answer option on a self-administered questionnaire, they probably won’t have the opportunity to get clarification from the researcher. An interview, on the other hand, gives the researcher an opportunity to clarify or explain any items that may be confusing. If a participant asks for clarification, the researcher must use pre-determined responses to make sure each quantitative interview is exactly the same as the others.

In-person surveys are conducted in the same way as phone surveys but must also account for non-verbal expressions and behaviors. In-person surveys do carry one distinct benefit—they are more difficult to say “no” to. Because the participant is already in the room and sitting across from the researcher, they are less likely to decline than if they clicked “delete” for an emailed online survey or pressed “hang up” during a phone survey.  In-person surveys are also much more time consuming and expensive than mailing questionnaires. Thus, quantitative researchers may opt for self-administered questionnaires over in-person surveys on the grounds that they will be able to reach a large sample at a much lower cost than were they to interact personally with each and every respondent.


Key Takeaways

  • Time is a factor in determining what type of survey researcher administers; cross-sectional surveys are administered at one time, and longitudinal surveys are administered over time.
  • Retrospective surveys offer some of the benefits of longitudinal research but also come with their own drawbacks.
  • Self-administered questionnaires may be delivered in hard copy form to participants in person or via snail mail or online.
  • Interview schedules are used in in-person or phone surveys.
  • Each method of survey administration comes with benefits and drawbacks.


Glossary

  • Cohort survey- describes how people with a defining characteristic change over time
  • Cross-sectional surveys- surveys that are administered at just one point in time
  • Interview schedules- a researcher poses questions verbally to respondents
  • Longitudinal surveys- surveys in which a researcher to make observations over some extended period of time
  • Panel survey- describes how people in a specific group change over time, asking the same people each time the survey is administered
  • Retrospective surveys- describe changes over time but are administered only once
  • Self-administered questionnaires- a research participant is given a set of questions, in writing, to which they are asked to respond
  • Trend survey- describes how people in a specific group change over time, asking different people each time the survey is administered


Image attributions

company social networks by Hurca CC-0

posts submit searching by mohamed_hassan CC-0

talk telephone by MelanieSchwolert CC-0


54

11.4 Designing effective questions and questionnaires

Learning Objectives

  • Identify the steps one should take to write effective survey questions
  • Describe some of the ways that survey questions might confuse respondents and how to overcome that possibility
  • Apply mutual exclusivity and exhaustiveness to writing closed-ended questions
  • Define fence-sitting and floating
  • Describe the steps involved in constructing a well-designed questionnaire
  • Discuss why pretesting is important


Up to this point, we’ve considered several general points about surveys, including when to use them, some of their strengths and weaknesses, and how often and in what ways to administer surveys. In this section, we’ll get more specific and take a look at how to pose understandable questions that will yield useable data and how to present those questions on your questionnaire.

Asking effective questions

The first thing you need to do to write effective survey questions is identify what exactly you wish to know. As silly as it sounds to state what seems so completely obvious, I can’t stress enough how easy it is to forget to include important questions when designing a survey. Begin by looking at your research question. Perhaps you wish to identify the factors that contribute to students’ ability to transition from high school to college. To understand which factors shaped successful students’ transitions to college, you’ll need to include questions in your survey about all the possible factors that could contribute. How do you know what to ask? Consulting the literature on the topic will certainly help, but you should also take the time to do some brainstorming on your own and to talk with others about what they think may be important in the transition to college. Time and space limitations won’t allow you to include every single item you’ve come up with, so you’ll also need to think about ranking your questions so that you can be sure to include those that you view as most important. In your study, think back to your work on operationalization. How did you plan to measure your variables? If you planned to ask specific questions or use a scale, those should be in your survey.

Although I have stressed the importance of including questions on all topics you view as important to your overall research question, you don’t want to take an everything-but-the-kitchen-sink approach by uncritically including every possible question that occurs to you. Doing so puts an unnecessary burden on your survey respondents. Remember that you have asked your respondents to give you their time and attention and to take care in responding to your questions; show them your respect by only asking questions that you view as important.

Once you’ve identified all the topics about which you’d like to ask questions, you’ll need to actually write those questions. Questions should be as clear and to the point as possible. This is not the time to show off your creative writing skills; a survey is a technical instrument and should be written in a way that is as direct and concise as possible. As I’ve mentioned earlier, your survey respondents have agreed to give their time and attention to your survey. The best way to show your appreciation for their time is to not waste it. Ensuring that your questions are clear and concise will go a long way toward showing your respondents the gratitude they deserve.

Related to the point about not wasting respondents’ time, make sure that every question you pose will be relevant to every person you ask to complete it. This means two things: first, that respondents have knowledge about whatever topic you are asking them about, and second, that respondents have experience with whatever events, behaviors, or feelings you are asking them to report. You probably wouldn’t want to ask a sample of 18-year-old respondents, for example, how they would have advised President Reagan to proceed when news of the United States’ sale of weapons to Iran broke in the mid-1980s. For one thing, few 18-year-olds are likely to have any clue about how to advise a president. Furthermore, the 18-year-olds of today were not even alive during Reagan’s presidency, so they have had no experience with Iran-Contra affair about which they are being questioned. In our example of the transition to college, heeding the criterion of relevance would mean that respondents must understand what exactly you   mean by “transition to college” if you are going to use that phrase in your survey and that respondents must have actually experienced the transition to college themselves.

If you decide that you do wish to pose some questions about matters with which only a portion of respondents will have had experience, it may be appropriate to introduce a filter question into your survey. A filter question is designed to identify some subset of survey respondents who are asked additional questions that are not relevant to the entire sample. Perhaps in your survey on the transition to college you want to know whether substance use plays any role in students’ transitions. You may ask students how often they drank during their first semester of college. But this assumes that all students drank. Certainly, some may have abstained from using alcohol, and it wouldn’t make any sense to ask the nondrinkers how often they drank. Nevertheless, it seems reasonable that drinking frequency may have an impact on someone’s transition to college, so it is probably worth asking this question even if doing means the question will not be relevant for some respondents. This is just the sort of instance when a filter question would be appropriate. You may pose the question as it is presented in Figure 11.1.


example of filter question, with a yes answer meaning you had to answer more questions
Figure 11.1 Filter question

All figures in this chapter were copied from Blackstone, A. (2012) Principles of sociological inquiry: Qualitative and quantitative methods. Saylor Foundation. Retrieved from: https://saylordotorg.github.io/text_principles-of-sociological-inquiry-qualitative-and-quantitative-methods/ Shared under CC-BY-NC-SA 3.0 License (https://creativecommons.org/licenses/by-nc-sa/3.0/)

There are some ways of asking questions that are bound to confuse many survey respondents. Survey researchers should take great care to avoid these kinds of questions. These include questions that pose double negatives, those that use confusing or culturally specific terms, and those that ask more than one question but are posed as a single question. Any time respondents are forced to decipher questions that use double negatives, confusion is bound to ensue. Taking the previous question about drinking as our example, what if we had instead asked, “Did you not abstain from drinking during your first semester of college?” This example is obvious, but hopefully it drives home the point to be careful about question wording so that respondents are not asked to decipher double negatives. In general, avoiding negative terms in your question wording will help to increase respondent understanding.

You should also avoid using terms or phrases that may be regionally or culturally specific (unless you are absolutely certain all your respondents come from the region or culture whose terms you are using). When I first moved to southwest Virginia, I didn’t know what a holler was. Where I grew up in New Jersey, to holler means to yell. Even then, it wasn’t used very much. In New Jersey, we shouted and screamed, but we didn’t holler much. In southwest Virginia, my current home, a holler also means a small valley in between the mountains. If I used holler in that way on my survey, people who live near me may understand, but almost everyone else would be totally confused.

A similar issue arises when you use jargon, or technical language, that people do not commonly know. For example, if you asked adolescents how they experience imaginary audience, they likely would not be able to link that term to the concepts from David Elkind’s theory. See https://en.wikipedia.org/wiki/Imaginary_audience for more information on the theory of imaginary audience. The questions on your study must be understandable to the participants. Instead, you would need to break down that term into language that is easier to understand and common to adolescents.

Asking multiple questions as though they are a single question can also confuse survey respondents. There’s a specific term for this sort of question; it is called a double-barreled question. Using our example of the transition to college, Figure 11.2 shows a double-barreled question.


Double-barreled question asking more than one thing at a time.
Figure 11.2 Double-barreled question

Do you see what makes the question double-barreled? How would someone respond if they felt their college classes were more demanding but also more boring than their high school classes? Or less demanding but more interesting? Because the question combines “demanding” and “interesting,” there is no way to respond yes to one criterion but no to the other.

Another thing to avoid when constructing survey questions is the problem of social desirability. We all want to look good, right? And we all probably know the politically correct response to a variety of questions whether we agree with the politically correct response or not. In survey research, social desirability refers to the idea that respondents will try to answer questions in a way that will present them in a favorable light. (You may recall we covered social desirability bias in Chapter 9.) Let’s go back to our example about transitioning to college to explore this concept further.

Perhaps we decide that to understand the transition to college, we need to know whether respondents ever cheated on an exam in high school or college. We all know that cheating on exams is generally frowned upon (at least I hope we all know this). So, it may be difficult to get people to admit to cheating on a survey. But if you can guarantee respondents’ confidentiality, or even better, their anonymity, chances are much better that they will be honest about having engaged in this socially undesirable behavior. Another way to avoid problems of social desirability is to try to phrase difficult questions in the most benign way possible. Earl Babbie (2010) Babbie, E. (2010). The practice of social research (12th ed.). Belmont, CA: Wadsworth. offers a useful suggestion for helping you do this—simply imagine how you would feel responding to your survey questions. If you would be uncomfortable, chances are others would as well.

Finally, it is important to get feedback on your survey questions from as many people as possible, especially people who are like those in your sample. Now is not the time to be shy. Ask your friends for help, ask your mentors for feedback, ask your family to take a look at your survey as well. The more feedback you can get on your survey questions, the better the chances that you will come up with a set of questions that are understandable to a wide variety of people and, most importantly, to those in your sample.

In sum, in order to pose effective survey questions, researchers should do the following:

Response options

While posing clear and understandable questions in your survey is certainly important, so too is providing respondents with unambiguous response options. Response options are the answers that you provide to the people taking your survey. Generally, respondents will be asked to choose a single (or best) response to each question you pose, though certainly it makes sense in some cases to instruct respondents to choose multiple response options. One caution to keep in mind when accepting multiple responses to a single question, however, is that doing so may add complexity when it comes to tallying and analyzing your survey results.

Offering response options assumes that your questions will be closed-ended questions. In a quantitative   written survey, which is the type of survey we’ve been discussing here, chances are good that most, if not all, your questions will be closed-ended. This means that you, the researcher, will provide respondents with a limited set of options for their responses. To write an effective closed-ended question, there are a couple of guidelines worth following. First, be sure that your response options are mutually exclusive. Look back at Figure 11.1, which contains questions about how often and how many drinks respondents consumed. Do you notice that there are no overlapping categories in the response options for these questions? This is another one of those points about question construction that seems fairly obvious but that can be easily overlooked. Response options should also be exhaustive. In other words, every possible response should be covered in the set of response options that you provide. For example, note that in question 10a in Figure 11.1, we have covered all possibilities—those who drank, say, an average of once per month can choose the first response option (“less than one time per week”) while those who drank multiple times a day each day of the week can choose the last response option (“7+”). All the possibilities in between these two extremes are covered by the middle three response options.

Surveys need not be limited to closed-ended questions. Sometimes survey researchers include open-ended questions in their survey instruments as a way to gather additional details from respondents. An open-ended question does not include response options; instead, respondents are asked to reply to the question in their own way, using their own words. These questions are generally used to find out more about a survey participant’s experiences or feelings about whatever they are being asked to report in the survey. If, for example, a survey includes closed-ended questions asking respondents to report on their involvement in extracurricular activities during college, an open-ended question could ask respondents why they participated in those activities or what they gained from their participation. While responses to such questions may also be captured using a closed-ended format, allowing participants to share some of their responses in their own words can make the experience of completing the survey more satisfying to respondents and can also reveal new motivations or explanations that had not occurred to the researcher.

Earlier in this section, we discussed double-barreled questions, but response options can also be double barreled, and this should be avoided. Figure 11.3 is an example of a question that uses double-barreled response options.


Double-barreled response options providing more than one answer for each option
Figure 11.3 Double-barreled response options

Other things to avoid when it comes to response options include fence-sitting and floating. Fence-sitters are respondents who choose neutral response options, even if they have an opinion. This can occur if respondents are given, say, five rank-ordered response options, such as strongly agree, agree, no opinion, disagree, and strongly disagree. You’ll remember this is called a Likert scale. Some people will be drawn to respond, “no opinion” even if they have an opinion, particularly if their true opinion is the not a socially desirable opinion. Floaters, on the other hand, are those that choose a substantive answer to a question when really, they don’t understand the question or don’t have an opinion. If a respondent is only given four rank-ordered response options, such as strongly agree, agree, disagree, and strongly disagree, those who have no opinion have no choice but to select a response that suggests they have an opinion.

As you can see, floating is the flip side of fence-sitting. Thus, the solution to one problem is often the cause of the other. How you decide which approach to take depends on the goals of your research. Sometimes researchers specifically want to learn something about people who claim to have no opinion. In this case, allowing for fence-sitting would be necessary. Other times researchers feel confident their respondents will all be familiar with every topic in their survey. In this case, perhaps it is okay to force respondents to choose an opinion. There is no always-correct solution to either problem.

Finally, using a matrix is a nice way of streamlining response options. A matrix is a question type that that lists a set of questions for which the answer categories are all the same. If you have a set of questions for which the response options are the same, it may make sense to create a matrix rather than posing each question and its response options individually. Not only will this save you some space in your survey but it will also help respondents progress through your survey more easily. A sample matrix can be seen in Figure 11.4.


Survey using matrix options--between agree and disagree--and opinions about class
Figure 11.4 Survey questions utilizing matrix format

All figures in this chapter were copied from Blackstone, A. (2012) Principles of sociological inquiry: Qualitative and quantitative methods. Saylor Foundation. Retrieved from: https://saylordotorg.github.io/text_principles-of-sociological-inquiry-qualitative-and-quantitative-methods/ Shared under CC-BY-NC-SA 3.0 License (https://creativecommons.org/licenses/by-nc-sa/3.0/)

Designing questionnaires

In addition to constructing quality questions and posing clear response options, you’ll also need to think about how to present your written questions and response options to survey respondents. Questions are presented on a questionnaire, which is the document (either hard copy or online) that contains all your survey questions that respondents read and provide their responses. Designing questionnaires takes some thought.

One of the first things to do once you’ve come up with a set of survey questions you feel confident about is to group those questions thematically. In our example of the transition to college, perhaps we’d have a few questions asking about study habits, others focused on friendships, and still others on exercise and eating habits. Those may be the themes around which we organize our questions. Or perhaps it would make more sense to present any questions we had about pre-college life and then present a series of questions about life after beginning college. The point here is to be deliberate about how you present your questions to respondents.

Once you have grouped similar questions together, you’ll need to think about the order in which to present those question groups. Most survey researchers agree that it is best to begin a survey with questions that will want to make respondents continue (Babbie, 2010; Dillman, 2000; Neuman, 2003). Babbie, E. (2010). The practice of social research (12th ed.). Belmont, CA: Wadsworth; Dillman, D. A. (2000). Mail and Internet surveys: The tailored design method (2nd ed.). New York, NY: Wiley; Neuman, W. L. (2003). Social research methods: Qualitative and quantitative approaches (5th ed.). Boston, MA: Pearson. In other words, don’t bore respondents, but don’t scare them away either. There’s some disagreement over where on a survey to place demographic questions, such as those about a person’s age, gender, and race. On the one hand, placing them at the beginning of the questionnaire may lead respondents to think the survey is boring, unimportant, and not something they want to bother completing. On the other hand, if your survey deals with some very sensitive or difficult topic, such as child sexual abuse or other criminal activity, you don’t want to scare respondents away or shock them by beginning with your most intrusive questions.

In truth, the order in which you present questions on a survey is best determined by the unique characteristics of your research—only you, the researcher, hopefully in consultation with people who are willing to provide you with feedback, can determine how best to order your questions. To do so, think about the unique characteristics of your topic, your questions, and most importantly, your sample. Keeping in mind the characteristics and needs of the people you will ask to complete your survey should help guide you as you determine the most appropriate order in which to present your questions.

You’ll also need to consider the time it will take respondents to complete your questionnaire. Surveys vary in length, from just a page or two to a dozen or more pages, which means they also vary in the time it takes to complete them. How long to make your survey depends on several factors. First, what is it that you wish to know? Wanting to understand how grades vary by gender and year in school certainly requires fewer questions than wanting to know how people’s experiences in college are shaped by demographic characteristics, college attended, housing situation, family background, college major, friendship networks, and extracurricular activities. Keep in mind that even if your research question requires a sizable number of questions be included in your questionnaire, do your best to keep the questionnaire as brief as possible. Any hint that you’ve thrown in a bunch of useless questions just for the sake of it will turn off respondents and may make them not want to complete your survey.

Second, and perhaps more important, how long are respondents likely to be willing to spend completing your questionnaire? If you are studying college students, asking them to use their precious fun time away from studying to complete your survey may mean they won’t want to spend more than a few minutes on it. But if you have the endorsement of a professor who is willing to allow you to administer your survey in class, students may be willing to give you a little more time (though perhaps the professor will not). The time that survey researchers ask respondents to spend on questionnaires varies greatly. Some researchers advise that surveys should not take longer than about 15 minutes to complete (as cited in Babbie 2010), [4] whereas others suggest that up to 20 minutes is acceptable (Hopper, 2010). [5] As with question order, there is no clear-cut, always-correct answer about questionnaire length. The unique characteristics of your study and your sample should be considered to determine how long to make your questionnaire.

A good way to estimate the time it will take respondents to complete your questionnaire is through pretesting. Pretesting allows you to get feedback on your questionnaire so you can improve it before you actually administer it. Pretesting can be quite expensive and time consuming if you wish to test your questionnaire on a large sample of people who very much resemble the sample to whom you will eventually administer the finalized version of your questionnaire. But you can learn a lot and make great improvements to your questionnaire simply by pretesting with a small number of people to whom you have easy access (perhaps you have a few friends who owe you a favor). By pretesting your questionnaire, you can find out how understandable your questions are, get feedback on question wording and order, find out whether any of your questions are boring or offensive, and learn whether there are places where you should have included filter questions. You can also time pretesters as they take your survey. This will give you a good idea about the estimate to provide respondents when you administer your survey and whether you have some wiggle room to add additional items or need to cut a few items.

Perhaps this goes without saying, but your questionnaire should also have an attractive design. A messy presentation style can confuse respondents or, at the very least, annoy them. Be brief, to the point, and as clear as possible. Avoid cramming too much into a single page. Make your font size readable (at least 12 point or larger, depending on the characteristics of your sample), leave a reasonable amount of space between items, and make sure all instructions are exceptionally clear. Think about books, documents, articles, or web pages that you have read yourself—which were relatively easy to read and easy on the eyes and why? Try to mimic those features in the presentation of your survey questions.


Key Takeaways

  • Brainstorming and consulting the literature are two important early steps to take when preparing to write effective survey questions.
  • Make sure your survey questions will be relevant to all respondents and that you use filter questions when necessary.
  • Getting feedback on your survey questions is a crucial step in the process of designing a survey.
  • When it comes to creating response options, the solution to the problem of fence-sitting might cause floating, whereas the solution to the problem of floating might cause fence sitting.
  • Pretesting is an important step for improving one’s survey before actually administering it.


Glossary

  • Closed-ended questions- questions for which the researcher offers response options
  • Double-barreled question- a question that asks two different questions at the same time, making it difficult to respond accurately
  • Fence-sitters- respondents who choose neutral response options, even if they have an opinion
  • Filter question- question that identifies some subset of survey respondents who are asked additional questions that are not relevant to the entire sample
  • Floaters- respondents that choose a substantive answer to a question when really, they don’t understand the question or don’t have an opinion
  • Matrix question- lists a set of questions for which the answer categories are all the same
  • Open-ended questions- questions for which the researcher does not include response options


XII

12. Experimental design

55

12.0 Chapter introduction

When you think of the term experiment, what comes to mind? Perhaps you thought about trying a new soda or changing your cat’s litter to a different brand. We all design informal experiments in our life. We try new things and seek to learn how those things changed us or how they compare to other things we might try. We even create entertainment programs like Mythbusters whose hosts use experimental methods to test whether common myths or bits of folk knowledge are actually true. It’s likely you’ve already developed an intuitive sense of how experiments work. The content of this chapter will increase your existing competency about using experiments to learn about the social world.

Chapter Outline

Content Advisory

This chapter discusses or mentions the following topics: substance abuse, eating disorders, prejudice, hurricane Katrina, domestic violence, racism, poverty, and trauma.

56

12.1 Experimental design: What is it and when should it be used?

Learning Objectives

  • Define experiment
  • Identify the core features of true experimental designs
  • Describe the difference between an experimental group and a control group
  • Identify and describe the various types of true experimental designs


Experiments are an excellent data collection strategy for social workers wishing to observe the effects of a clinical intervention or social welfare program. Understanding what experiments are and how they are conducted is useful for all social scientists, whether they actually plan to use this methodology or simply aim to understand findings from experimental studies. An experiment is a method of data collection designed to test hypotheses under controlled conditions. Students in my research methods classes often use the term experiment to describe all kinds of research projects, but in social scientific research, the term has a unique meaning and should not be used to describe all research methodologies.


cartoon including a stopwatch and a pencil marking a checkbox on a clipboard

Experiments have a long and important history in social science. Behaviorists such as John Watson, B. F. Skinner, Ivan Pavlov, and Albert Bandura used experimental design to demonstrate the various types of conditioning. Using strictly controlled environments, behaviorists were able to isolate a single stimulus as the cause of measurable differences in behavior or physiological responses. The foundations of social learning theory and behavior modification are found in experimental research projects. Moreover, behaviorist experiments brought psychology and social science away from the abstract world of Freudian analysis and towards empirical inquiry, grounded in real-world observations and objectively-defined variables. Experiments are used at all levels of social work inquiry, including agency-based experiments that test therapeutic interventions and policy experiments that test new programs.

Several kinds of experimental designs exist. In general, designs considered to be true experiments contain three key features: independent and dependent variables, pretesting and posttesting, and experimental and control groups. In a true experiment, the effect of an intervention is tested by comparing two groups: one that is exposed to the intervention (the experimental group, also known as the treatment group) and another that does not receive the intervention (the control group).

In some cases, it may be immoral to withhold treatment from a control group within an experiment. If you recruited two groups of people with severe addiction and only provided treatment to one group, the other group would likely suffer. For these cases, researchers use a comparison group that receives “treatment as usual.” Experimenters must clearly define what treatment as usual means. For example, a standard treatment in substance abuse recovery is attending Alcoholics Anonymous or Narcotics Anonymous meetings. A substance abuse researcher conducting an experiment may use twelve-step programs in their comparison group and use their experimental intervention in the experimental group. The results would show whether the experimental intervention worked better than normal treatment, which is useful information. However, using a comparison group is a deviation from true experimental design and is more associated with quasi-experimental designs.

Importantly, participants in a true experiment need to be randomly assigned to either the control or experimental groups. Random assignment uses a random number generator or some other random process to assign people into experimental and control groups. Random assignment is important in experimental research because it helps to ensure that the experimental group and control group are comparable and that any differences between the experimental and control groups are due to random chance. We will address more of the logic behind random assignment in the next section.

In an experiment, the independent variable is the intervention being tested—for example, a therapeutic technique, prevention program, or access to some service or support. It is less common in of social work research, but social science research may also have a stimulus, rather than an intervention as the independent variable. For example, an electric shock or a reading about death might be used as a stimulus to provoke a response.

The dependent variable is usually the intended effect the researcher wants the intervention to have. If the researcher is testing a new therapy for individuals with binge eating disorder, their dependent variable may be the number of binge eating episodes a participant reports. The researcher likely expects her intervention to decrease the number of binge eating episodes reported by participants. Thus, she must measure the number of episodes that existed prior to the intervention, which is the pretest, and after the intervention, which is the posttest.

Let’s put these concepts in chronological order so we can better understand how an experiment runs from start to finish. Once you’ve collected your sample, you’ll need to randomly assign your participants to the experimental group and control group. You will then give both groups your pretest, which measures your dependent variable, to see what your participants are like before you start your intervention. Next, you will provide your intervention, or independent variable, to your experimental group. Many interventions last a few weeks or months to complete, particularly therapeutic treatments. Finally, you will administer your posttest to both groups to observer any changes in your dependent variable. Together, this is known as the classic experimental design and is the simplest type of true experimental design. All of the designs we review in this section are variations on this approach. Figure 12.1 visually represents these steps.


Figure 12.1 Steps in classic experimental design

An interesting example of experimental research can be found in Shannon K. McCoy and Brenda Major’s (2003) McCoy, S. K., & Major, B. (2003). Group identification moderates emotional response to perceived prejudice. Personality and Social Psychology Bulletin, 29, 1005–1017. study of peoples’ perceptions of prejudice. In one portion of this multifaceted study, all participants were given a pretest to assess their levels of depression. No significant differences in depression were found between the experimental and control groups during the pretest. Participants in the experimental group were then asked to read an article suggesting that prejudice against their own racial group is severe and pervasive, while participants in the control group were asked to read an article suggesting that prejudice against a racial group other than their own is severe and pervasive. Clearly, these were not meant to be interventions or treatments to help depression, but were stimuli designed to elicit changes in people’s depression levels. Upon measuring depression scores during the posttest period, the researchers discovered that those who had received the experimental stimulus (the article citing prejudice against their same racial group) reported greater depression than those in the control group. This is just one of many examples of social scientific experimental research.

In addition to classic experimental design, there are two other ways of designing experiments that are considered to fall within the purview of “true” experiments (Babbie, 2010; Campbell & Stanley, 1963). Babbie, E. (2010). The practice of social research (12th ed.). Belmont, CA: Wadsworth; Campbell, D., & Stanley, J. (1963). Experimental and quasi-experimental designs for research. Chicago, IL: Rand McNally. The posttest-only control group design is almost the same as classic experimental design, except it does not use a pretest. Researchers who use posttest-only designs want to eliminate testing effects, in which a participant’s scores on a measure change because they have already been exposed to it. If you took multiple SAT or ACT practice exams before you took the real one you sent to colleges, you’ve taken advantage of testing effects to get a better score. Considering the previous example on racism and depression, participants who are given a pretest about depression before being exposed to the stimulus would likely assume that the intervention is designed to address depression. That knowledge can cause them to answer differently on the posttest than they otherwise would. Participants are not stupid. They are actively trying to figure out what your study is about.

In theory, as long as the control and experimental groups have been determined randomly and are therefore comparable, no pretest is needed. However, most researchers prefer to use pretests so they may assess change over time within both the experimental and control groups. Researchers wishing to account for testing effects but also gather pretest data can use a Solomon four-group design. In the Solomon four-group design, the researcher uses four groups. Two groups are treated as they would be in a classic experiment—pretest, experimental group intervention, and posttest. The other two groups do not receive the pretest, though one receives the intervention. All groups are given the posttest. Table 12.1 illustrates the features of each of the four groups in the Solomon four-group design. By having one set of experimental and control groups that complete the pretest (Groups 1 and 2) and another set that does not complete the pretest (Groups 3 and 4), researchers using the Solomon four-group design can account for testing effects in their analysis.

Table 12.1 Solomon four-group design
Pretest Stimulus Posttest
Group 1 X X X
Group 2 X X
Group 3 X X
Group 4 X

Solomon four-group designs are challenging to implement in the real world because they are time- and resource-intensive. Researchers must recruit enough participants to create four groups and implement interventions in two of them. Overall, true experimental designs are sometimes difficult to implement in a real-world practice environment. It may be impossible to withhold treatment from a control group or randomly assign participants in a study. In these cases, pre-experimental and quasi-experimental designs can be used. However, the differences in rigor from true experimental designs leave their conclusions more open to critique.


Key Takeaways

  • True experimental designs require random assignment.
  • Control groups do not receive an intervention, and experimental groups receive an intervention.
  • The basic components of a true experiment include a pretest, posttest, control group, and experimental group.
  • Testing effects may cause researchers to use variations on the classic experimental design.


Glossary

  • Classic experimental design- uses random assignment, an experimental and control group, as well as pre- and posttesting
  • Comparison group- a group in quasi-experimental designs that receives “treatment as usual” instead of no treatment
  • Control group- the group in an experiment that does not receive the intervention
  • Experiment- a method of data collection designed to test hypotheses under controlled conditions
  • Experimental group- the group in an experiment that receives the intervention
  • Posttest- a measurement taken after the intervention
  • Posttest-only control group design- a type of experimental design that uses random assignment, and an experimental and control group, but does not use a pretest
  • Pretest- a measurement taken prior to the intervention
  • Random assignment-using a random process to assign people into experimental and control groups
  • Solomon four-group design- uses random assignment, two experimental and two control groups, pretests for half of the groups, and posttests for all
  • Testing effects- when a participant’s scores on a measure change because they have already been exposed to it
  • True experiments- a group of experimental designs that contain independent and dependent variables, pretesting and post testing, and experimental and control groups


Image attributions

exam scientific experiment by mohamed_hassan CC-0


57

12.2 Pre-experimental and quasi-experimental design

Learning Objectives

  • Identify and describe the various types of quasi-experimental designs
  • Distinguish true experimental designs from quasi-experimental and pre-experimental designs
  • Identify and describe the various types of quasi-experimental and pre-experimental designs


As we discussed in the previous section, time, funding, and ethics may limit a researcher’s ability to conduct a true experiment. For researchers in the medical sciences and social work, conducting a true experiment could require denying needed treatment to clients, which is a clear ethical violation. Even those whose research may not involve the administration of needed medications or treatments may be limited in their ability to conduct a classic experiment. When true experiments are not possible, researchers often use quasi-experimental designs.

Quasi-experimental designs are similar to true experiments, but they lack random assignment to experimental and control groups. The most basic of these quasi-experimental designs is the nonequivalent comparison groups design (Rubin & Babbie, 2017). Rubin, C. & Babbie, S. (2017). Research methods for social work (9th edition). Boston, MA: Cengage. The nonequivalent comparison group design looks a lot like the classic experimental design, except it does not use random assignment. In many cases, these groups may already exist. For example, a researcher might conduct research at two different agency sites, one of which receives the intervention and the other does not. No one was assigned to treatment or comparison groups. Those groupings existed prior to the study. While this method is more convenient for real-world research, researchers cannot be sure that the groups are comparable. Perhaps the treatment group has a characteristic that is unique–for example, higher income or different diagnoses–that make the treatment more effective.

Quasi-experiments are particularly useful in social welfare policy research. Social welfare policy researchers like me often look for what are termed natural experiments, or situations in which comparable groups are created by differences that already occur in the real world. For example, Stratmann and Wille (2016) Stratmann, T. & Wille, D. (2016). Certificate-of-need laws and hospital quality. Mercatus Center at George Mason University, Arlington, VA. Retrieved from: https://www.mercatus.org/system/files/mercatus-stratmann-wille-con-hospital-quality-v1.pdf were interested in the effects of a state healthcare policy called Certificate of Need on the quality of hospitals. They clearly cannot assign states to adopt one set of policies or another. Instead, researchers used hospital referral regions, or the areas from which hospitals draw their patients, that spanned across state lines. Because the hospitals were in the same referral region, researchers could be pretty sure that the client characteristics were pretty similar. In this way, they could classify patients in experimental and comparison groups without affecting policy or telling people where to live.

There are important examples of policy experiments that use random assignment, including the Oregon Medicaid experiment. In the Oregon Medicaid experiment, the wait list for Oregon was so long, state officials conducted a lottery to see who from the wait list would receive Medicaid (Baicker et al., 2013). Baicker, K., Taubman, S. L., Allen, H. L., Bernstein, M., Gruber, J. H., Newhouse, J. P., ... & Finkelstein, A. N. (2013). The Oregon experiment—effects of Medicaid on clinical outcomes. New England Journal of Medicine368(18), 1713-1722. Researchers used the lottery as a natural experiment that included random assignment. People selected to be a part of Medicaid were the experimental group and those on the wait list were in the control group. There are some practical complications with using people on a wait list as a control group—most obviously, what happens when people on the wait list are accepted into the program while you’re still collecting data? Natural experiments aren’t a specific kind of experiment like quasi- or pre-experimental designs. Instead, they are more like a feature of the social world that allows researchers to use the logic of experimental design to investigate the connection between variables.


two cats dressed as matching avocados

Matching is another approach in quasi-experimental design to assigning experimental and comparison groups. Researchers should think about what variables are important in their study, particularly demographic variables or attributes that might impact their dependent variable. Individual matching involves pairing participants with similar attributes. When this is done at the beginning of an experiment, the matched pair is split—with one participant going to the experimental group and the other to the control group. An ex post facto control group, in contrast, is when a researcher matches individuals after the intervention is administered to some participants. Finally, researchers may engage in aggregate matching, in which the comparison group is determined to be similar on important variables.

There are many different quasi-experimental designs in addition to the nonequivalent comparison group design described earlier. Describing all of them is beyond the scope of this textbook, but one more design is worth mentioning. The time series design uses multiple observations before and after an intervention. In some cases, experimental and comparison groups are used. In other cases where that is not feasible, a single experimental group is used. By using multiple observations before and after the intervention, the researcher can better understand the true value of the dependent variable in each participant before the intervention starts. Additionally, multiple observations afterwards allow the researcher to see whether the intervention had lasting effects on participants. Time series designs are similar to single-subjects designs, which we will discuss in Chapter 15.

When true experiments and quasi-experiments are not possible, researchers may turn to a pre-experimental design (Campbell & Stanley, 1963). Campbell, D., & Stanley, J. (1963). Experimental and quasi-experimental designs for research. Chicago, IL: Rand McNally. Pre-experimental designs are called such because they often happen before a true experiment is conducted. Researchers want to see if their interventions will have some effect on a small group of people before they seek funding and dedicate time to conduct a true experiment. Pre-experimental designs, thus, are usually conducted as a first step towards establishing the evidence for or against an intervention. However, this type of design comes with some unique disadvantages, which we’ll describe as we review the pre-experimental designs available.

If we wished to measure the impact of a natural disaster, such as Hurricane Katrina for example, we might conduct a pre-experiment by identifying an experimental group from a community that experienced the hurricane and a control group from a similar community that had not been hit by the hurricane. This study design, called a static group comparison, has the advantage of including a comparison group that did not experience the stimulus (in this case, the hurricane). Unfortunately, it is difficult to know those groups are truly comparable because the experimental and control groups were determined by factors other than random assignment. Additionally, the design would only allow for posttests, unless one were lucky enough to be gathering the data already before Katrina. As you might have guessed from our example, static group comparisons are useful in cases where a researcher cannot control or predict whether, when, or how the stimulus is administered, as in the case of natural disasters.

In cases where the administration of the stimulus is quite costly or otherwise not possible, a one-shot case study design might be used. In this instance, no pretest is administered, nor is a control group present. In our example of the study of the impact of Hurricane Katrina, a researcher using this design would test the impact of Katrina only among a community that was hit by the hurricane and would not seek a comparison group from a community that did not experience the hurricane. Researchers using this design must be extremely cautious about making claims regarding the effect of the stimulus, though the design could be useful for exploratory studies aimed at testing one’s measures or the feasibility of further study.

Finally, if a researcher is unlikely to be able to identify a sample large enough to split into control and experimental groups, or if she simply doesn’t have access to a control group, the researcher might use a one-group pre-/posttest design. In this instance, pre- and posttests are both taken, but there is no control group to which to compare the experimental group. We might be able to study of the impact of Hurricane Katrina using this design if we’d been collecting data on the impacted communities prior to the hurricane. We could then collect similar data after the hurricane. Applying this design involves a bit of serendipity and chance. Without having collected data from impacted communities prior to the hurricane, we would be unable to employ a one- group pre-/posttest design to study Hurricane Katrina’s impact.

As implied by the preceding examples where we considered studying the impact of Hurricane Katrina, experiments do not necessarily need to take place in the controlled setting of a lab. In fact, many applied researchers rely on experiments to assess the impact and effectiveness of various programs and policies. You might recall our discussion of arresting perpetrators of domestic violence in Chapter 6, which is an excellent example of an applied experiment. Researchers did not subject participants to conditions in a lab setting; instead, they applied their stimulus (in this case, arrest) to some subjects in the field and they also had a control group in the field that did not receive the stimulus (and therefore were not arrested).


Key Takeaways

  • Quasi-experimental designs do not use random assignment.
  • Comparison groups are often used in quasi-experiments.
  • Matching is a way of improving the comparability of experimental and comparison groups.
  • Quasi-experimental designs and pre-experimental designs are often used when experimental designs are impractical.
  • Quasi-experimental and pre-experimental designs may be easier to carry out, but they lack the rigor of true experiments.


Glossary

  • Aggregate matching- when the comparison group is determined to be similar to the experimental group along important variables
  • Ex post facto control group- a control group created when a researcher matches individuals after the intervention is administered
  • Individual matching- pairing participants with similar attributes for the purpose of assignment to groups
  • Natural experiments- situations in which comparable groups are created by differences that already occur in the real world
  • Nonequivalent comparison group design- a quasi-experimental design similar to a classic experimental design but without random assignment
  • One-group pre-/posttest design- a pre-experimental design that applies an intervention to one group but also includes a pretest
  • One-shot case study- a pre-experimental design that applies an intervention to only one group without a pretest
  • Pre-experimental designs- a variation of experimental design that lacks the rigor of experiments and is often used before a true experiment is conducted
  • Quasi-experimental design- designs lack random assignment to experimental and control groups
  • Static group design- uses an experimental group and a comparison group, without random assignment and pretesting
  • Time series design- a quasi-experimental design that uses multiple observations before and after an intervention


58

12.3 The logic of experimental design

Learning Objectives

  • Apply the criteria of causality to experimental design
  • Define internal validity and external validity
  • Identify threats to validity


As we discussed at the beginning of this chapter, experimental design is commonly understood and implemented informally in everyday life. Trying out a new restaurant, dating a new person—we often term these experiments. As you’ve learned over the past two sections, in order for something to be a true experiment, or even a quasi- or pre-experiment, you must rigorously apply the various components of experimental design. A true experiment for trying a new restaurant would include recruitment of a large enough sample, random assignment to control and experimental groups, pretesting and posttesting, as well as using clearly and objectively defined measures of satisfaction with the restaurant.

Social scientists use this level of rigor and control because they try to maximize the internal validity of their experiment. Internal validity is the confidence researchers have about whether their intervention produced variation in their dependent variable. Thus, experiments are attempts to establish causality between two variables—your treatment and its intended outcome. As we talked about in Chapter 7, nomothetic causal relationships must establish four criteria: covariation, plausibility, temporality, and nonspuriousness.

The logic and rigor experimental design allows for causal relationships to be established. Experimenters can assess covariation on the dependent variable through pre- and posttests. The use of experimental and control conditions ensures that some people receive the intervention and others do not, providing variation in the independent variable. Moreover, since the researcher controls when the intervention is administered, she can be assured that changes in the independent variable (the treatment) happened before changes the dependent variable (the outcome). In this way, experiments assure temporality. In our restaurant experiment, we would know through assignment experimental and control groups that people varied in the restaurant they attended. We would also know whether their level of satisfaction changed, as measured by the pre- and posttest. We would also know that changes in our diners’ satisfaction occurred after they left the restaurant, not before they walked in because of the pre- and posttest.

Experimenters will also have a plausible reason why their intervention would cause changes in the dependent variable. Usually, a theory or previous empirical evidence should indicate the potential for a causal relationship. Perhaps we found a national poll that found the type of food our experimental restaurant served, let’s say pizza, is the most popular food in America. Perhaps this restaurant has good reviews on Yelp or Google. This evidence would give us a plausible reason to establish our restaurant as causing satisfaction.


scientists working on a solar cell array in clean suits
While you may not need a clean suit like these scientists, you need to similarly control for threats to the validity of your experiment.

One of the most important features of experiments is that they allow researchers to eliminate spurious variables. True experiments are usually conducted under strictly controlled laboratory conditions. The intervention must be given in the same way to each person, with a minimal number of other variables that might cause their posttest scores to change. In our restaurant example, this level of control might prove difficult. We cannot control how many people are waiting for a table, whether participants saw someone famous there, or if there is bad weather. Any of these factors might cause a diner to be less satisfied with their meal. These spurious variables may cause changes in satisfaction that have nothing to do with the restaurant itself, an important problem in real-world research. For this reason, experiments use the laboratory environment try to control as many aspects of the research process as possible. Researchers in large experiments often employ clinicians or other research staff to help them. Researchers train their staff members exhaustively, provide pre-scripted responses to common questions, and control the physical environment of the lab so each person who participates receives the exact same treatment.

Experimental researchers also document their procedures, so that others can review how well they controlled for spurious variables. My favorite example of this concept is Bruce Alexander’s Rat Park (1981) experiments because it spoke directly to my practice as a substance abuse and mental health social worker. Alexander, B. (2010). Addiction: The view from rat park. Retrieved from: http://www.brucekalexander.com/articles-speeches/rat-park/148-addiction-the-view-from-rat-park Much of the early research conducted on addictive drugs, like heroin and cocaine, was conducted on animals other than humans, usually mice or rats. While this may seem strange, the systems of our mammalian relatives are similar enough to humans that causal inferences can be made from animal studies to human studies. It is certainly unethical to deliberately cause humans to become addicted to cocaine and measure them for weeks in a laboratory, but it is currently more ethically acceptable to do so with animals. There are specific ethical processes for animal research, similar to an IRB review.

The scientific consensus up until Alexander’s experiments was that cocaine and heroin were so addictive that rats, if offered the drugs, would consume them repeatedly until they perished. Researchers claimed this behavior explained how addiction worked in humans, but Alexander was not so sure. He knew rats were social animals and the experimental procedure from previous experiments did not allow them to socialize. Instead, rats were kept isolated in small cages with only food, water, and metal walls. To Alexander, social isolation was a spurious variable, causing changes in addictive behavior not due to the drug itself. Alexander created an experiment of his own, in which rats were allowed to run freely in an interesting environment, socialize and mate with other rats, and of course, drink from a solution that contained an addictive drug. In this environment, rats did not become hopelessly addicted to drugs. In fact, they had little interest in the substance.

To Alexander, the results of his experiment demonstrated that social isolation was more of a causal factor for addiction than the drug itself. This makes intuitive sense to me. If I were in solitary confinement cell for most of my life, the escape of an addictive drug would seem more tempting than if I were in my natural environment with friends, family, and activities. One challenge with Alexander’s findings is that subsequent researchers have had mixed success replicating his findings (e.g., Petrie, 1996; Solinas, Thiriet, El Rawas, Lardeux, & Jaber, 2009). Petrie, B. F. (1996). Environment is not the most important variable in determining oral morphine consumption in Wistar rats. Psychological reports78(2), 391-400.; Solinas, M., Thiriet, N., El Rawas, R., Lardeux, V., & Jaber, M. (2009). Environmental enrichment during early stages of life reduces the behavioral, neurochemical, and molecular effects of cocaine. Neuropsychopharmacology34(5), 1102. Replication involves conducting another researcher’s experiment in the same manner and seeing if it produces the same results. If the causal relationship is real, it should occur in all (or at least most) replications of the experiment.

One of the defining features of experiments is that they report their procedures diligently, which allows for easier replication. Recently, researchers at the Reproducibility Project have caused a significant controversy in social science fields like psychology (Open Science Collaboration, 2015). Open Science Collaboration. (2015). Estimating the reproducibility of psychological science. Science349(6251), aac4716. In one study, researchers attempted reproduce the results of 100 experiments published in major psychology journals between 2008 and the present. What they found was shocking. The results of only 36% of the studies were reproducible. Despite coordinating closely with the original researchers, the Reproducibility Project found that nearly two-thirds of psychology experiments published in respected journals were not reproducible. The implications of the Reproducibility Project are staggering, and social scientists are coming up with new ways to ensure researchers do not cherry-pick data or change their hypotheses, simply to get published.

Returning to Alexander’s Rat Park study, consider what the implications of his experiment were to a substance abuse professional such as myself. The conclusions he drew from his experiments on rats were meant to generalize to the population of people with substance use disorders with whom I worked. Experiments seek to establish external validity, which is the degree to which their conclusions generalize to larger populations and different situations. Alexander argues his conclusions about addiction and social isolation help us understand why people living in deprived, isolated environments will often become addicted to drugs more often than those in more enriching environments. Similarly, earlier rat researchers argued their results showed these drugs were instantly addictive, often to the point of death.

Neither study will match up perfectly with real life. I met in my practice many individuals who may have fit into Alexander’s social isolation model, but social isolations for humans is complex. My clients lived in environments with other sociable humans, worked jobs, and had romantic relationships, so how isolated were they? On the other hand, many faced structural racism, poverty, trauma, and other challenges that may contribute to social isolation. Alexander’s work helped me understand part of my clients’ experiences, but the explanation was incomplete. The real world was much more complicated than the experimental conditions in Rat Park, just as humans are more complex than rats.

Social workers are especially attentive to how social context shapes social life. So, we are likely to point out a specific disadvantage of experiments. They are rather artificial. How often do real-world social interactions occur in the same way that they do in a lab? Experiments that are conducted in community settings may not be as subject to artificiality, though then their conditions are less easily controlled. This relationship demonstrates the tension between internal and external validity. The more researchers tightly control the environment to ensure internal validity, the less they can claim external validity and that their results are applicable to different populations and circumstances. Correspondingly, researchers whose settings are just like the real world will be less able to ensure internal validity, as there are many factors that could pollute the research process. This is not to suggest that experimental research cannot have external validity, but experimental researchers must always be aware that external validity problems can occur and be forthcoming in their reports of findings about this potential weakness.

Threats to validity

Internal validity and external validity are conceptually linked. Internal validity refers to the degree to which the intervention causes its intended outcomes, and external validity refers to how well that relationship applies to different groups and circumstances. There are a number of factors that may influence a study’s validity. You might consider these threats to all be spurious variables, as we discussed at the beginning of this section. Each threat proposes another factor that is changing the relationship between intervention and outcome. The threats introduce error and bias into the experiment.


child with hands over his face in embarrassment with a question mark next to him

Throughout this chapter, we reviewed the importance of experimental and control groups. These groups must be comparable in order for experimental design to work. Comparable groups are groups that are similar across factors important for the study. Researchers can help establish comparable groups by using probability sampling, random assignment, or matching techniques. Control or comparison groups provide a counterfactual—what would have happened to my experimental group had I not given them my intervention? Two very different groups would not allow you to answer that question. Intuitively, we all know that no two people are exactly the same. So, no groups are ever perfectly comparable. What’s important is ensuring groups are comparable along the variables relevant to the research project.

In our restaurant example, if one of my groups had far more vegetarians or people with gluten issues, it might influence how satisfied they were with my restaurant. My groups, in that case, would not be comparable. Researchers also account for this by measuring other variables, like dietary preference, and controlling for their effects statistically, after the data are collected. We discussed control variables like these in Chapter 7. Similarly, if I were to pick out people I thought would “really like” my restaurant and assign them to the experimental group, I would be introducing selection bias into my sample. This is another reason experimenters use random assignment, so conscious and unconscious bias do not influence to which group a participant is assigned.

Experimenters themselves are often the source of threats to validity. They may choose measures that do not accurately measure participants or implement the measure in a way that biases participant responses in one direction or another. Researchers may, just by the very act of conducting an experiment, influence participants to perform differently. Experiments are different from participants’ normal routines. The novelty of a research environment or experimental treatment may cause them to expect to feel differently, independently of the actual intervention. You have likely heard of the placebo effect, in which a participant feels better, despite having received no intervention at all.

Researchers may also introduce error by expecting participants in each group to behave differently. For the experimental group, researchers may expect them to feel better and may give off conscious or unconscious cues to participants that influence their outcomes. Control groups will be expected to fare worse, and research staff could cue participants that they should feel worse than they otherwise would. For this reason, researchers often use double-blind designs wherein research staff interacting with participants are unaware of who is in the control or experimental group. Proper training and supervision are also necessary to account for these and other threats to validity. If proper supervision is not applied, research staff administering the control group may try to equalize treatment or engage in a rivalry with research staff administering the experimental group (Engel & Schutt, 2016). Engel, R. J. & Schutt, R. K. (2016). The practice of research in social work (4th ed.). Washington, DC: SAGE Publishing.

No matter how tightly the researcher controls the experiment, participants are humans and are therefore curious, problem-solving creatures. Participants who learn they are in the control group may react by trying to outperform the experimental group or by becoming demoralized. In either case, their outcomes in the study would be different had they been unaware of their group assignment. Participants in the experimental group may begin to behave differently or share insights from the intervention with individuals in the control group. Whether through social learning or conversation, participants in the control group may receive parts of the intervention of which they were supposed to be unaware. Experimenters, as a result, try to keep experimental and control groups as separate as possible. Inside a laboratory study, this is significantly easier as the researchers control access and timing at the facility. In agency-based research, this problem is more complicated. If your intervention is good, your participants in the experimental group may impact the control group by behaving differently and sharing the insights they’ve learned with their peers. Agency-based researchers may locate experimental and control conditions at separate offices with separate treatment staff to minimize the interaction between their participants.


Key Takeaways

  • Experimental design provides researchers with the ability to best establish causality between their variables.
  • Experiments provide strong internal validity but may have trouble achieving external validity.
  • Experimental deigns should be reproducible by future researchers.
  • Threats to validity come from both experimenter and participant reactivity.


Glossary

  • Comparable groups- groups that are similar across factors important for the study
  • Double-blind- when researchers interact with participants are unaware of who is in the control or experimental group
  • External validity- the degree to which experimental conclusions generalize to larger populations and different situations
  • Internal validity- the confidence researchers have about whether their intervention produced variation in their dependent variable
  • Placebo effect- when a participant feels better, despite having received no intervention at all
  • Replication- conducting another researcher’s experiment in the same manner and seeing if it produces the same results
  • Selection bias- when a researcher consciously or unconsciously influences assignment into experimental and control groups


Image attributions

One of Juno’s solar panels before illumination test by NASA/Jack Pfaller public domain

mistake by Tumisu CC-0


59

12.4 Analyzing quantitative data

Learning Objectives

  • Define response rate, and discuss some of the current thinking about response rates
  • Describe what a codebook is and what purpose it serves
  • Define univariate, bivariate, and multivariate analysis
  • Identify and apply each of the measures of central tendency
  • Describe what a contingency table displays


This textbook is primarily focused on designing research, collecting data, and becoming a knowledgeable and responsible consumer of research. We won’t spend as much time on data analysis or what to do with our data once we’ve designed a study and collected it, but I will spend some time describing some important basics of data analysis that are unique to each method. Entire textbooks could be (and have been) written entirely on data analysis. In fact, if you’ve ever taken a statistics class, you already know much about how to analyze quantitative survey data. Here we’ll go over a few basics that can get you started as you begin to think about turning data from surveys and experiences into findings that you can share.

Who responds to your questionnaire?

It can be very exciting to receive those first few completed questionnaires back from respondents. Hopefully you’ll even get more than a few back, and once you have a handful of completed questionnaires, your feelings may go from initial euphoria to dread. Data are fun and can also be overwhelming. The goal with data analysis is to be able to condense large amounts of information into usable and understandable chunks.

In an experiment, as long as no one drops out, you can be assured that everyone in your sample will complete your questionnaires as part of their pretest and posttest. For surveys, it is much less likely that everyone will complete your questionnaire. The hope is that you will receive a good portion of the questionnaires you distributed back in a completed and readable format. The number of completed questionnaires you receive divided by the number of questionnaires you distributed is your response rate. Let’s say your sample included 100 people and you sent questionnaires to each of those people. It would be wonderful if all 100 returned completed questionnaires, but the chances of that happening are about zero. If you’re lucky, perhaps 75 or so will return completed questionnaires. In this case, your response rate would be 75%. The response rate is calculated by dividing the number of surveys returned by the number of surveys distributed.

Though response rates vary, and researchers don’t always agree about what makes a good response rate, having 75% of your surveys returned would be considered good—even excellent—by most survey researchers. There has been a lot of research done on how to improve a survey’s response rate. We covered some of these previously, but suggestions include personalizing questionnaires by, for example, addressing them to specific respondents rather than to some generic recipient, such as “madam” or “sir”; enhancing the questionnaire’s credibility by providing details about the study, contact information for the researcher, and perhaps partnering with agencies likely to be respected by respondents such as universities, hospitals, or other relevant organizations; sending out pre-questionnaire notices and post-questionnaire reminders; and including some token of appreciation with mailed questionnaires even if small, such as a $1 bill.


nine computer monitors with cartoon graphics displayed on them

The major concern with response rates is that a low rate of response may introduce nonresponse bias into a study’s findings. What if only those who have strong opinions about your study topic return their questionnaires? If that is the case, we may well find that our findings don’t at all represent how things really are or, at the very least, we are limited in the claims we can make about patterns found in our data. While high return rates are certainly ideal, a recent body of research shows that concern over response rates may be overblown (Langer, 2003). Langer, G. (2003). About response rates: Some unresolved questions. Public Perspective, May/June, 16–18. Retrieved from: https://www.aapor.org/AAPOR_Main/media/MainSiteFiles/Response_Rates_-_Langer.pdf Several studies have shown that low response rates did not make much difference in findings or in sample representativeness (Curtin, Presser, & Singer, 2000; Keeter, Kennedy, Dimock, Best, & Craighill, 2006; Merkle & Edelman, 2002). Curtin, R., Presser, S., & Singer, E. (2000). The effects of response rate changes on the index of consumer sentiment. Public Opinion Quarterly, 64, 413–428; Keeter, S., Kennedy, C., Dimock, M., Best, J., & Craighill, P. (2006). Gauging the impact of growing nonresponse on estimates from a    national RDD telephone survey. Public Opinion Quarterly, 70, 759–779; Merkle, D. M., & Edelman, M. (2002). Nonresponse in exit polls: A comprehensive analysis. In M. Groves, D. A. Dillman, J. L. Eltinge, & R. J. A. Little (Eds.), Survey nonresponse (pp. 243–258). New York, NY: John Wiley and Sons. For now, the jury may still be out on what makes an ideal response rate and on whether, or to what extent, researchers should be concerned about response rates. Nevertheless, certainly no harm can come from aiming for as high a response rate as possible.

Building a codebook

Regardless of your response rate, a major concern of quantitative researchers once they have their big stack of completed questionnaires is condensing their data into manageable and analyzable, bits. One major advantage of quantitative methods such as surveys and experiments, as you may recall from Chapter 1, is that they enable researchers to describe large amounts of data because they can be represented by and condensed into numbers.

In order to condense your completed surveys into analyzable numbers, you’ll first need to create a codebook. A codebook is a document that outlines how a survey researcher has translated her data from words into numbers. An excerpt from a codebook can be seen in Table 12.2. As you’ll see in the table, in addition to converting response options into numerical values, a short variable name is given to each question. This shortened name comes in handy when entering data into a computer program for analysis.

Table 12.2 Codebook excerpt from survey of older workers
Variable # Variable Name Question Options
11


FINSEC


In general, how financially secure would you say you are?


1 = Not at all secure
2 = Between not at all and moderately secure
3 = Moderately secure
4 = Between moderately secure and very secure
5 = Very secure
12 FINFAM Since age 62, have you ever received money from family members or friends to help make ends meet? 0 = No
1 = Yes
13 FINFAMT If yes, how many times? 1 = 1 or 2 times
2 = 3 or 4 times
3 = 5 times or more
14 FINCHUR Since age 62, have you ever received money from a church or other organization to help make ends meet? 0 = No
1 = Yes
15 FINCHURT If yes, how many times? 1 = 1 or 2 times
2 = 3 or 4 times
3 = 5 times or more
16 FINGVCH Since age 62, have you ever donated money to a church or other organization? 0 = No
1 = Yes
17 FINGVFAM Since age 62, have you ever given money to a family member or friend to help them make ends meet? 0 = No
1 = Yes

The next task after creating your codebook is data entry. If you’ve utilized an online tool such as SurveyMonkey to administer your questionnaire, here’s some good news—most online survey tools come with the capability of importing survey results directly into a data analysis program. Trust me—this is excellent news. (If you don’t believe me, I highly recommend administering hard copies of your questionnaire next time around. You’ll surely then appreciate the wonders of online survey administration!)

For those who will be conducting manual data entry, there probably isn’t much I can say about this task that will make you want to perform it other than pointing out the reward of having a data set of your very own ready to analyze. At best, it is a Zen-like practice akin to raking sand. At worst, it is mind-numbingly boring. While you can pay someone else to do your data entry for you, a common practice with undergraduate and graduate research assistants, you should ask yourself whether you trust someone else to make no errors in entering your data. If errors are made in data entry, it can jeopardize the results of your project. You may want to consider whether it is worth your time and effort to do your data entry yourself.

We won’t get into too many of the details of data entry, but I will mention a few programs that survey researchers may use to analyze data once it has been entered. The first is SPSS or the Statistical Package for the Social Sciences (http://www.spss.com). SPSS is a statistical analysis computer program designed to analyze just the sort of data quantitative survey researchers collect. It can perform everything from very basic descriptive statistical analysis to more complex inferential statistical analysis. SPSS is touted by many for being highly accessible and relatively easy to navigate (with practice). Other programs that are known for their accessibility include MicroCase (http://www.microcase.com/index.html), which includes many of the same features as SPSS, and Excel, which is far less sophisticated in its statistical capabilities but is relatively easy to use and suits some researchers’ purposes just fine.

Identifying patterns

Data analysis is about identifying, describing, and explaining patterns. Univariate analysis is the most basic form of analysis that quantitative researchers conduct. In this form, researchers describe patterns across just one variable. Univariate analysis includes frequency distributions and measures of central tendency. A frequency distribution is a way of summarizing the distribution of responses on a single survey question. Let’s look at the frequency distribution for just one variable from a survey of older workers. We’ll analyze the item mentioned first in the codebook excerpt given earlier, which is on respondents’ self-reported financial security.

Table 12.3 Frequency distribution of older workers’ financial security
In general, how financially secure would you say you are? Value Frequency Percentage
Not at all secure 1 46 25.6
Between not at all and moderately secure 2 43 23.9
Moderately secure 3 76 42.2
Between moderately and very secure 4 11 6.1
Very secure 5 4 2.2
Total valid cases = 180; no response = 3

As you can see in the frequency distribution on self-reported financial security, more respondents reported feeling “moderately secure” than any other response category. We also learn from this single frequency distribution that fewer than 10% of respondents reported being in one of the two most secure categories.

Another form of univariate analysis that survey researchers can conduct on single variables is measures of central tendency. Measures of central tendency can be taken for variables at any level of measurement we reviewed in Chapter 9—from nominal to ratio. There are three measures of central tendency: modes, medians, and means. Mode refers to the most common response given to a question. Modes are most appropriate for nominal-level variables. A median is the middle point in a distribution of responses. In the previous example, if you wrote out all 180 responses to the question, side by side, from smallest to largest (1,1,1….5,5,5), the median would be the middle number. Finally, the measure of central tendency used for interval- and ratio-level variables is the mean. More commonly known as an average, means can be obtained by adding the value of all responses on a given variable and then dividing that number of the total number of responses.

Median is the appropriate measure of central tendency for ordinal-level variables, though it is sometimes used for interval or ratio variables whose distribution contains outliers or extreme scores that would skew the mean higher than the true center of the distribution. For example, if you asked your four friends about how much money they have in their wallets and one of them just won the lottery, the mean would be quite high, even though most of you do not have near that amount. The median value would be closer to the true center, in this case, than the mean.

In the previous example of older workers’ self-reported levels of financial security, the appropriate measure of central tendency would be the median, as this is an ordinal-level variable. If we were to list all responses to the financial security question in order and then choose the middle point in that list, we’d have our median.

In Figure 12.2, the value of each response to the financial security question is noted, and the middle point within that range of responses is highlighted. To find the middle point, we simply divide the number of valid cases by two. The number of valid cases, 180, divided by 2 is 90, so we’re looking for the 90th value on our distribution to discover the median. As you’ll see in Figure 12.2, that value is 3; thus, the median on our financial security question is 3 or “moderately secure.”


responses in a distribution arranged from smallest to largest, noting the middle value
Figure 12.2 Distribution of responses and median value on workers’ financial security

Figure 12.2 copied from Blackstone, A. (2012). Principles of sociological inquiry: Qualitative and quantitative methods. Saylor Foundation. Retrieved from: https://saylordotorg.github.io/text_principles-of-sociological-inquiry-qualitative-and-quantitative-methods/ Shared under CC-BY-NC-SA 3.0 License (https://creativecommons.org/licenses/by-nc-sa/3.0/)

As you can see, we can learn a lot about our respondents simply by conducting univariate analysis of measures on our survey. We can learn even more, of course, when we begin to examine relationships across multiple variables. Either we can analyze the relationships between two variables, called bivariate analysis, or we can examine relationships among more than two variables. This latter type of analysis is known as multivariate analysis.

Bivariate analysis allows us to assess covariation among two variables. We reviewed covariation in Chapter 7. This means we can find out whether changes in one variable occur together with changes in another. If two variables do not covary, they are said to have independence. This means simply that there is no relationship between the two variables in question. To learn whether a relationship exists between two variables, a researcher may cross-tabulate the two variables and present their relationship in a contingency table. A contingency table shows how variation on one variable may be contingent on variation on the other.

Let’s take a look at a contingency table. In Table 12.4, I have cross-tabulated two questions from an older worker survey: respondents’ reported gender and their self-rated financial security.

Table 12.4 Financial security among men and women workers age 62 and up
Men Women
Not financially secure (%) 44.1 51.8
Moderately financially secure (%) 48.9 39.2
Financially secure (%) 7.0 9.0
Total N = 43 N = 135

You’ll see in Table 12.4 that I collapsed a couple of the financial security response categories (recall there were five categories presented in Table 12.3). Researchers sometimes collapse response categories on items such as this in order to make it easier to read results in a table. You’ll also see that I placed the variable “gender” in the table’s columns and “financial security” in its rows. Typically, values that are contingent on other values (dependent variables) are placed in rows, while independent variables are placed in columns. This makes comparing across categories of ourindependentvariableprettysimple.

Reading across the top row of our table, we can see that around 44% of men in the sample reported that they are not financially secure while almost 52% of women reported the same. In other words, more women than men reported they are not financially secure. You’ll also see in the table that I reported the total number of respondents for each category of the independent variable in the table’s bottom row. This is also standard practice in a bivariate table, as is including a table heading describing what is presented in the table.

Researchers interested in simultaneously analyzing relationships among more than two variables conduct multivariate analysis. If I hypothesized that financial security declines for women as they age but increases for men as they age, I might consider adding age to the preceding analysis. To do so would require multivariate, rather than bivariate, analysis. This is common in studies with multiple independent or dependent variables. It is also necessary for studies that include control variables, which almost all studies do. We won’t go into detail here about how to conduct multivariate analysis of quantitative survey items here. If you are interested in learning more about the analysis of quantitative survey data, I recommend checking out your campus’s offerings in statistics classes. The quantitative data analysis skills you will gain in a statistics class could serve you quite well should you find yourself seeking employment one day.


Key Takeaways

  • While survey researchers should always aim to obtain the highest response rate possible, some recent research argues that high return rates on surveys may be less important than we once thought.
  • There are several computer programs designed to assist quantitative researchers with analyzing their data include SPSS, MicroCase, and Excel.
  • Data analysis is about identifying, describing, and explaining patterns.
  • Contingency tables show how, or whether, one variable covaries with another.


Glossary

  • Bivariate analysis- quantitative analysis that examines relationships among two variables
  • Codebook- a document that outlines how a survey researcher has translated her data from words into numbers
  • Contingency table- shows how variation on one variable may be contingent on variation on the other
  • Frequency distribution- summarizes the distribution of responses on a single survey question
  • Independence- there is no relationship between the two variables in question
  • Mean- also known as the average, this is the sum of the value of all responses on a given variable divided by the total number of responses
  • Median- the value that lies in the middle of a distribution of responses
  • Mode- the most common response given to a question
  • Multivariate analysis- quantitative analysis that examines relationships among more than two variables
  • Nonresponse bias- bias reflected differences between people who respond to your survey and those who do not respond
  • Response rate- the number of people who respond to your survey divided by the number of people to whom the survey was distributed
  • Univariate analysis- quantitative analysis that describes patterns across just one variable


Image attributions

website by JuralMin CC-0


XIII

13. Interviews and focus groups

60

13.1 Interview research: What is it and when should it be used?

Learning Objectives

  • Define interviews from the social scientific perspective
  • Identify when it is appropriate to employ interviews as a data-collection strategy


Knowing how to create and conduct a good interview is an essential skill. Interviews are used by market researchers to learn how to sell their products, and journalists use interviews to get information from a whole host of people from VIPs to random people on the street. Police use interviews to investigate crimes. It seems everyone who’s anyone knows how to conduct an interview.


two people talking in a dark restaurant

In social science, interviews are a method of data collection that involves two or more people exchanging information through a series of questions and answers. The questions are designed by a researcher to elicit information from interview participants on a specific topic or set of topics. These topics are informed by the author’s research questions. Typically, interviews involve an in-person meeting between two people—an interviewer and an interviewee– but interviews need not be limited to two people, nor must they occur in-person.

The question of when to conduct an interview might be on your mind. Interviews are an excellent way to gather detailed information. They also have an advantage over surveys—they can change as you learn more information. In a survey, you cannot change what questions you ask if a participant’s response sparks some follow-up question in your mind. All participants must get the same questions. The questions you decided to put on your survey during the design stage determine what data you get. In an interview, however, you can follow up on new and unexpected topics that emerge during the conversation. Trusting in emergence and learning from your participants are hallmarks of qualitative research. In this way, interviews are a useful method to use when you want to know the story behind responses you might receive in a written survey.

Interviews are also useful when the topic you are studying is rather complex, requires lengthy explanation, or needs a dialogue between two people to thoroughly investigate. Also, if people will describe the process by which a phenomenon occurs, like how a person makes a decision, then interviews may be the best method for you. For example, you could use interviews to gather data about how people reach the decision not to have children and how others in their lives have responded to that decision. To understand these “how’s” you would need to have some back-and-forth dialogue with respondents. When they begin to tell you their story, inevitably new questions that hadn’t occurred to you from prior interviews would come up because each person’s story is unique. Also, because the process of choosing not to have children is complex for many people, describing that process by responding to closed-ended questions on a survey wouldn’t work particularly well.

In sum, interview research is especially useful when the following are true:


Key Takeaways

  • Understanding how to design and conduct interview research is a useful skill to have.
  • In a social scientific interview, two or more people exchange information through a series of questions and answers.
  • Interview research is often used when detailed information is required and when a researcher wishes to examine processes.


Glossary

  • Interviews- a method of data collection that involves two or more people exchanging information through a series of questions and answers


Image attributions

interview restaurant a pair by alda2 CC-0


61

13.2 Qualitative interview techniques

Learning Objectives

  • Identify the primary aim of in-depth interviews
  • Describe what makes qualitative interview techniques unique
  • Define the term interview guide and describe how to construct an interview guide
  • Outline the guidelines for constructing good qualitative interview questions
  • Describe how writing field notes and journaling function in qualitative research
  • Identify the strengths and weaknesses of interviews


Qualitative interviews are sometimes called intensive or in-depth interviews. These interviews are semi-structured; the researcher has a particular topic about which she would like to hear from the respondent, but questions are open-ended and may not be asked in exactly the same way or in exactly the same order to each and every respondent. For in-depth interviews, the primary aim is to hear from respondents about what they think is important about the topic at hand and to hear it in their own words. In this section, we’ll take a look at how to conduct qualitative interviews, analyze interview data, and identify some of the strengths and weaknesses of this method.

Constructing an interview guide

Qualitative interviews might feel more like a conversation than an interview to respondents, but the researcher is in fact usually guiding the conversation with the goal in mind of gathering information from a respondent. Qualitative interviews use open-ended questions, which are questions that a researcher poses but does not provide answer options for. Open-ended questions are more demanding of participants than closed-ended questions for they require participants to come up with their own words, phrases, or sentences to respond.


hand holding a post-it note that says "who, how, what, when, why, where"

In a qualitative interview, the researcher usually develops a guide in advance that she then refers to during the interview (or memorizes in advance of the interview). An interview guide is a list of topics or questions that the interviewer hopes to cover during the course of an interview. It is called a guide because it is simply that—it is used to guide the interviewer, but it is not set in stone. Think of an interview guide like your agenda for the day or your to-do list—both probably contain all the items you hope to check off or accomplish, though it probably won’t be the end of the world if you don’t accomplish everything on the list or if you don’t accomplish it in the exact order that you have it written down. Perhaps new events will come up that cause you to rearrange your schedule just a bit, or perhaps you simply won’t get to everything on the list.

Interview guides should outline issues that a researcher feels are likely to be important. Because participants are asked to provide answers in their own words and to raise points they believe are important, each interview is likely to flow a little differently. While the opening question in an in-depth interview may be the same across all interviews, from that point on, what the participant says will shape how the interview proceeds. This, I believe, is what makes in-depth interviewing so exciting–and rather challenging. It takes a skilled interviewer to be able to ask questions; listen to respondents; and pick up on cues about when to follow up, when to move on, and when to simply let the participant speak without guidance or interruption.

I’ve said that interview guides can list topics or questions. The specific format of an interview guide might depend on your style, experience, and comfort level as an interviewer or with your topic. Figure 13.1 provides an example of an interview guide for a study of how young people experience workplace sexual harassment. The guide is topic-based, rather than a list of specific questions. The ordering of the topics is important, though how each comes up during the interview may vary.


interview guide using topics, not questions
Figure 13.1 Interview guide displaying topics rather than questions

Figure 13.1 is copied from Blackstone, A. (2012) Principles of sociological inquiry: Qualitative and quantitative methods. Saylor Foundation. Retrieved from: https://saylordotorg.github.io/text_principles-of-sociological-inquiry-qualitative-and-quantitative-methods/ Shared under CC-BY-NC-SA 3.0 License (https://creativecommons.org/licenses/by-nc-sa/3.0/)

In my interviews with state administrators of developmental disabilities departments, the interview guide contained 15 questions all of which were asked to each participant. Sometimes, participants would cover the answer to one question before it was read. When I came to that question later on in the interview, I would acknowledge that they already addressed part of this question and ask them if they had anything to add to their response. Underneath some of the questions were more specific words or phrases for follow-up in case the participant did not mention those topics in their responses. These probes, as well as the questions, were based on our review of their department’s documentation about their programs. Our study was a challenging one in that administrators may have thought that since we were studying a particular kind of program, we may have an agenda to try and convince administrators to expand or better fund that program. We had to be very objective in how we worded questions to avoid the appearance of bias. Some of these questions are depicted in Figure 13.2.

interview guide using questions rather than topic
Figure 13.2 Interview guide displaying questions rather than topics

As you might have guessed, interview guides do not appear out of thin air. They are the result of thoughtful and careful work on the part of a researcher. As you can see in both of the preceding guides, the topics and questions have been organized thematically and in the order in which they are likely to proceed (though keep in mind that the flow of a qualitative interview is in part determined by what a respondent has to say). Sometimes qualitative interviewers may create two versions of the interview guide: one version contains a very brief outline of the interview, perhaps with just topic headings, and another version contains detailed questions underneath each topic heading. In this case, the researcher might use the very detailed guide to prepare and practice in advance of actually conducting interviews and then just bring the brief outline to the interview. Bringing an outline, as opposed to a very long list of detailed questions, to an interview encourages the researcher to actually listen to what a participant is telling her. An overly detailed interview guide will be difficult to navigate during an interview and could give respondents the misimpression the interviewer is more interested in her questions than in the participant’s answers.

When beginning to construct an interview guide, brainstorming is usually the first step. There are no rules at the brainstorming stage—simply list all the topics and questions that come to mind when you think about your research question. Once you’ve got a pretty good list, you can begin to pare it down by cutting questions and topics that seem redundant and group like questions and topics together. If you haven’t done so yet, you may also want to come up with question and topic headings for your grouped categories. You should also consult the scholarly literature to find out what kinds of questions other interviewers have asked in studies of similar topics and what theory indicates might be important. As with quantitative survey research, it is best not to place very sensitive or potentially controversial questions at the very beginning of your qualitative interview guide. You need to give participants the opportunity to warm up to the interview and to feel comfortable talking with you. Finally, get some feedback on your interview guide. Ask your friends, other researchers, and your professors for some guidance and suggestions once you’ve come up with what you think is a strong guide. Chances are they’ll catch a few things you hadn’t noticed. Your participants may also suggest revisions or improvements, once you begin your interviews.

In terms of the specific questions you include in your guide, there are a few guidelines worth noting. First, avoid questions that can be answered with a simple yes or no. Try to rephrase your questions in a way that invites longer responses from your interviewees. If you choose to include yes or no questions, be sure to include follow-up questions. Remember, one of the benefits of qualitative interviews is that you can ask participants for more information—be sure to do so. While it is a good idea to ask follow-up questions, try to avoid asking “why” as your follow-up question, as this particular question can come off as confrontational, even if that is not your intent. Often people won’t know how to respond to “why,” perhaps because they don’t even know why themselves. Instead of “why,” I recommend that you say something like, “Could you tell me a little more about that?” This allows participants to explain themselves further without feeling that they’re being doubted or questioned in a hostile way.

Also, try to avoid phrasing your questions in a leading way. For example, rather than asking, “Don’t you think most people who don’t want kids are selfish?” you could ask, “What comes to mind for you when you hear someone doesn’t want kids?” Or rather than asking, “What do you think about juvenile offenders who drink and drive?” you could ask, “How do you feel about underage drinking?” or “What do you think about drinking and driving?” Finally, remember to keep most, if not all, of your questions open-ended. The key to a successful qualitative interview is giving participants the opportunity to share information in their own words and in their own way. Documenting decisions that you make along the way regarding which questions are used, thrown out, or revised can help a researcher remember during analysis the thought process behind the interview guide. Additionally, it promotes the rigor of the qualitative project as a whole, ensuring the researcher is proceeding in a reflective and deliberate manner that can be checked by others reviewing her study.

Recording qualitative data

Even after the interview guide is constructed, the interviewer is not yet ready to begin conducting interviews. The researcher next has to decide how to collect and maintain the information that is provided by participants. Researchers keep field notes or written recordings produced by the researcher during the data collection process, including before, during, and after interviews. Field notes help researchers document what they observe, and in so doing, they form the first draft of data analysis. Field notes may contain many things—observations of body language or environment, reflections on whether interview questions are working well, and connections between ideas that participants share.


a woman writing down notes in a journal while seated in a field

Unfortunately, even the most diligent researcher cannot write down everything that is seen or heard during an interview. In particular, it is difficult for a researcher to be truly present and observant if she is also writing down everything the participant is saying. For this reason, it is quite common for interviewers to create audio recordings of the interviews they conduct. Recording interviews allows the researcher to focus on her interaction with the interview participant rather than being distracted by trying to write down every word that is said.

Of course, not all participants will feel comfortable being recorded and sometimes even the interviewer may feel that the subject is so sensitive that recording would be inappropriate. If this is the case, it is up to the researcher to balance excellent note-taking with exceptional question-asking and even better listening. I don’t think I can understate the difficulty of managing all these feats simultaneously. Whether you will be recording your interviews or not (and especially if not), practicing the interview in advance is crucial. Ideally, you’ll find a friend or two willing to participate in a couple of trial runs with you. Even better, you’ll find a friend or two who are similar in at least some ways to your sample. They can give you the best feedback on your questions and your interview demeanor.

Another issue interviewers face is documenting the decisions made during the data collection process. Qualitative research is open to new ideas that emerge through the data collection process. For example, a participant might suggest a new concept you hadn’t thought of before or define a concept in a new way. This may lead you to create new questions or ask questions in a different way to future participants. These processes should be documented in a process called journaling or memoing. Journal entries are notes to yourself about reflections or methodological decisions that emerge during the data collection process. Documenting these decisions is important, as you’d be surprised how quickly you can forget what happened. Journaling makes sure that when it comes time to analyze your data, you remember how, when, and why certain changes were made. The discipline of journaling in qualitative research helps to ensure the rigor of the research process—that is its trustworthiness and authenticity. We covered these standards of qualitative rigor in Chapter 9.

Strengths and weaknesses of qualitative interviews

As we’ve mentioned in this section, qualitative interviews are an excellent way to gather detailed information. Any topic can be explored in much more depth with interviews than with almost any other method. Not only are participants given the opportunity to elaborate in a way that is not possible with other methods such as survey research, but they also are able share information with researchers in their own words and from their own perspectives. Whereas, quantitative research asks participants to fit their perspectives into the limited response options provided by the researcher. And because qualitative interviews are designed to elicit detailed information, they are especially useful when a researcher’s aim is to study social processes or the “how” of various phenomena. Yet another, and sometimes overlooked, benefit of qualitative interviews that occurs in person is that researchers can make observations beyond those that a respondent is orally reporting. A respondent’s body language, and even their choice of time and location for the interview, might provide a researcher with useful data.

Of course, all these benefits come with some drawbacks. As with quantitative survey research, qualitative interviews rely on respondents’ ability to accurately and honestly recall specific details about their lives, circumstances, thoughts, opinions, or behaviors. As Esterberg (2002) puts it, “If you want to know about what people actually do, rather than what they say they do, you should probably use observation [instead of interviews].” Esterberg, K. G. (2002). Qualitative methods in social research. Boston, MA: McGraw-Hill. Further, as you may have already guessed, qualitative interviewing is time-intensive and can be quite expensive. Creating an interview guide, identifying a sample, and conducting interviews are just the beginning. Writing out what was said in interviews and analyzing the qualitative are time consuming processes. Keep in mind you are also asking for more of participants’ time than if you’d simply mailed them a questionnaire containing closed-ended questions. Conducting qualitative interviews is not only labor-intensive but can also be emotionally taxing. Seeing and hearing the impact that social problems have on respondents is difficult. Researchers embarking on a qualitative interview project should keep in mind their own abilities to receive stories that may be difficult to hear.


Key Takeaways

  • In-depth interviews are semi-structured interviews where the researcher has topics and questions in mind to ask, but questions are open-ended and flow according to how the participant responds to each.
  • Interview guides can vary in format but should contain some outline of the topics you hope to cover during the course of an interview.
  • Qualitative interviews allow respondents to share information in their own words and are useful for gathering detailed information and understanding social processes.
  • Field notes and journaling document decisions and thoughts the researcher has that influence the research process.
  • Drawbacks of qualitative interviews include reliance on respondents’ accuracy and their intensity in terms of time, expense, and possible emotional strain.


Glossary

  • Field notes- written notes produced by the researcher during the data collection process
  • In-depth interviews- interviews in which researchers hear from respondents about what they think is important about the topic at hand in the respondent’s own words
  • Interview guide- a list of topics or questions that the interviewer hopes to cover during the course of an interview
  • Journaling- making notes of emerging issues and changes during the research process
  • Semi-structured interviews- questions are open ended and may not be asked in exactly the same way or in exactly the same order to each and every respondent


Image attributions

questions by geralt CC-0

writing by StockSnap CC-0


62

13.3 Issues to consider for all interview types

Learning Objectives

  • Identify the three main issues that interviewers should consider
  • Describe how interviewers can address power imbalances
  • Describe and define rapport
  • Define the term probe


Qualitative researchers are attentive to the complexities that arise during the interview process. Interviews are intimate processes. Your participants will share with you how they view the world, how they understand themselves, and how they cope with events that happened to them. Conscientious researchers should keep in mind the following topics to ensure the authenticity and trust necessary for successful interviews.

Power

First and foremost, interviewers must be aware of and attentive to the power differential between themselves and interview participants. The interviewer sets the agenda and leads the conversation. Qualitative interviewers aim to allow participants to have some control over which or to what extent various topics are discussed, but at the end of the day, it is the researcher who is in charge of the interview and how the data are reported to the public. The participant loses the ability to shape the narrative after the interview is over because it is the researcher who tells the story to the world. As the researcher, you are also asking someone to reveal things about themselves they may not typically share with others. Researchers do not reciprocate by revealing much or anything about themselves. All these factors shape the power dynamics of an interview.


a fist striking a table

A number of excellent pieces have been written dealing with issues of power in research and data collection. Feminist researchers in particular paved the way in helping researchers think about and address issues of power in their work (Oakley, 1981). Oakley, A. (1981). Interviewing women: A contradiction in terms. In H. Roberts (Ed.), Doing feminist research (pp. 30–61). London, UK: Routledge & Kegan Paul. Suggestions for overcoming the power imbalance between researcher and respondent include having the researcher reveal some aspects of her own identity and story so that the interview is a more reciprocal experience rather than one-sided, allowing participants to view and edit interview transcripts before the researcher uses them for analysis, and giving participants an opportunity to read and comment  on analysis before the researcher shares it with others through publication or presentation (Reinharz, 1992; Hesse-Biber, Nagy, & Leavy, 2007). Reinharz, S. (1992). Feminist methods in social research. New York, NY: Oxford University Press; Hesse-Biber, S. N., & Leavy, P. L. (Eds.). (2007). Feminist research practice: A primer. Thousand Oaks, CA: Sage. On the other hand, some researchers note that sharing too much with interview participants can give the false impression there is no power differential, when in reality researchers can analyze and present participants’ stories in whatever way they see fit (Stacey, 1988). Stacey, J. (1988). Can there be a feminist ethnography? Women’s Studies International Forum, 11, 21–27.

However you feel about sharing details about your background with an interview participant, another way to balance the power differential between yourself and your interview participants is to make the intent of your research very clear to the subjects. Share with them your rationale for conducting the research and the research question(s) that frame your work. Be sure that you also share with participants how the data you gather will be used and stored. Also, explain to participants how their confidentiality will be protected including who will have access to the data you gather from them and what procedures, such as using pseudonyms, you will take to protect their identities. Social workers also must disclose the reasons why confidentiality may be violated to prevent danger to self or others. Many of these details will be covered by your IRB’s informed consent procedures and requirements. However, even if they are not, as researchers we should be attentive to how informed consent can help balance the power differences between ourselves and those who participate in our research.

There are no easy answers when it comes to handling the power differential between the researcher and researched. Even social scientists do not agree on the best approach. Because qualitative research involves interpersonal interactions and building a relationship with research participants, power is a particularly important issue.

Location, location, location

One way to address the power between researcher and respondent is to conduct the interview in a location of the participant’s choosing, where they will feel most comfortable answering your questions. Interviews can take place in any number of locations—in respondents’ homes or offices, researchers’ homes or offices, coffee shops, restaurants, public parks, or hotel lobbies, to name just a few possibilities. Each location comes with its own set of benefits and its own challenges. While I would argue that allowing the respondent to choose the location that is most convenient and most comfortable for them is of utmost importance, identifying a location where there will be few distractions is also important. For example, some coffee shops and restaurants are so loud that recording the interview can be a challenge. Other locations may present different sorts of distractions. For example, if you conduct interviews with parents in their home, they may out of necessity spend more time attending to their children during an interview than responding to your questions (of course, depending on the topic of your research, the opportunity to observe such interactions could be invaluable). As an interviewer, you may want to suggest a few possible locations, and note the goal of avoiding distractions, when you ask your respondents to choose a location.

Of course, the extent to which a respondent should be given complete control over choosing a location must also be balanced by accessibility of the location to you, the interviewer, and by your safety and comfort level with the location. You may not feel comfortable conducting an interview in an area with posters for hate groups on the wall. Not only might you fear for your safety, you may be too distracted to conduct a good interview. While it is important to conduct interviews in a location that is comfortable for respondents, doing so should never come at the expense of your safety.

Researcher-respondent relationship

A unique feature of interviews is that they require some social interaction, which means that a relationship is formed between interviewer and interviewee. One essential element in building a productive relationship is respect. You should respect the person’s time and their story. Demonstrating respect will help interviewees feel comfortable sharing with you.

There are no big secrets or tricks for how to show respect for research participants. At its core, the interview interaction should not differ from any other social interaction in which you show gratitude for a person’s time and respect for a person’s humanity. It is crucial that you, as the interviewer, conduct the interview in a way that is culturally sensitive. In some cases, this might mean educating yourself about your study population and even receiving some training to help you learn to effectively communicate with your research participants. Do not judge your research participants; you are there to listen to them, and they have been kind enough to give you their time and attention. Even if you disagree strongly with what a participant shares in an interview, your job as the researcher is to gather the information being shared with you, not to make personal judgments about it.

Respect provides a solid foundation for rapport. Rapport is the sense of connection you establish with a participant. Some argue that this term is too clinical, and perhaps it implies that a researcher tricks a participant into thinking they are closer than they really are (Esterberg, 2002). Esterberg, K. G. (2002). Qualitative methods in social research. Boston, MA: McGraw-Hill. The responsibilities that a social work clinician has to a person differ significantly from those of a researcher, as clinicians provide services whereas researchers do not. The participant is not your client, and your goals for the interaction are different than those of a clinical relationship.


five people putting their fists together over a table

Developing good rapport requires good listening. In fact, listening during an interview is an active, not a passive, practice. Active listening means that you, the researcher, participate with the respondent by showing you understand and follow whatever it is that they are telling you (Devault, 1990). For more on the practice of listening, especially in qualitative interviews, see Devault, M. (1990). Talking and listening from women’s standpoint: Feminist strategies for interviewing and analysis. Social Problems, 37, 96–116. The questions you ask respondents should indicate you’ve actually heard what they’ve just said.

Active listening means you will probe the respondent for more information from time to time throughout the interview. A probe is a request for more information. Probes are used because qualitative interviewing techniques are designed to go with the flow and take whatever direction the respondent goes during the interview. It is worth your time to come up with helpful probes in advance of an interview. You certainly do not want to find yourself stumped or speechless after a respondent has just said something about which you’d like to hear more. This is another reason why practicing your interview in advance with people who are similar to those in your sample is a good idea.


Key Takeaways

  • All interviewers should take into consideration the power differential between themselves and their respondents.
  • Attend to the location of an interview and the relationship that forms between the interviewer and interviewee.
  • Feminist researchers paved the way for helping interviewers think about how to balance the power differential between themselves and interview participants.
  • Interviewers must always be respectful of interview participants.


Glossary

  • Probe- a request for more information in qualitative research


Image attributions

punch fist by PublicDomainPictures CC-0

action collaborate by rawpixel CC-0


63

13.4 Focus groups

Learning Objectives

  • Define focus groups and outline how they differ from one-on-one interviews
  • Describe how to determine the best size for focus groups
  • Identify the important considerations in focus group composition
  • Discuss how to moderate focus groups
  • Identify the strengths and weaknesses of focus group methodology


Focus groups resemble qualitative interviews in that a researcher may prepare a guide in advance and interact with participants by asking them questions. But anyone who has conducted both one-on-one interviews and focus groups knows that each is unique. In an interview, usually one member (the research participant) is most active while the other (the researcher) plays the role of listener, conversation guider, and question-asker. Focus groups, on the other hand, are planned discussions designed to elicit group interaction and “obtain perceptions on a defined area of interest in a permissive, nonthreatening environment” (Krueger & Casey, 2000, p. 5). Krueger, R. A., & Casey, M. A. (2000). Focus groups: A practical guide for applied research (3rd ed.). Thousand Oaks, CA: Sage. In this case, the researcher may play a less active role than in a one-on-one interview. The researcher’s aim is to get participants talking to each other and to observe interactions among participants.


a row of people in silhouette with five people illuminated by a magnifying glass

There are numerous examples of focus group research. In their 2008 study, for example, Amy Slater and Marika Tiggemann (2010) Slater, A., & Tiggemann, M. (2010). “Uncool to do sport”: A focus group study of adolescent girls’ reasons for withdrawing from physical activity. Psychology of Sport and Exercise, 11, 619–626. conducted six focus groups with 49 adolescent girls between the ages of 13 and 15 to learn more about girls’ attitudes towards’ participation in sports. In order to get focus group participants to speak with one another rather than with the group facilitator, the study’s interview guide contained just two questions: “Can you tell me some of the reasons that girls stop playing sports or other physical activities?” and “Why do you think girls don’t play as much sport/physical activity as boys?” In another focus group study, Virpi Ylanne and Angie Williams (2009) Ylanne, V., & Williams, A. (2009). Positioning age: Focus group discussions about older people in TV advertising. International Journal of the Sociology of Language, 200, 171–187. held nine focus group sessions with adults of different ages to gauge their perceptions of how older characters are represented in television commercials. Among other considerations, the researchers were interested in discovering how focus group participants position themselves and others in terms of age stereotypes and identities during the group discussion. In both examples, the researchers’ core interest in group interaction could not have been assessed had interviews been conducted on a one-on-one basis; thus, the focus group method was the ideal choice in each instance.

The preceding examples come from the work of academics who have used focus groups as their method of data collection. But focus groups have proven quite useful for those outside of academia as well. In fact, this method is especially popular among researchers. Market researchers use focus groups to gather information about the products or services they aim to sell. Government officials and political campaign workers use them to learn how members of the public feel about a particular issue or candidate. One of the earliest documented uses of focus groups comes from World War II when researchers used them to assess the effectiveness of troop training materials and of various propaganda efforts (Merton & Kendall, 1946; Morgan, 1997). Morgan, D. L. (1997). Focus groups as qualitative research (2nd ed.). Thousand Oaks, CA: Sage. Market researchers quickly adopted this method of collecting data to learn about human beliefs and behaviors. Within social science, the use of focus groups did not really take off until the 1980s, when demographers and communication researchers began to appreciate their use in understanding knowledge, attitudes, and communication (Morgan, 1997).

Who should be in your focus group?

In some ways, focus groups require more planning than other qualitative methods of data collection, such as one-on-one interviews in which a researcher may be better able to the dialogue. Researchers must take care to form focus groups with members who will want to interact with one another and to control the timing of the event so that participants are not asked nor expected to stay for a longer time than they’ve agreed to participate. The researcher should also be prepared to inform focus group participants of their responsibility to maintain the confidentiality of what is said in the group. But while the researcher can and should encourage all focus group members to maintain confidentiality, she should also clarify to participants that the unique nature of the group setting prevents her from being able to promise that confidentiality will be maintained by other participants. Once focus group members leave the research setting, researchers cannot control what they say to other people.


six people sitting on couches and talking as a group

Group size should be determined in part by the topic of the interview and your sense of the likelihood that participants will have much to say without much prompting. If the topic is one about which you think participants feel passionately and will have much to say, I think a group of 3–5 makes sense. Groups larger than that, especially for heated topics, can easily become unmanageable. Some researchers say that a group of about 6–10 participants is the ideal size for focus group research (Morgan, 1997); others recommend that groups should include 3–12 participants (Adler & Clark, 2008). Adler, E. S., & Clark, R. (2008). How it’s done: An invitation to social research (3rd ed.). Belmont, CA: Thomson Wadsworth. The size of the focus group is ultimately your decision as the researcher. When forming groups and deciding how large or small to make them, take into consideration what you know about the topic and participants’ potential interest in, passion for, and feelings about the topic. Also consider your comfort level and experience in conducting focus groups. These factors will help you decide which size is right in your particular case.

It may seem counterintuitive, but in general, it is better to form focus groups consisting of participants who do not know one another than to create groups consisting of friends, relatives, or acquaintances (Agar & MacDonald, 1995). Agar, M., & MacDonald, J. (1995). Focus groups and ethnography. Human Organization, 54,78–86. The reason for this is that group members who know each other may share some taken-for-granted knowledge or assumptions. In research, it is precisely the knowledge taken-for-granted that is often of interest; thus, the focus group researcher should avoid setting up interactions where participants may be discouraged to question or raise issues that they take for granted. However, groups should not be so heterogeneous that participants will be unlikely to feel comfortable talking with one another.

Focus group researchers must carefully consider the composition of the groups they put together. In his text on conducting focus groups, Morgan suggests that “homogeneity in background and not homogeneity in attitudes” (p. 36) should be the goal, since participants must feel comfortable speaking up but must also have enough differences to facilitate a productive discussion (1997). Morgan, D. L. (1997). Focus groups as qualitative research (2nd ed.). Thousand Oaks, CA: Sage. Whatever composition a researcher designs for her focus groups, the important point to keep in mind is that focus group dynamics are shaped by multiple social contexts (Hollander, 2004). Hollander, J. A. (2004). The social context of focus groups. Journal of Contemporary Ethnography, 33, 602–637. Participants’ silences as well as their speech may be shaped by gender, race, class, sexuality, age, or other background characteristics or social dynamics—all of which might be suppressed or exacerbated depending on the composition of the group. Hollander suggests that researchers must pay careful attention to group composition, must be attentive to group dynamics during the focus group discussion, and should use multiple methods of data collection in order to “untangle participants’ responses and their relationship to the social contexts of the focus group” (p. 632).

The role of the moderator

In addition to the importance of group composition, focus groups also require skillful moderation. A moderator is the researcher tasked with facilitating the conversation in the focus group. Participants may ask each other follow-up questions, agree or disagree with one another, display body language that tells us something about their feelings about the conversation, or even come up with questions not previously conceived of by the researcher. It is just these sorts of interactions and displays that are of interest to the researcher. A researcher conducting focus groups collects data on more than people’s direct responses to her question, as in interviews.

The moderator’s job is not to ask questions to each person individually, but to stimulate conversation between participants. It is important to set ground rules for focus groups at the outset of the discussion. Remind participants you’ve invited them to participate because you want to hear from all of them. Therefore, the group should aim to let just one person speak at a time and avoid letting just a couple of participants dominate the conversation. One way to do this is to begin the discussion by asking participants to briefly introduce themselves or to provide a brief response to an opening question. This will help set the tone of having all group members participate. Also, ask participants to avoid having side conversations; thoughts or reactions to what is said in the group are important and should be shared with everyone.

As the focus group gets rolling, the moderator will play a less active role as participants talk to one another. There may be times when the conversation stagnates or when you, as moderator, wish to guide the conversation in another direction. In these instances, it is important to demonstrate that you’ve been paying attention to what participants have said. Being prepared to interject statements or questions such as “I’d really like to hear more about what Sunil and Joe think about what Dominick and Jae have been saying” or “Several of you have mentioned X. What do others think about this?” will be important for keeping the conversation going. It can also help redirect the conversation, shift the focus to participants who have been less active in the group, and serve as a cue to those who may be dominating the conversation that it is time to allow others to speak. Researchers may choose to use multiple moderators to make managing these various tasks easier.

Moderators are often too busy working with participants to take diligent notes during a focus group. Researchers may recruit a note-taker who can record participants’ responses (Liamputtong, 2011). Liamputtong, P. (2011). Focus group methodology: Principles and practice. Washington, DC: Sage. The note-taker creates, in essence, the first draft of interpretation for the data in the study. They note themes in responses, nonverbal cues, and other information to be included in the analysis later on. Focus groups are analyzed in a similar way as interviews; however, the interactive dimension between participants adds another element to the analytical process. Researchers must attend to the group dynamics of each focus group, as “verbal and nonverbal expressions, the tactical use of humour, interruptions in interaction, and disagreement between participants” are all data that vital to include in analysis (Liamputtong, 2011, p. 175). Note-takers record these elements in field notes, which allows moderators to focus on the conversation.

Strengths and weaknesses of focus groups

Focus groups share many of the strengths and weaknesses of one-on-one qualitative interviews. Both methods can yield very detailed, in-depth information; are excellent for studying social processes; and provide researchers with an opportunity not only to hear what participants say but also to observe what they do in terms of their body language. Focus groups offer the added benefit of giving researchers a chance to collect data on human interaction by observing how group participants respond and react to one another. Like one-on-one qualitative interviews, focus groups can also be quite expensive and time-consuming. However, there may be some time savings with focus groups as it takes fewer group events than one-on-one interviews to gather data from the same number of people. Another potential drawback of focus groups, which is not a concern for one-on-one interviews, is that one or two participants might dominate the group, silencing other participants. Careful planning and skillful moderation on the part of the researcher are crucial for avoiding, or at least dealing with, such possibilities. The various strengths and weaknesses of focus group research are summarized in Table 13.1.

Table 13.1 Strengths and weaknesses of focus group research
Strengths Weaknesses
Yield detailed, in-depth data Expensive
Less time-consuming than one-on-one interviews May be more time-consuming than survey research
Useful for studying social processes Minority of participants may dominate entire group
Allow researchers to observe body language in addition to self-reports Some participants may not feel comfortable talking in groups
Allow researchers to observe interaction between multiple participants Cannot ensure confidentiality


Key Takeaways

  • In terms of focus group composition, homogeneity of background among participants is recommended while diverse attitudes within the group are ideal.
  • The goal of a focus group is to get participants to talk with one another, a conversation the researcher moderates.
  • Like one-on-one qualitative interviews, focus groups can yield very detailed information, are excellent for studying social processes, and provide researchers with an opportunity to observe participants’ body language; they also allow researchers to observe social interaction.
  • Focus groups can be expensive and time-consuming, as are one-on-one interviews; there is also the possibility that a few participants will dominate the group and silence others in the group.


Glossary

  • Focus groups- planned discussions designed to elicit group interaction and “obtain perceptions on a defined area of interest in a permissive, nonthreatening environment” (Krueger & Casey, 2000, p. 5)
  • Moderator- the researcher tasked with facilitating the conversation in the focus group


Image attributions

target group by geralt CC-0

workplace team by Free-Photos CC-0


64

13.0 Chapter introduction

What is it like to be a young man entering adulthood? According to sociologist Michael Kimmel, they are “totally confused”; “cannot commit to their relationships, work, or lives”; and are “obsessed with never wanting to grow up.” These quotes come from a summary of reviews on the website dedicated to Kimmel’s book, Guyland: http://www.guyland.net. If that sounds like a bunch of malarkey to you, hold on a minute. Kimmel interviewed 400 young men, ages 16 to 26, over the course of four years across the United States to learn how young men made the transition from adolescence into adulthood. Since the results of Kimmel’s research were published in 2008, Kimmel, M. (2008). Guyland: The perilous world where boys become men. New York, NY: Harper Collins. his book Guyland made quite a splash. Whatever your take on Kimmel’s research, one thing remains true—we surely would not know nearly as much as we now do about the lives of many young American men were it not for interview research.

Chapter Outline

Content Advisory

This chapter discusses or mentions the following topics: childfree adults, sexual harassment, juvenile delinquency, drunk driving, racist hate groups, ageism, sexism, and police interviews.

65

13.5 Analyzing qualitative data

Learning Objectives

  • Describe how to transcribe qualitative data
  • Identify and describe the two types of coding in qualitative research


Analysis of qualitative data typically begins with a set of transcripts of the interviews or focus groups conducted. Obtaining these transcripts requires having either taken exceptionally good notes or, preferably, having recorded the interview or focus group and then transcribed it. Transcribing audio recordings is usually the first step toward analyzing qualitative data. Researchers create a complete, written copy, or transcript, of the recording by playing it back and typing in each word that is spoken, noting who spoke which words. In general, it is best to aim for a verbatim transcript, one that reports word for word exactly what was said in the recording. If possible, it is also best to include nonverbals in a transcript. Gestures made by participants should be noted, as should the tone of voice and notes about when, where, and how spoken words may have been emphasized by participants. Because these are difficult to capture via audio, it is important to have a note-taker in focus groups and to write useful field notes during interviews.


a tape cassette

If you have the time (or if you lack the resources to hire others), I think it is best to transcribe your qualitative data yourself. I never cease to be amazed by the things I recall from an interview or focus group when I transcribe it myself. If the researcher who conducted the interview or focus group transcribes it herself, that person will also be able to make a note of nonverbal behaviors and interactions that may be relevant to analysis but that could not be picked up by audio recording. Participants might roll their eyes, wipe tears from their face, and even make obscene gestures. These nonverbals speak volumes about participants’ feelings. Unless you write them down in your field notes or include them in your transcript, those details cannot inform your analysis.

The goal of qualitative data analysis is to reach some inferences, lessons, or conclusions by condensing large amounts of data into relatively smaller, more manageable bits of understandable information. Analysis of qualitative data often works inductively (Glaser & Strauss, 1967; Charmaz, 2006). If you would like to learn more about inductive qualitative data analysis, I recommend two titles: Glaser, B. G., & Strauss, A. L. (1967). The discovery of grounded theory: Strategies for qualitative research. Chicago, IL: Aldine; Charmaz, K. (2006). Constructing grounded theory: A practical guide through qualitative analysis. Thousand Oaks, CA: Sage. To move from the specific observations a researcher collects to identifying patterns across those observations, qualitative researchers will often begin by reading through transcripts and trying to identify codes. A code is a shorthand representation of some more complex set of issues or ideas. In this usage, the word code is a noun. But it can also be a verb. The process of identifying codes in one’s qualitative data is often referred to as coding. Coding involves identifying themes across qualitative data by reading and rereading (and rereading again) transcripts until the researcher has a clear idea about what themes emerge.

Qualitative researcher and textbook author Kristin Esterberg (2002) Esterberg, K. G. (2002). Qualitative methods in social research. Boston, MA: McGraw-Hill. describes coding as a multistage process. Esterberg suggests that there are two types of coding: open coding and focused coding. To analyze qualitative data, one can begin by open coding transcripts. This means that you read through each transcript, line by line, and make a note of whatever categories or themes jump out to you. At this stage, it is important that you not let your original research question or tentative hypotheses cloud your ability to see categories or themes. It’s called open coding for a reason—keep an open mind. You may have even noted some ideas for coding in your field notes or journal entries.

Open coding will probably require multiple rounds. That is, you will read through all of your transcripts multiple times. As you do, it is likely that you’ll begin to see some commonalities across the categories or themes that you’ve jotted down. Once you have completed a few passes and started noticing commonalities, you might begin focused coding. Focused coding is a multistage process. First, collapse or narrow down themes and categories identified in open coding by reading through the notes you made while conducting open coding. Identify themes or categories that seem to be related, perhaps merging some. Once you come up with a final list of codes, make sure each one has a definition that clearly spells out what the code means. Finally, you recode the dataset using the final list of codes, making sure to apply the definition of the code consistently throughout each transcript.


a person drawing a concept map on a clear surface with black ink

Defining codes is a way of making meaning of your data and of developing a way to talk about your findings. Researchers must ensure that codes are applied in a uniform way in the entire data set during focused coding. In open coding, new codes and shifts in definitions for codes are common. The researcher should keep an open mind and allow the definitions of codes to emerge from reading (and re-reading) the data. However, once focused coding begins, the definitions should not change for any reason. Any deviation will make the data analysis less trustworthy. If there are pieces of data that do not fit with your definition, then it is important to note those deviant cases in your final report.

Using multiple researchers to code the same dataset can be quite helpful. You may miss something a participant said that another coder catches. Similarly, you may shift your understanding of what a code means and not realize it until another coder asks you about it. If multiple researchers are coding the dataset simultaneously, researchers must come to a consensus about the meaning of each code and ensure that codes are applied consistently by each researcher. We discussed this previously in Chapter 9 as inter-rater reliability. Even if only one person will code the dataset, it is important to work with other researchers. If other researchers have the time, you may be able to have them check your work for trustworthiness and authenticity. We discussed these standards for methodological rigor in Chapter 9. Remember, in qualitative data analysis, the researcher is the measurement instrument, determining what is true, what is connected to what, and what it all means.

As tedious and laborious as it might seem to read through hundreds of pages of transcripts multiple times, sometimes getting started with the coding process is actually the hardest part. If you find yourself struggling to identify themes at the open coding stage, ask yourself some questions about your data. The answers should give you a clue about what sorts of themes or categories you are reading. In their text on analyzing qualitative data, Lofland and Lofland (1995) Lofland, J., & Lofland, L. H. (1995). Analyzing social settings: A guide to qualitative observation and analysis (3rd ed.) Belmont, CA: Wadsworth. identify a set of questions I find very useful when coding qualitative data. They suggest asking the following:

Asking yourself these questions about the passages of data that you’re reading can help you begin to identify and name potential themes and categories.

Still feeling uncertain about how this process works? Sometimes it helps to see how qualitative data translate into codes. In Table 13.2, I present two codes that emerged from an inductive analysis of transcripts from interviews with child-free adults. I also include a brief description of each code and a few (of many) interview excerpts from which each code was developed.

Table 13.2 Interview coding example
Code Code definition Interview excerpts
Reify gender Participants reinforce heteronormative ideals in two ways: (a) by calling up stereotypical images of gender and family and (b) by citing their own “failure” to achieve those ideals. “The woman is more involved with taking care of the child. [As a woman] I’d be the one waking up more often to feed the baby and more involved in the personal care of the child, much more involved. I would have more responsibilities than my partner. I know I would feel that burden more than if I were a man.”
“I don’t have that maternal instinct.”
“I look at all my high school friends on Facebook, and I’m the only one who isn’t married and doesn’t have kids. I question myself, like if there’s something wrong with me that I don’t have that.”
“I feel badly that I’m not providing my parents with grandchildren.”
Resist Gender Participants resist gender norms in two ways: (a) by pushing back against negative social responses and (b) by redefining family for themselves in a way that challenges normative notions of family. “Am I less of a woman because I don’t have kids? I don’t think so!”
“I think if they’re gonna put their thoughts on me, I’m putting it back on them. When they tell me, ‘Oh, Janet, you won’t have lived until you’ve had children. It’s the most fulfilling thing a woman can do!’ then I just name off the 10 fulfilling things I did in the past week that they didn’t get to do because they have kids.”
“Family is the group of people that you want to be with. That’s it.”

As you might imagine, wading through all these data is quite a process. Just as quantitative researchers rely on the assistance of special computer programs designed to help with sorting through and analyzing their data, so too do qualitative researchers. Where quantitative researchers have SPSS and MicroCase (and many others), qualitative researchers have programs such as NVivo (http://www.qsrinternational.com) and Atlas.ti (http://www.atlasti.com). These are programs specifically designed to assist qualitative researchers with organizing, managing, sorting, and analyzing large amounts of qualitative data. The programs work by allowing researchers to import transcripts contained in an electronic file and then label or code passages, cut and paste passages, search for various words or phrases, and organize complex interrelationships among passages and codes. They even include advanced features that allow researchers to code multimedia files, visualize relationships between a network of codes, and count the number of times a code was applied. Having completed a handwritten coding process as part of a class project with a rather old-school professor, I’m happy I can use qualitative data analysis software to save myself time and hassle.

To summarize, the following excerpt, from my paper analyzing the implementation of self-directed supports for individuals with intellectual and developmental disabilities summarizes how the process of analyzing qualitative data can work:

Transcribed interviews were analyzed using Atlas.ti 7.5 (2014) qualitative data analysis software, a commonly used program in qualitative social science. The researchers approached data analysis from an inductive perspective, allowing themes to emerge from the data. As described by Braun and Clarke (2006), the thematic analysis proceeded along six sequential phases: (a) familiarizing with the data set, (b) generating initial codes, (c) searching for themes, (d) reviewing themes, (e) defining and naming themes, (f) and reporting data. One member of the research team conducted the coding and thematic analysis, consulting with a peer reviewer at the end of each of the three passes of coding and the entire research team after the coding process was complete. The peer reviewer reviewed each phase of coding for consistency, and worked with the primary coder to identify, review, and name themes. At the end of coding, the entire research team reviewed the themes and established a shared meaning that best reflected the narratives of participants, based on a series of dialogues. The themes were organized into a thematic map which was refined through consultation with the research team to ensure homogeneity within each theme and heterogeneity between themes. The analysis contained within this paper used co-occurrence counts as a guideline for the prevalence of themes within the data set. Thus, the analysis is limited to the most prevalent themes that answer each research question, while attending to exceptional or divergent cases. Methodological journaling related to coding and peer review helped to ensure the dependability, confirmability, and trustworthiness of the final research product (DeCarlo, Bogenschutz, Hall-Lande, & Hewitt, in press). DeCarlo, M., Bogenschutz, M., Hall-Lane, J., & Hewitt, A. (in press). Implementation of self-directed supports for individuals with intellectual and developmental disabilities in the United States. Journal of disability policy studies.


Key Takeaways

  • Open coding involves allowing codes to emerge from the dataset.
  • Codes must be clearly defined before focused coding can begin, so the researcher applies them in the same way to each unit of data.
  • NVivo and Atlas.ti are computer programs that qualitative researchers use to help with organizing, sorting, and analyzing their data.


Glossary

  • Code- a shorthand representation of some more complex set of issues or ideas
  • Coding- identifying themes across qualitative data by reading transcripts
  • Focused coding- collapsing or narrowing down codes, defining codes, and recoding each transcript using a final code list
  • Open coding- reading through each transcript, line by line, and make a note of whatever categories or themes seem to jump out to you
  • Transcript- a complete, written copy of the recorded interview or focus group containing each word that is spoken on the recording, noting who spoke which words


Image attributions

Compact Cassette by Petr Kvashin CC-0

concept of learning by unknown CC-0


XIV

14. Unobtrusive research

66

14.0 Chapter introduction

Are female and male athletes at the professional and college levels treated equally? You might think 40 years since the passing of Title IX (the civil rights law that prohibits sex discrimination in education including athletics) and with the growing visibility of women athletes in sports, such as golf, basketball, hockey, and tennis, that the answer would be an easy yes. But Professor Michael Messner’s (2002) Messner, M. A. (2002). Taking the field: Women, men, and sports. Minneapolis: University of Minnesota Press. unobtrusive research shows otherwise, as does Professors Jo Ann M. Buysse and Melissa Sheridan Embser-Herbert’s (2004) Buysse, J. A. M., & Embser-Herbert, M. S. (2004). Constructions of gender in sport: An analysis of intercollegiate media guide cover photographs. Gender & Society, 18, 66–81. content analysis of college athletics media guide photographs.

In fact, Buysse and Embser-Herbert’s unobtrusive research shows that traditional definitions of femininity are fiercely maintained through colleges’ visual representations of women athletes as passive and overtly feminine (as opposed to strong and athletic). In addition, Messner and colleagues’ (Messner, Duncan, & Jensen, 1993) Messner, M. A., Duncan, M. C., & Jensen, K. (1993). Separating the men from the girls: The gendered language of televised sports. Gender & Society, 7, 121–137. content analysis of verbal commentary in televised coverage of men’s and women’s sports shows that announcers’ comments vary depending on an athlete’s gender identity. Such commentary not only infantilizes women athletes but also asserts an ambivalent stance toward their accomplishments. Without unobtrusive research we might be inclined to think that more has changed for women athletes over the past 40 years than actually has changed.

Chapter Outline

Content Advisory

This chapter discusses or mentions the following topics: sexism, racism, depression, and suicide.

67

14.1 Unobtrusive research: What is it and when should it be used?

Learning Objectives

  • Define unobtrusive research and describe why it is used


In this chapter, we will explore unobtrusive methods of collecting data. Unobtrusive research refers to methods of collecting data that don’t interfere with the subjects under study (because these methods are not obtrusive). Both qualitative and quantitative researchers use unobtrusive research methods. Unobtrusive methods share the unique quality that they do not require the researcher to interact with the people she is studying. It may seem strange that social work, a discipline dedicated to helping people, would employ a methodology that requires no interaction with human beings. But humans create plenty of evidence of their behaviors—they write letters to the editor of their local paper, they create various sources of entertainment for themselves such as movies and televisions shows, they consume goods, they walk on sidewalks, and they lie on the grass in public parks. All these activities leave something behind—worn paths, trash, recorded shows, and printed papers. These are all potential sources of data for the unobtrusive researcher.


a person pointing to a graph among other papers and work items on a desk

Social workers interested in history are likely to use unobtrusive methods, which are also well suited to comparative research. Historical comparative research is “research that focuses either on one or more cases over time (the historical part) or on more than one nation or society at one point in time (the comparative part)” (Esterberg, 2002, p. 129). Esterberg, K. G. (2002). Qualitative methods in social research. Boston, MA: McGraw-Hill. While not all unobtrusive researchers necessarily conduct historical, comparative, or even some combination of historical and comparative work, unobtrusive methods are well suited to such work. As an example, Melissa Weiner (2010) Weiner, M. (2010). Power, protest, and the public schools: Jewish and African American struggles in New York City. Piscataway, NJ: Rutgers University Press. used a historical comparative approach to study racial barriers historically experienced by Jewish people and African Americans in New York City public schools. Weiner analyzed public records from several years of newspapers, trial transcripts, and several organizations as well as private manuscript collections to understand how parents, children, and other activists responded to inequality and worked to reform schools. Not only did this work inform readers about the little-known similarities between Jewish and African American experiences, but it also informs current debates over inequalities experienced in public schools today.

In this chapter, we’ll examine content analysis as well as analysis of data collected by others. Both types of analysis have in common their use of data that do not require direct interaction with human subjects, but the particular type and source of data for each type of analysis differs. We’ll explore these similarities and differences in the following sections, after we look at some of the pros and cons of unobtrusive research methods.


Key Takeaways

  • Unobtrusive methods allow researchers to collect data without interfering with the subjects under study.
  • Historical comparative methods, which are unobtrusive, focus on changes in multiple cases over time or on more than one nation or society at a single point in time.


Glossary

  • Unobtrusive research- methods of collecting data that don’t interfere with the subjects under study


Image attributions

office business by rawpixel CC-0


68

14.2 Strengths and weaknesses of unobtrusive research

Learning Objectives

  • Identify the major strengths of unobtrusive research
  • Identify the major weaknesses of unobtrusive research
  • Define the Hawthorne effect


As is true of the other research designs examined in this text, unobtrusive research has a number of strengths and weaknesses.

Strengths of unobtrusive research

Researchers who seek evidence of what people actually do, as opposed to what they say they do (as in survey and interview research), might wish to consider using unobtrusive methods. Researchers often, as a result of their presence, have an impact on the participants in their study simply because they measure and observe them.  For example, compare how you would behave at work if you knew someone was watching you versus a time when you knew you were alone.  Because researchers conducting unobtrusive research do not alert participants to their presence, they do not need to be concerned about the effect of the research on their subjects. This effect, known as the Hawthorne effect, is not a concern for unobtrusive researchers because they do not interact directly with their research participants. In fact, this is one of the major strengths of unobtrusive research.


man sitting on bench looking at a street

Another benefit of unobtrusive research is that it can be relatively low-cost compared to some of the other methods we’ve discussed. Because “participants” are generally inanimate objects (e.g., web journal entries, television shows, historical speeches) as opposed to human beings, researchers may be able to access data without having to worry about paying participants for their time (though certainly travel to or access to some documents and archives can be costly).

Unobtrusive research is also pretty forgiving. It is far easier to correct mistakes made in data collection when conducting unobtrusive research than when using any of the other methods described in this textbook. Imagine what you would do, for example, if you realized at the end of conducting 50 in-depth interviews that you’d accidentally omitted two critical questions from your interview guide. What are your options? Re-interview all 50 participants? Try to figure out what they might have said based on their other responses? Reframe your research question? Scratch the project entirely? Obviously, none of these options is ideal. The same problems arise if a mistake is made in survey research. Fortunately for unobtrusive researchers, going back to the source of the data to gather more information or correct some problem in the original data collection is a relatively straightforward prospect.

Finally, as described in the previous section, unobtrusive research is well suited to studies that focus on processes that occur over time. While longitudinal surveys and long-term field observations are also suitable ways of gathering such information, they cannot examine processes that occurred decades before data collection began, nor are they the most cost-effective ways to examine long-ranging processes. Unobtrusive methods, on the other hand, enable researchers to investigate events and processes that have long since passed. They also do not rely on retrospective accounts, which may be subject to errors in memory, as some longitudinal surveys do.

In sum, the strengths of unobtrusive research include the following:

Weaknesses of unobtrusive research

While there are many benefits to unobtrusive research, this method also comes with a unique set of drawbacks. Because unobtrusive researchers analyze data that may have been created or gathered for purposes entirely different from the researcher’s aim, problems of validity sometimes arise in such projects. It may also be the case that data sources measuring whatever a researcher wishes to examine simply do not exist. This means that unobtrusive researchers may be forced to tweak their original research interests or questions to better suit the data that are available to them. Finally, it can be difficult in unobtrusive research projects to account for context. In an interview, for example, the researcher can ask what events lead up to some occurrence, but this level of personal interaction is impossible in unobtrusive research. So, while it can be difficult to ascertain why something occurred in unobtrusive research, we can gain a good understanding of what has occurred.

In sum, the weaknesses of unobtrusive research include the following:


Key Takeaways

  • Unobtrusive research is cost effective and allows for easier correction of mistakes than other methods of data collection do.
  • The Hawthorne effect, which occurs when research subjects alter their behaviors because they know they are being studied, is not a risk in unobtrusive research as it is in other methods of data collection.
  • Weaknesses of unobtrusive research include potential problems with validity, limitations in data availability, and difficulty in accounting for social context.


Glossary

  • Hawthorne effect- participants in a study will behave differently because they know they are being observed


Image attributions

man paris traffic by whitfieldink CC-0


69

14.3 Unobtrusive data collected by you

Learning Objectives

  • Define content analysis
  • Describe the kinds of texts that content analysts analyze
  • Outline the differences between manifest content and latent content
  • Discuss the differences between qualitative and quantitative content analysis
  • Describe code sheets and their purpose


This section focuses on how to gather data unobtrusively and what to do with those data once they have been collected. There are two main ways of gathering data unobtrusively: conducting a content analysis of existing texts and analyzing physical traces of human behavior. We’ll explore both approaches.

Content analysis

One way of conducting unobtrusive research is to analyze texts. Texts come in all kinds of formats. At its core, content analysis addresses the questions of “Who says what, to whom, why, how, and with what effect?” (Babbie, 2010, pp. 328–329). Babbie, E. (2010). The practice of social research (12th ed.). Belmont, CA: Wadsworth. Content analysis is a type of unobtrusive research that involves the study of texts and their meaning. Here we use a more liberal definition of text than you might find in your dictionary. The text that content analysts investigate includes such things as actual written copy (e.g., newspapers or letters) and content that we might see or hear (e.g., speeches or other performances). Content analysts might also investigate more visual representations of human communication, such as television shows, advertisements, or movies. The following table provides a few specific examples of the kinds of data that content analysts have examined in prior studies. Which of these sources of data might be of interest to you?

Table 14.1 Content analysis examples
Data Research question Author(s) (year)
Spam e-mails What is the form, content, and quantity of unsolicited e- mails? Berzins (2009) Berzins, M. (2009). Spams, scams, and shams: Content analysis of unsolicited email. International Journal of Technology, Knowledge, and Society, 5, 143–154.
James Bond films How are female characters portrayed in James Bond films, and what broader lessons can be drawn from these portrayals? Neuendorf, Gore, Dalessandro, Janstova, and Snyder-Suhy (2010) Neuendorf, K. A., Gore, T. D., Dalessandro, A., Janstova, P., & Snyder-Suhy, S. (2010). Shaken and stirred: A content analysis of women’s portrayals in James Bond films. Sex Roles, 62, 747–761.
Console video games How is male and female sexuality portrayed in the best-selling console video games? Downs and Smith (2010) Downs, E., & Smith, S. L. (2010). Keeping abreast of hypersexuality: A video game character content analysis. Sex Roles, 62, 721–733.
Newspaper articles How do newspapers cover closed-circuit television surveillance in Canada, and what are the implications of coverage for public opinion and policymaking? Greenberg and Hier (2009) Greenberg, J., & Hier, S. (2009). CCTV surveillance and the poverty of media discourse: A content analysis of Canadian newspaper coverage. Canadian Journal of Communication, 34, 461–486.
Pro-eating disorder websites What are the features of pro-eating disorder websites, and what are the messages to which users may be exposed? Borzekowski, Schenk, Wilson, and Peebles (2010) Borzekowski, D. L. G., Schenk, S., Wilson, J. L., & Peebles, R. (2010). e-Ana and e-Mia: A content analysis of pro-eating disorder Web sites. American Journal of Public Health, 100, 1526–1534.

One thing you might notice about Table 14.1 is that the data sources represent primary sources. That is, they are the original documents written by people who observed the event or analyzed the data. Secondary sources, on the other hand, are those that have already been analyzed. Often, secondary sources are created by looking at primary sources and analyzing their contents. We reviewed the difference between primary and secondary sources in Chapter 2.

Shulamit Reinharz offers a helpful way of distinguishing between these two types of sources in her methods text. She explains that while primary sources represent the “‘raw’ materials of history,” secondary sources are the “‘cooked’ analyses of those materials” (1992, p. 155). Reinharz, S. (1992). Feminist methods in social research. New York, NY: Oxford University Press. The distinction between primary and secondary sources is important for many aspects of social science, but it is especially important to understand when conducting content analysis. While there are certainly instances of content analysis in which secondary sources are analyzed, I think it is safe to say that it is more common for content analysts to analyze primary sources.

In those instances where secondary sources are analyzed, the researcher’s focus is usually on the process by which the original analyst or presenter of data reached his conclusions or on the choices that were made in terms of how and in what ways to present the data. For example, James Loewen (2007) Loewen, J. W. (2007). Lies my teacher told me: Everything your American history textbook got wrong. Grenwich, CT: Touchstone. conducted a content analysis of high school history textbooks. His aim was not to learn about history, but to understand how students are taught American history in high school. The results of his inquiry uncovered that the books often glossed over issues of racism, leaving students with an incomplete understanding of the trans-Atlantic slave trade, the extermination of Indigenous peoples, and the civil rights movement.

Sometimes students new to research methods struggle to grasp the difference between a content analysis of secondary sources and a literature review, discussed in Chapter 4. In a literature review, researchers analyze theoretical, practical, and empirical sources to try to understand what we know and what we don’t know about a particular topic. The sources used to conduct a scholarly review of the literature are typically peer-reviewed sources, written by trained scholars, published in some academic journal or press. These sources are culled in a literature review to arrive at some conclusion about our overall knowledge about a topic. Findings from sources are generally taken at face value.

Conversely, a content analysis of scholarly literature would raise questions not addressed in a literature review. A content analyst who examines scholarly articles would try to learn something about the authors (e.g., who publishes what and where), publication outlets (e.g., how well do different journals represent the diversity of the discipline), or topics (e.g., how has the popularity of topics shifted over time). A content analysis of scholarly articles would be a “study of the studies” as opposed to a “review of studies.” Perhaps, for example, a researcher wishes to know whether more men than women authors are published in the top-ranking journals in the discipline. The researcher could conduct a content analysis of different journals and count authors by gender (though this may be a tricky prospect if relying only on names to indicate gender). Or perhaps a researcher would like to learn whether or how various topics of investigation go in and out of style. She could investigate changes over time in topical coverage in various journals. In these latter two instances, the researcher is not aiming to summarize the content of the articles, as in a literature review, but instead is looking to learn something about how, why, or by whom particular articles came to be published.

Content analysis can be qualitative or quantitative, and often researchers will use both strategies to strengthen their investigations. In qualitative content analysis, the aim is to identify themes in the text being analyzed and to identify the underlying meaning of those themes. For example, Alyssa Goolsby (2007) Goolsby, A. (2007). U.S. immigration policy in the regulatory era: Meaning and morality in state discourses of citizenship (Unpublished master’s thesis). Department of Sociology, University of Minnesota, Minneapolis, MN. conducted qualitative content analysis in her study of national identity in the United States. To understand how the boundaries of citizenship were constructed in the United States, she conducted a qualitative content analysis of key historical congressional debates focused on immigration law.

Quantitative content analysis, on the other hand, involves assigning numerical values to raw data so that it can be analyzed statistically. Jason Houle (2008) conducted a quantitative content analysis of song lyrics. Inspired by an article on the connections between fame, chronic self- consciousness (as measured by frequent use of first-person pronouns), and self-destructive behavior (Schaller, 1997), Schaller, M. (1997). The psychological consequences of fame: Three tests of the self-consciousness hypothesis. Journal of Personality, 65, 291– 309. Houle counted first-person pronouns in Elliott Smith song lyrics. Houle found that Smith’s use of self-referential pronouns increased steadily from the time of his first album release in 1994 until his suicide in 2003 (2008). Houle, J. (2008). Elliott Smith’s self-referential pronouns by album/year. Prepared for teaching SOC 207, Research Methods, at Pennsylvania State University, Department of Sociology. We’ll elaborate on how qualitative and quantitative researchers collect, code, and analyze unobtrusive data in the final portion of this section.

Indirect measures

Texts are not the only sort of data that researchers can collect unobtrusively. Unobtrusive researchers might also be interested in analyzing the evidence that humans leave behind that tells us something about who they are or what they do. This kind evidence includes the physical traces left by humans and the material artifacts that tell us something about their beliefs, values, or norms. Physical traces include such things as worn paths across campus, the materials in a landfill or in someone’s trash can (a data source William Rathje and colleagues [Rathje, 1992; Rathje & Murthy, 1992] Rathje, W. (1992). How much alcohol do we drink? It’s a question…so to speak. Garbage, 4, 18–19; Rathje, W., & Murthy, C. (1992). Garbage demographics. American Demographics, 14, 50–55. have used), indentations in furniture, or empty shelves in the grocery store. Examples of material artifacts include video games and video game equipment, sculptures, mementos left on gravestones, housing structures, flyers for an event, or even kitchen utensils. What kinds of physical traces or material artifacts might be of interest to you?

The original author of this text, Dr. Blackstone, relates the following example of material artifacts:

I recently visited the National Museum of American History in Washington, DC. While there I saw an exhibit displaying chef Julia Child’s home kitchen, where she filmed many of her famous cooking shows. Seeing the kitchen made me wonder how cooking has changed over the past few decades since Child’s shows were on air. I wondered how the layout of our kitchens and the utensils and appliances they contain might influence how we entertain guests, how much time we spend preparing meals, and how much time we spend cleaning up afterward. Our use of particular kitchen gadgets and utensils might even indicate something about our social class identities. Watch the following clip, featuring satirist Joe Queenan, from the PBS documentary People Like Us on social class in the United States: http://www.youtube.com/watch?v=j_Rtl3Y4EuI. The clip aptly demonstrates the sociological relevance of kitchen gadgets. Answers to these questions have bearing on our norms and interactions as humans; thus, they are just the sorts of questions researchers using unobtrusive methods might be interested in answering. I snapped a few photos of the kitchen while at the museum. Though the glass surrounding the exhibit prevents ideal picture taking, I hope the photos in Figure 14.1 give you an idea of what I saw. Might the organizational scheme used in this kitchen, or the appliances that are either present or missing from it, shape the answers to the questions I pose above about human behaviors and interactions? (Blackstone, n.d.)


picture of a kitchen with many pots and pans organized on a pegboard
Figure 14.1 A visit to chef Julia Child’s kitchen at the National Museum of American History

Figure 14.1 copied from Blackstone, A. (2012) Principles of sociological inquiry: Qualitative and quantitative methods. Saylor Foundation. Retrieved from: https://saylordotorg.github.io/text_principles-of-sociological-inquiry-qualitative-and-quantitative-methods/ Shared under a CC-BY-NC-SA 3.0 license (https://creativecommons.org/licenses/by-nc-sa/3.0/)

One challenge with analyzing physical traces and material artifacts is that you generally don’t have access to the people who left the traces or created the artifacts that you are analyzing. (And if you did find a way to contact them, then your research would no longer qualify as unobtrusive!) It can be especially tricky to analyze meanings of these materials if they come from some historical or cultural context other than your own. Situating the traces or artifacts you wish to analyze both in their original contexts and in your own is not always easy and can lead to problems during data analysis. How do you know that you are viewing an object or physical trace in the way that it was intended to be viewed? Do you have the necessary understanding or knowledge about the background of its original creators or users to understand where they were coming from when they created it?

Imagine an alien trying to understand some aspect of Western human culture simply by examining our artifacts. Cartoonist Mark Parisi demonstrates the misunderstanding that could ensue in his drawing featuring three very small aliens standing atop a toilet. One alien says, “Since water is the life-blood on this planet, this must be a temple of some sort…Let’s stick around and see how they show their respect” (1989). Parisi, M. (1989). Alien cartoon 6. Off the Mark. Retrieved from: http://www.offthemark.com/System/2006-05-30. Without a contextual understanding of Western human culture, the aliens have misidentified the purpose of the toilet, and they will be in for quite a surprise when someone shows up to use it!

The point is that while physical traces and material artifacts make excellent sources of data, analyzing their meaning takes more than simply trying to understand them from your own contextual position. You must also be aware of who caused the physical trace or created the artifact, when they created it, why they created, and for whom they created it. Answering these questions will require accessing materials in addition to the traces or artifacts themselves. It may require accessing historical documents or, if analyzing a contemporary trace or artifact, perhaps another method of data collection such as interviews with its creators.

Analysis of unobtrusive data collected by you

Once you have identified the set of texts, physical traces, or artifacts that you would like to analyze, the next step is to figure out how you’ll analyze them. This step requires that you determine your procedures for coding, differentiate between manifest and latent content, and understand how to identify patterns across your coded data. We’ll begin by discussing procedures for coding.

You might recall being introduced to coding procedures in Chapter 13, where we discussed the coding of qualitative interview data. While the coding procedures used for written documents obtained unobtrusively may resemble those used to code interview data, many sources of unobtrusive data differ dramatically from written documents or transcripts. What if your data are sculptures or paths in the snow? The idea of conducting open coding and focused coding on these sources as you would for a written document sounds a little silly, not to mention impossible. So how do we begin to identify patterns across the sculptures or worn paths or utensils we wish to analyze? One option is to take field notes as we observe our data and then code patterns in those notes. Let’s say, for example, that we’d like to analyze how people the use of kitchen utensils, as in Figure 14.1. Taking field notes might be a useful approach were we conducting observations of people actually using utensils in a documentary or on a television program. (Remember, if we’re observing people in-person then our method is no longer unobtrusive.)

If, rather than observing people in documentaries or television shows, our data include a collection of actual utensils, note-taking may not be the most effective way to record our observations. Instead, we could create a code sheet to record details about the utensils in our sample. A code sheet, sometimes referred to as a tally sheet in quantitative coding, is the instrument an unobtrusive researcher uses to record observations.

In the example of kitchen utensils, perhaps we’re interested in how utensils have changed over time. If we had access to sales records for utensils over the past 50 years, we could analyze the top-selling utensil for each year. To do so, we’d want to make some notes about each of the 50 utensils included in our sample. For each top-rated utensil, we might note its name, its purpose, and perhaps its price in current dollar amounts. We might also want to make some assessment about how easy or difficult it is to use or some other qualitative assessment about the purpose of the utensil. To rate the difficulty of use we could use a 5-point scale, with 1 being very easy to use and 5 being very difficult to use. We could even record other notes or observations about the utensils that may not occur to us until we actually see the utensils. Our code sheet might look something like the sample shown in Table 14.2.

Note that the sample sheet contains columns only for 10 years’ worth of utensils. If you were to conduct this project, obviously you’d need to create a code sheet that allows you to record observations for each of the 50 items in your sample.

Table 14.2 Sample code sheet for study of kitchen utensil popularity over time
1961 1962 1963 1964 1965 1966 1967 1968 1969 1970
Utensil name
Utensil purpose
Price (in 2011 $)
Ease of use (1-5 scale)
Other notes

As you can see, our code sheet will contain both qualitative and quantitative data. Our “ease of use” rating is a quantitative assessment; we can therefore conduct some statistical analysis of the patterns here, perhaps noting the mean value on ease of use for each decade we’ve observed. We could do the same thing with the data collected in the row labeled “price,” which is also quantitative. The final row of our sample code sheet, containing notes about our impressions of the utensils we observe, will contain qualitative data. We may conduct open and focused coding on these notes to identify patterns across those notes. In both cases, whether the data being coded are quantitative or qualitative, the aim is to identify patterns across the coded data.

The “purpose” row in our sample code sheet provides an opportunity for assessing both manifest and latent content. Manifest content is the content we observe that is most apparent; it is the surface content. This is in contrast to latent content, which is less obvious. Latent content refers to the underlying meaning of the surface content we observe. In the example of utensil purpose, we might say a utensil’s manifest content is the stated purpose of the utensil. The latent content would be our assessment of what it means that a utensil with a particular purpose is top-rated. Perhaps after coding the manifest content in this category we see some patterns that tell us something about the meanings of utensil purpose. Perhaps we conclude, based on the meanings of top-rated utensils across five decades, that the shift from an emphasis on utensils designed to facilitate entertaining in the 1960s to those designed to maximize efficiency and minimize time spent in the kitchen in the 1980s reflects a shift in how (and how much) people spend time in their homes.

Kathleen Denny’s (2011) Denny, K. (2011). Gender in context, content, and approach: Comparing gender messages in Girl Scout and Boy Scout handbooks. Gender & Society, 25, 27–47. study of scouting manuals offers another excellent example of the differences between manifest and latent content. Denny compared Boy Scout and Girl Scout handbooks to understand gender socializing among scouts. By counting activity types described in the manuals, Denny learned from this manifest content that boys are offered more individual-based and more scientific activities, while girls are offered more group-based and more artistic activities. Denny also analyzed the latent meaning of the messages that scouting handbooks portray about gender; she found that girls were encouraged to become “up-to- date traditional women” while boys were urged to adopt “an assertive heteronormative masculinity” (Denny, 2011, p. 27).


Key Takeaways

  • Content analysts interpret texts.
  • The texts that content analysts analyze include actual written texts such as newspapers or journal entries, as well as visual and auditory sources such as television shows, advertisements, or movies.
  • Content analysts most typically analyze primary sources, though in some instances they may analyze secondary sources.
  • Indirect measures that content analysts examine include physical traces and material artifacts.
  • Manifest content is apparent; latent content is underlying.
  • Content analysts use code sheets to collect data.


Glossary

  • Code sheet- the instrument an unobtrusive researcher uses to record observations
  • Content analysis- a type of unobtrusive research that involves the study of texts and their meaning
  • Latent content- the underlying meaning of the surface content
  • Manifest content- the most apparent and surface-level content in a communication


70

14.4 Secondary data analysis

Learning Objectives

  • Define secondary data analysis
  • List the strengths and limitations of secondary data analysis
  • Name at least two sources of publicly available quantitative data
  • Name at least two sources of publicly available qualitative data


One advantage of unobtrusive research is that you may be able to skip the data collection phase altogether. To many, skipping the data collection phase is preferable since it allows the researcher to proceed directly to answering their question through data analysis. When researchers analyze data originally gathered by another person or entity, they engage in secondary data analysis. Researchers gain access to data collected by other researchers, government agencies, and other unique sources by making connections with individuals engaged in primary research or accessing their data via publicly available sources.

Imagine you wanted to study whether race or gender influenced what major people chose at your college. You could do your best to distribute a survey to a representative sample of students, but perhaps a better idea would be to ask your college registrar for this information. Your college already collects this information on all of its students. Wouldn’t it be better to simply ask for access to this information, rather than collecting it yourself? Maybe.

Challenges in secondary data analysis

Some of you may be thinking, “I never gave my college permission to share my information with other researchers.” Depending on the policies of your university, this may or may not be true. In any case, secondary data is usually anonymized or does not contain identifying information. In our example, students’ names, student ID numbers, home towns, and other identifying details would not be shared with a secondary researcher. Instead, just the information on the variables—race, gender, and major—would be shared. Anonymization techniques are not foolproof, and this is a challenge to secondary data analysis. Based on my limited sample of social work classrooms I have taught, there are usually only two or three men in the room. While privacy may not be a big deal for a study about choice of major, imagine if our example study included final grades, income, or whether your parents attended college. If I were a researcher using secondary data, I could probably figure out which data belonged to which men because there are so few men in the major. This is a problem in real-world research, as well. Anonymized data from credit card companies, Netflix, AOL, and online advertising companies have been “unmasked,” allowing researchers to identify nearly all individuals in a data set (Bode, K. 2017; de Montjoy, Radaelli, Singh, & Pentland, 2015) Bode, K. (2017, January 26). One more time with feeling: ‘Anonymized’ user data not really anonymous. Techdirt. Retrieved from: https://www.techdirt.com/articles/20170123/08125136548/one-more-time-with-feeling-anonymized-user-data-not-really-anonymous.shtml; de Montjoye, Y. A., Radaelli, L., & Singh, V. K. (2015). Unique in the shopping mall: On the reidentifiability of credit card metadata. Science347(6221), 536-539.


person wearing a tin foil mask

Another challenge with secondary data stems from the lack of control over the data collection process. Perhaps your university made a mistake on their forms or entered data incorrectly. If this were your data, you would certainly never make such an error. But if it happened, you could correct it right away. With secondary data, you are less able to correct for any errors made by the original source during data collection. More importantly, you may not know these errors exist and reach erroneous conclusions as a result. Researchers using secondary data should evaluate the procedures used to collect the data wherever possible, and data that lacks documentation on procedures should be treated with caution.

Attending to how the original researchers dealt with missing or incomplete data is also important. Researchers may have simply used the mean score for a piece of missing data or excluded them from analysis entirely. The primary researchers made that choice for a reason, and secondary researchers should understand their decision-making process before proceeding with analysis. Finally, secondary researchers must have access to the codebook for quantitative data and coding scheme for qualitative data. A quantitative dataset often contains shorthand for question numbers, variables, and attributes. A qualitative data analysis contains as a coding scheme explaining definitions and relationships for all codes. Without these, the data would be difficult to comprehend for a secondary researcher.

Secondary researchers, particularly those conducting quantitative research, must also ensure that their conceptualization and operationalization of variables matches that of the primary researchers. If your secondary analysis focuses on a variable that was not a major part of the original analysis, you may not have enough information about that variable to conduct a thorough analysis. For example, if you wanted to study whether depression is associated with income for students and you found a dataset that included those variables. If depression was not a focus of the dataset, researchers may only have included a question like, “Have you ever been diagnosed with major depressive disorder?” While answers to this question will give you some information about depression, it will not give you the depth that a scale like Beck’s Depression Inventory or the Hamilton Rating Scale for Depression would or provide information about severity of symptoms like hospitalization or suicide attempts. Without this level of depth, your analysis may lack validity. Even when operationalization for your variables of interest is thorough, researchers may conceptualize variables differently than you do. Perhaps they are interested in whether a person was diagnosed with depression in their life, whereas, you are concerned with current symptoms of depression. For these reasons, reading research reports and other documentation is a requirement for secondary data analysis.

The lack of control over the data collection process also hamstrings the research process itself. While some studies are created perfectly, most are refined through pilot testing and feedback before the full study is conducted (Engel & Schutt, 2016). Engel, R. J. & Schutt, R. K. (2016). The practice of research in social work (4th ed.). Washington, DC: SAGE Publishing. Secondary data analysis does not allow you to engage in this process. For qualitative researchers in particular, this is an important challenge. Qualitative research, particularly from the interpretivist paradigm, uses emergent processes in which research questions, conceptualization of terms, and measures develop and change over the course of the study. Secondary data analysis inhibits this process from taking place because the data are already collected. Because qualitative methods often involve analyzing the context in which data are collected, secondary researchers may not know enough to authentically and accurately represent the original data in a new analysis.

Returning to our example on race, gender, and major once again, let’s assume you are reasonably certain the data do not contain errors and you are comfortable with having no control over the data collection process. Getting access to the data is not as simple as walking into the registrar’s office with a smile. Researchers seeking access to data collected by universities (or hospitals, health insurers, human service agencies, etc.) must have the support of the administration. In some cases, a researcher may only have to demonstrate that they are competent to complete the analysis, share their data analysis plan, and receive ethical approval from an IRB. Administrators of data that are often accessed by researchers, such as Medicaid or Census data, may fall into this category.

Your school administration may not be used to partnering with researchers to analyze their students. In fact, administrators may be quite sensitive to how their school is perceived as a result of your study. If your study found that women or Latinos are excluded from engineering and science degrees, that would reflect poorly on the university and the administration. It may be important for researchers to form a partnership with the agency or university whose data is included in the secondary data analysis. Administrators will trust people who they perceive as competent, reputable, and objective. They must trust you to engage in rigorous and conscientious research. A disreputable researcher may seek to raise their reputation by finding shocking results (real or fake) in your university’s data, while damaging the reputation of the university.

On the other hand, if your secondary data analysis paints the university in a glowing and rosy light, other researchers may be skeptical of your findings. This problem concerned Steven Levitt, an economist who worked with Uber to estimate how much consumers saved by using its service versus traditional taxis. Levitt knew that he would have to partner with Uber in order to gain access to their data but was careful to secure written permission to publish his results, regardless of whether his results were positive or negative for Uber (Huggins, 2016). Huggins, H. (Producer). (2016, September 7). Why Uber is an economist’s dream [Audio podcast]. Retrieved from: http://freakonomics.com/podcast/uber-economists-dream/ Researchers using secondary data must be careful to build trust with gatekeepers in administration while not compromising their objectivity through conflicts of interest.

Strengths of secondary data analysis

While the challenges associated with secondary data analysis are important, the strengths of secondary data analysis often outweigh these limitations. Most importantly, secondary data analysis is quicker and cheaper than a traditional study because the data are already collected. Once a researcher gains access to the data, it is simply a matter of analyzing it and writing up the results to complete the project. Data can take a long time to gather and be quite resource-intensive. So, avoiding this step is a significant strength of secondary data analysis. If the primary researchers had access to more resources, they may also be able to engage in data collection that is more rigorous than a secondary researcher could. In this way, outsourcing the data collection to someone with more resources may make your design stronger, not weaker. Finally, secondary researchers ask new questions that the primary researchers may not have considered. In this way, secondary data analysis deepens our understanding of existing data in the field.


stacks in a library, showing books on one side and boxes on another

Secondary data analysis also provides researchers with access to data that would otherwise be unavailable or unknown to the public. A good example of this is historical research, in which researchers analyze data from primary sources of historical events and proceedings. Netting and O’Connor (2016) Netting, F. E., & O’Connor, M. K. (2016). The intersectionality of religion and social welfare: Historical development of Richmond’s nonprofit health and human services. Religions7(1), 13-28. were interested in understanding what impact religious organizations had on the development of human services in Richmond, Virginia. Using documents from the Valentine History Center, Virginia Historical Society, and other sources, the researchers were able to discover the origins of social welfare in the city—traveler’s assistance programs in the 1700s. In their study, they also uncovered the important role women played in social welfare agencies, a surprising finding given the historical disenfranchisement of women in American society. Secondary data analysis provides the researcher with the opportunity to answer questions like these without a time machine. Table 14.3 summarizes the strengths and limitations of existing data.

Table 14.3 Strengths and limitations of existing data
Strengths Limitations
Reduces the time needed to complete the project Anonymous data may not be truly anonymous
Cheaper to conduct, in many cases No control over data collection process
Primary researcher may have more resources to conduct a rigorous data collection than you Cannot refine questions, measures, or procedure based on feedback or pilot tests
Helps us deepen our understanding of data already in the literature May operationalize or conceptualize concepts differently than primary researcher
Useful for historical research Missing qualitative context
Barriers to access and conflicts of interest

Ultimately, you will have to weigh the strengths and limitations of using secondary data on your own. Engel and Schutt (2016, p. 327) Engel, R. J. & Schutt, R. K. (2016). The practice of research in social work (4th ed.). Washington, DC: SAGE Publishing. propose six questions to ask before using secondary data:

  1. What were the agency’s or researcher’s goals in collecting the data?
  2. What data were collected, and what were they intended to measure?
  3. When was the information collected?
  4. What methods were used for data collection? Who was responsible for data collection, and what were their qualifications? Are they available to answer questions about the data?
  5. How is the information organized (by date, individual, family, event, etc.)? Are there identifiers used to identify different types of data available?
  6. What is known about the success of the data collection effort? How are missing data indicated and treated? What kind of documentation is available? How consistent are the data with data available from other sources?

Sources of secondary data

Many sources of quantitative data are publicly available. The General Social Survey (GSS), which was discussed in Chapter 11 , is one of the most commonly used sources of publicly available data among quantitative researchers (http://www.norc.uchicago.edu/GSS+Website). Data for the GSS have been collected regularly since 1972, thus offering social researchers the opportunity to investigate changes in Americans’ attitudes and beliefs over time. Questions on the GSS cover an extremely broad range of topics, from family life to political and religious beliefs to work experiences.

Other sources of quantitative data include Add Health (http://www.cpc.unc.edu/projects/addhealth), a study that was initiated in 1994 to learn about the lives and behaviors of adolescents in the United States, and the Wisconsin Longitudinal Study (https://www.ssc.wisc.edu/wlsresearch), a study that has, for over 40 years, surveyed a panel of 10,000 people who graduated from Wisconsin high schools in 1957. Quantitative researchers interested in studying social processes outside of the United States also have many options when it comes to publicly available data sets. Data from the British Household Panel Study (https://www.iser.essex.ac.uk/bhps), a longitudinal, representative survey of households in Britain, are freely available to those conducting academic research (private entities are charged for access to the data). The International Social Survey Programme (http://www.issp.org) merges the GSS with its counterparts in other countries around the globe. These represent just a few of the many sources of publicly available quantitative data.

Unfortunately for qualitative researchers, far fewer sources of free, publicly available qualitative data exist. This is slowly changing, however, as technical sophistication grows and it becomes easier to digitize and share qualitative data. Despite comparatively fewer sources than for quantitative data, there are still a number of data sources available to qualitative researchers whose interests or resources limit their ability to collect data on their own. The Murray Research Archive Harvard, housed at the Institute for Quantitative Social Science at Harvard University, offers case histories and qualitative interview data (http://dvn.iq.harvard.edu/dvn/dv/mra). The Global Feminisms project at the University of Michigan offers interview transcripts and videotaped oral histories focused on feminist activism; women’s movements; and academic women’s studies in China, India, Poland, and the United States. These data are not free, though they are available at a reasonable price. See the Global Feminisms’ webpage at https://globalfeminisms.umich.edu/contact At the University of Connecticut, the Oral History Office provides links to a number of other oral history sites (http://www.oralhistory.uconn.edu/links.html). Not all the links offer publicly available data, but many do. Finally, the Southern Historical Collection at University of North Carolina–Chapel Hill offers digital versions of many primary documents online such as journals, letters, correspondence, and other papers that document the history and culture of the American South (http://dc.lib.unc.edu/ead/archivalhome.php?CISOROOT=/ead).

Keep in mind that the resources mentioned here represent just a snapshot of the many sources of publicly available data that can be easily accessed via the web. Table 14.4 summarizes the data sources discussed in this section.

Table 14.4 Sources of publicly available data
Organizational home Focus/topic Data Web address
National Opinion Research Center General Social Survey; demographic, behavioral, attitudinal, and special interest questions; national sample Quantitative http://www.norc.uchicago.edu/GSS+Website/
Carolina Population Center Add Health; longitudinal social, economic, psychological, and physical well-being of cohort in grades 7–12 in 1994 Quantitative http://www.cpc.unc.edu/projects/addhealth
Center for Demography of Health and Aging Wisconsin Longitudinal Study; life course study of cohorts who graduated from high school in 1957 Quantitative https://www.ssc.wisc.edu/wlsresearch/
Institute for Social & Economic Research British Household Panel Survey; longitudinal study of British lives and well- being Quantitative https://www.iser.essex.ac.uk/bhps
International Social Survey Programme International data similar to GSS Quantitative http://www.issp.org/
The Institute for Quantitative Social Science at Harvard University Large archive of written data, audio, and video focused on many topics Quantitative and qualitative http://dvn.iq.harvard.edu/dvn/dv/mra
Institute for Research on Women and Gender Global Feminisms Project; interview transcripts and oral histories on feminism and women’s activism Qualitative http://www.umich.edu/~glblfem/index.html
Oral History Office Descriptions and links to numerous oral history archives Qualitative http://www.oralhistory.uconn.edu/links.html
UNC Wilson Library Digitized manuscript collection from the Southern Historical Collection Qualitative http://dc.lib.unc.edu/ead/archivalhome.php? CISOROOT=/ead

While the public and free sharing of data has become increasingly common over the years, and it is an increasingly common requirement of those who fund research, Harvard researchers recently learned of the potential dangers of making one’s data available to all (Parry, 2011). Parry, M. (2011, July 10). Harvard researchers accused of breaching students’ privacy. The Chronicle of Higher Education. Retrieved from https://chronicle.com/article/Harvards-Privacy-Meltdown/128166 In 2008, Professor Nicholas Christakis, Jason Kaufman, and colleagues, of Harvard’s Berkman Center for Internet & Society, rolled out the first wave of their data collected from the profiles of 1,700 Facebook users (2008). Berkman Center for Internet & Society. (2008, September 25). Tastes, ties, and time: Facebook data release. Retrieved from https://cyber.law.harvard.edu/node/4682 But shortly thereafter, the researchers were forced to deny public access to the data after it was discovered that subjects could easily be identified with some careful mining of the data set. Perhaps only time and additional experience will tell what the future holds for increased access to data collected by others.


Key Takeaways

  • The strengths and limitations of secondary data analysis must be considered before a project begins.
  • Previously collected data sources enable researchers to conduct secondary data analysis.


Glossary

  • Anonymized data- data that does not contain identifying information
  • Historical research-analyzing data from primary sources of historical events and proceedings
  • Secondary data analysis- analyzing data originally gathered by another person or entity


Image attributions

anonymous by SplitShire CC-0

archive by Pexels CC-0


71

14.5 Reliability in unobtrusive research

Learning Objectives

  • Define stability and describe strategies for overcoming problems of stability
  • Define reproducibility and describe strategies for overcoming problems of reproducibility
  • Define accuracy and describe strategies for overcoming problems of accuracy


This final section of this chapter investigates a few particularities related to reliability in unobtrusive research projects that warrant our attention. These particularities have to do with how and by whom the coding of data occurs. Issues of stability, reproducibility, and accuracy all speak to the unique problems—and opportunities—with establishing reliability in unobtrusive research projects (Krippendorff, 2009). Krippendorff, K. (2009). Testing the reliability of content analysis data: What is involved and why. In K. Krippendorff & M. A. Bock (Eds.), The content analysis reader (pp. 350–357). Thousand Oaks, CA: Sage.

Stability refers to the extent to which the results of coding vary across different time periods. If stability is a problem, it will reveal itself when the same person codes the same content at different times and comes up with different results. Coding is said to be stable when the same content has been coded multiple times by the same person with the same result each time. If you discover problems of instability in your coding procedures, it is possible that your coding rules are ambiguous and need to be clarified. Ambiguities in the text itself might also contribute to problems of stability. While you cannot alter your original textual data sources, simply being aware of possible ambiguities in the data as you code may help reduce the likelihood of problems with stability. It is also possible that problems with stability may result from a simple coding error, such as inadvertently writing a 1 instead of a 10 on your code sheet.


two people looking through the same microscope

Reproducibility, also referred to as inter-rater reliability (Lombard, Snyder-Duch, & Campanella Bracken, 2010), Lombard, M., Snyder-Duch, J., & Campanella Bracken, C. (2004). Practical resources for assessing and reporting intercoder reliability in content analysis research projects. Retrieved from http://astro.temple.edu/~lombard/reliability is the extent to which your coding procedures will result in the same results when the same text is coded by different people. We covered this problem in Chapter 9 when we talked about reliability of quantitative measures. Cognitive differences among the individuals coding data may result in problems with reproducibility, as could ambiguous coding instructions. Random coding errors might also cause problems.

One way of overcoming problems of reproducibility is to have coders code together. While working as a graduate research assistant, a colleague participated in a content analysis project in which four individuals shared the responsibility for coding data. To reduce the potential for reproducibility problems with their coding, they conducted the coding at the same time in the same room, so they could consult one another when they ran into problems or had questions about what they were coding. Resolving those ambiguities together meant they grew to have a shared understanding of how to code various bits of data.

Finally, accuracy refers to the extent to which your coding procedures correspond to some preexisting standard. For example, maybe you are interested in the accessibility of informational pamphlets and brochures to clients of a public health clinic or students at your university. You could get a sample of the documents given to your target population and code using your own scheme—perhaps looking at reading level, attractiveness, and organization. To ensure the accuracy of your coding, you could consult the Centers for Disease Control’s Clear Communication Index, a standard measure of the clarity of a written product. For more information about the Clear Communication Index, visit the website https://www.cdc.gov/ccindex/tool/how-to-use.html.

This example presumes that a standard coding strategy has already been established for whatever text you’re analyzing. It may not be the case that official standards have been set, but perusing the prior literature for the collective wisdom on coding on your particular area is time well spent. Scholarship focused on similar data or coding procedures will no doubt help you to clarify and improve your own coding procedures.


Key Takeaways

  • Stability can become an issue in unobtrusive research project when the results of coding by the same person vary across different time periods.
  • Reproducibility has to do with multiple coders’ results being the same for the same text.
  • Accuracy refers to the extent to which one’s coding procedures correspond to some preexisting standard.


Glossary

  • Accuracy- the extent to which one’s coding procedures correspond to some preexisting standard
  • Reproducibility- the extent to which one’s coding procedures will result in the same results when the same text is coded by different people
  • Stability- the extent to which the results of coding vary across different time periods


Image attributions

NAMRU-6-malaria by US Navy public domain


XV

15. Real-world research

72

15.0 Chapter introduction

The previous chapters have focused on how social work use social science research methods to understand the world. But what about social workers who aren’t researchers? Social workers in practice may not have time or interest in conducting experiments or focus groups for the purposes of scholarly publication. While the preceding chapters should provide you the information you need to understand the research conducted by professional researchers, social workers in practice still must use research skills to help their clients. This chapter will review three approaches to research that social workers will use while in practice.

Chapter Outline

Content Advisory

This chapter discusses or mentions the following topics:  substance abuse.

73

15.1 Evaluation research

Learning Objectives

  • Describe how to conduct evaluation research
  • Define inputs, outputs, and outcomes
  • Identify the three goals of process assessment


As you may recall from the definition provided in Chapter 1, evaluation research is research conducted to assess the effects of specific programs or policies. Evaluation research is often used when some form of policy intervention is planned, such as welfare reform or school curriculum change. The focus on interventions and social problems makes it natural fit for social work researchers. It might be used to assess the extent to which intervention is necessary by attempting to define and diagnose social problems in a social worker’s service area, and it might also be used to understand whether their agency’s interventions have had their intended consequences.

I often remind my students they will eventually have bright ideas about what programs or interventions their agency should try. Moreover, they will eventually be so good at their job they will take on additional administrative and supervisory responsibilities. As a result, you will need to prove to your agency, and in particular, the people who fund your agency that your interventions are successful. Government and private grants almost universally come with a requirement that outcomes be measured and reported in order to maintain funding.


scrabble tiles spelling out the word "assess"

An outcomes assessment is an evaluation designed to discover if a program achieved its intended outcomes. Much like all of research, it comes with its own peculiar terminology that resembles an assembly line at a factory (Engel & Schutt, 2016). Engel, R. J. & Schutt, R. K. (2016). The practice of research in social work (4th ed.). Washington, DC: SAGE Publishing. Inputs are the resources needed for the program to operate. These include physical location, any equipment needed, staff (and experience/knowledge of those staff), monetary funding, and most importantly, the clients. Program administrators pull together the necessary resources to run an intervention or program. The program is the intervention your clients receive—perhaps giving them access to housing vouchers or enrolling them in a smoking cessation class.

The outputs of programs are tangible results of the program process—i.e., the boring things that come out of your program. Outputs in a program might include the number of clients served, staff members trained to implement the intervention, mobility assistance devices distributed, nicotine patches distributed, etc. By contrast, outcomes speak to the purpose of the program itself.

Outcomes are the observed changes, whether intended or unintended, that occurred due to the program or intervention. By looking at each of these domains, evaluation researchers can obtain a comprehensive view of the program.

Let’s run through an example from my wife’s social work practice. She runs an after-school bicycling club called Pedal Up for children with mental health issues. She has a lot of inputs in her program. First, there are the children who enroll, the volunteer and paid staff members who supervise the kids (and their knowledge about bicycles and children’s mental health), the bicycles and equipment that all clients and staff use, the community center room they use as a home base, the paths of our city where they ride their bikes, and the public and private grants they use to fund the program. Next, the program itself is a twice weekly after-school program in which children learn about bicycle maintenance and bicycle safety for about 30 minutes each day and then spend at least an hour riding around the city on bicycle trails.

In measuring the outputs of this program, she has many options. She would probably include the number of children and staff participating in the program or the number of bike rides or lessons given. Other outputs might include the number of miles logged by the children over the school year, the number of bicycle helmets or spare tires distributed, etc. Finally, the outcomes of the programs might include providing surveys to family members or teachers to see if each child’s mental health symptoms have improved, counting any behavioral issues at school, or conducting a child-friendly survey with the children themselves.

Outcomes assessments are performed at the end of a program or at specific points during the grant reporting process. What if a social worker wants to assess earlier on in the process if the program is on target to achieve its outcomes? In that case a process assessment is recommended, which evaluates a program in its earlier stages. Faulkner and Faulkner (2016) Faulkner, S. S. & Faulkner, C. A. (2016). Research methods for social workers: A practice-based approach. New York, NY: Oxford University Press. describe three main goals for conducting a process evaluation.

The first is program description, in which the researcher simply tries to understand how the program looks like in everyday life for clients and staff members. In our Pedal Up example, assessing program description might involve measuring in the first few weeks the hours children spent riding their bikes, the number of children and staff in attendance, etc. This data will provide those in charge of the program an idea of how their ideas have translated from the grant proposal to the real world. If, for example, not enough children are showing up or if children are only able to ride their bikes for ten minutes each day, it may indicate that something is wrong.

Another important goal of process assessment is program monitoring. If you have some social work practice experience already, it’s likely you’ve encountered program monitoring. Agency administrators may look at sign-in sheets for groups, hours billed by clinicians, or other metrics to track how services are utilized over time. They may also assess whether clinicians are following the program correctly or if they are deviating from how the program was designed. This can be an issue in program evaluations of specific treatment models, as any differences between what the administrators conceptualized and what the clinicians implemented jeopardize the internal validity of the evaluation. If, in our Pedal Up example, we have a staff member who does not review bike safety each week or does not enforce helmet laws for some students, we could catch that through program monitoring.

The final goal of process assessments is quality assurance. At its most simple level, quality assurance may involve sending out satisfaction questionnaires to clients and staff members. If there are serious issues, it’s better to know them early on in a program so the program can be adapted to meet the needs of clients and staff. It is important to solicit staff feedback in addition to consumer feedback, as they have insight into how the program is working in practice and areas in which they may be falling short of what the program should be. In our example, we could spend some time talking with parents when they pick their children up from the program or hold a staff meeting to provide opportunities for those most involved in the program to provide feedback.

Evaluation research is a part of all social workers’ toolkits. It ensures that social work interventions achieve their intended effects. This protects our clients and ensures that money and other resources are not spent on programs that do not work. Evaluation research uses the skills of quantitative and qualitative research to ensure clients receive interventions that have been shown to be successful.


Key Takeaways

  • Evaluation research is a common research task for social workers.
  • Outcomes assessment evaluate the degree to which programs achieved their intended outcomes.
  • Outputs differ from outcomes.
  • Process assessments evaluate a program in its early stages, so changes can be made.


Glossary

  • Inputs- resources needed for the program to operate
  • Outcomes- the issues you are trying to change in your clients
  • Outcomes assessment- an evaluation designed to discover if a program achieved its intended outcomes
  • Outputs- tangible results of the program process
  • Process assessment- an evaluation conducted during the earlier stages of a program or on an ongoing basis
  • Program- the intervention clients receive


Image attributions

assess by Wokandapix CC-0


74

15.2 Single-subjects design

Learning Objectives

  • Identify why social workers might use single-subjects design
  • Describe the two stages of single-subjects design


Single-subjects design is distinct from other research methodologies in that, as its name indicates, only one person is being studied. Because clinical social work often involves one-on-one practice, single-subjects designs are often used by social workers to ensure that their interventions are having a positive effect. While the results will not be generalizable, they do provide important insight into the effectiveness of clinical interventions. Single-subjects designs involve repeated measurements over time, usually in two stages.

The baseline stage is the period of time before the intervention starts. During the baseline stage, a social worker would be looking for a pattern to emerge. For example, a person with substance abuse issues may binge drink on the weekends but cut down their drinking during the work week. A substance abuse social worker may ask a client to record their alcohol intake, and probably after a few weeks, would begin to notice this pattern. Ideally, social workers would start measuring a client for a little while before starting their intervention to discover this pattern naturally. Unfortunately, that may be impractical or unethical to do in practice. A retrospective baseline can be attained by asking the client to recollect a few weeks before the intervention started, though it likely to be less reliable than a baseline recorded in real time. The baseline is important because unlike in experimental design, there is no control group. Thus, we have to see if our intervention is effective by comparing the client before and during treatment.


a therapist sits across from a client whose hands are on his head feeling some kind of emotion

The next stage is the treatment stage, and it refers to the time in which the treatment is administered by the social worker. Repeated measurements are taken during this stage to see if your treatment is having the intended effect. But what exactly are we measuring in single-subjects design? Continuing with our example of substance abuse, we could measure the number of drinks that our client consumes in a night. In this example, we should assume that the client’s binge drinking is identified as a problem by the client and it’s a part of their treatment plan. By looking at the number of drinks they consume, we could evaluate the level of alcohol consumption— for example, by looking at how close they are to dangerously high levels of intoxication. We could look for trends— perhaps the client is in crisis and their drinking getting worse by the day. We may also look at variability, like when their binge drinking is most profound—on weekends or when they are around certain family members.

Generally, the measure is graphed on an X-Y axis like in Figure 15.1. The x-axis is time, as measured in days. The y-axis is the problem we’re trying to change, our dependent variable. In Figure 15.1 below, the y-axis is our client’s count of the number of drinks per day. The first fourteen days (or two weeks) our client did not receive any treatment. This is the baseline phase, and we can see the pattern emerge in their drinking. They drink to excess on the weekends. Once our treatment has started on day 15, we can see that pattern decrease somewhat, indicating the treatment is starting to work.


a single-subjects graph with drinks on the y axis and day of the month on the x axis
Figure 15.1 Example x-y graph for single subjects design

By visualizing the data in this way, we can identify patterns for analysis. For example, it looks like our client engages in binge drinking on a weekly basis. Days 5-6, 12-15, and 21-22 all contain the highest number of drinks. Their level of drinking is more moderate on other days, though the total amount is still worrying. This is known as a trend in the data. Our client’s baseline trend is curvilinear, going up for a few days and dipping back down. The baseline phase should extend until a trend is evident. Establishing a trend can prove difficult in clients whose behaviors vary widely. The curvilinear trend reappears in the treatment stage once but does not appear again as expected. This suggests that our intervention may have stopped the client from binging again, though certainly further measurement is warranted to make sure.

Although it may be difficult to see visually, if you do the math, our client consumed about one less drink per day after we started the treatment. On average, the client consumed 3.65 drinks per day in the baseline phase and 2.64 drinks in the treatment phase. While this decrease is encouraging, our client is still engaging in excessive use of alcohol. We may want to further refine and target our intervention. If we were to begin a new course of treatment or add a new dimension to our existing treatment, we would be executing a multiple treatment design. For example, let’s say we revised our treatment on day 30. Our graphing would continue as before, but with another vertical line on day 30, indicating a new treatment began. Another option would be to withdraw our treatment for fifteen days and continue to measure the client, reestablishing a baseline. If the client continues to improve after the treatment is withdrawn, then it is likely to have lasting effects. While I don’t think this is advisable for our client, given their problematic use and the short time in treatment, it may make sense after a period of sobriety has been achieved.

Single-subjects designs, much like evaluation research in the previous section, are used to demonstrate that social work intervention has its intended effects. There was a time in the history of social work in which single-subjects designs were thought to be a method of creating a new scientific foundation for social work (Kirk & Reid, 2002). Kirk, S. A. & Reid, W. J. (2002). Science and social work: A critical appraisal. New York, NY: Columbia University Press. Social workers were to be practitioner-researchers whose practice would empirically test various interventions, ensure competence and effective practice, and demonstrate measurable change to clients. Most social workers do not receive extensive training in single-subjects designs. More importantly, practitioners may be too overworked or undercompensated to conduct data collection and analysis, given that it is not a reimbursable activity for insurance companies. This is in contrast to evaluation research, for which data collection and analysis are incorporated as part of the grant funding system. For this reason, the practitioner-researcher divide has been bridged mostly through evaluation research and partnerships between practitioners and academic researchers. Agency administrators partner with researchers to implement and test academic ideas in the real-world.

Single-subjects designs are most compatible with clinical modalities such as cognitive-behavioral therapy which incorporate as part of treatment client self-monitoring, clinician data analysis, and quantitative measurement. It is routine in this therapeutic model to track, for example, the number of intrusive thoughts experienced between counseling sessions. Moreover, practitioners spend time each session reviewing changes in patterns during the therapeutic process, using it to evaluate and fine-tune the therapeutic approach. Although researchers have used single-subjects designs with less positivist therapies, such as narrative therapy, the single-subjects design is generally used in therapies with more quantifiable outcomes. The results of single-subjects studies are not generalizable to the overall population, but they help ensure that social workers are not providing useless or counterproductive interventions to their clients.


Key Takeaways

  • Social workers conduct single-subjects research designs to make sure their interventions are effective.
  • Single-subjects designs use repeated measures before and during treatment to assess the effectiveness of an intervention.
  • Single-subjects designs use a graphical representation of numerical data to look for patterns.


Glossary

  • Baseline stage- the period of time before the intervention starts
  • Multiple treatment design- beginning a new course of treatment or add a new dimension to an existing treatment
  • Treatment stage- the time in which the treatment is administered by the social worker
  • Trend- a pattern in the data of a single-subjects design


Image attributions

counseling by tiyowprasetyo CC-0


75

15.3 Action research

Learning Objectives

  • Define and provide at least one example of action research
  • Describe the role of stakeholders in action research


Action research is defined as research that is conducted for the purpose of creating social change. When conducting action research, scholars collaborate with community stakeholders at all stages of the research process with the aim of producing results that will be usable in the community and by scientists. We defined stakeholders in Chapter 8, as individuals or groups who have an interest in the outcome of your study. Social workers who engage in action research never just go it alone; instead, they collaborate with the people who are affected by the research at each stage in the process. Stakeholders, particularly those with the least power, should be consulted on the purpose of the research project, research questions, design, and reporting of results.


people with their fists raised at a protest on the street

Action research also distinguishes itself from other research in that its purpose is to create change on an individual and community level. Kristin Esterberg puts it quite eloquently when she says, “At heart, all action researchers are concerned that research not simply contribute to knowledge but also lead to positive changes in people’s lives” (2002, p. 137). Esterberg, K. G. (2002). Qualitative methods in social research. Boston, MA: McGraw-Hill. As you might imagine, action research is consistent with the assumptions of the critical paradigm, which focuses on liberating people from oppressive structures. Action research has multiple origins across the globe, including Kurt Lewin’s psychological experiments in the US and Paulo Friere’s literacy and education programs (Adelman, 1993; Reason, 1994). Adelman, C. (1993). Kurt Lewin and the origins of action research. Educational Action Research, 1, 7-24.; Reason, P. (1994). Participation in human inquiry. London, UK: Sage. Over the years, action research has become increasingly popular among scholars who wish for their work to have tangible outcomes that benefit the groups they study.

Action research does not bring any new methodological tricks or terms, but it uses the processes of science in a different way than traditional research. What topics are important to study in a neighborhood or with a target population? A traditional scientist might look at the literature or use their practice wisdom to formulate a question for quantitative or qualitative research. An action researcher, on the other hand, would consult with the target population itself to see what they thought the most pressing issues are and their proposed solutions. In this way, action research flips traditional research on its head. Scientists are more like consultants who provide the tools and resources necessary for a target population to achieve their goals and address social problems.

According to Healy (2001), Healy, K. (2001). Participatory action research and social work: A critical appraisal. International Social Work, 44, 93-105. the assumptions of participatory-action research are that (a) oppression is caused by macro-level structures such as patriarchy and capitalism; (b) research should expose and confront the powerful; (c) researcher and participant relationships should be equal, with equitable distribution of research tasks and roles; and (d) research should result in consciousness-raising and collective action. Coherent with social work values, action research supports the self-determination of oppressed groups and privileges their voice and understanding through the conceptualization, design, data collection, data analysis, and dissemination processes of research.

There are many excellent examples of action research. Some of them focus solely on arriving at useful outcomes for the communities upon which and with whom research is conducted. Other action research projects result in some new knowledge that has a practical application and purpose in addition to the creation of knowledge for basic scientific purposes.

One example of action research can be seen in Fred Piercy and colleagues’ (Piercy, Franz, Donaldson, & Richard, 2011) Piercy, F. P., Franz, N., Donaldson, J. L., & Richard, R. F. (2011). Consistency and change in participatory action research: Reflections on a focus group study about how farmers learn. The Qualitative Report, 16, 820–829. work with farmers in Virginia, Tennessee, and Louisiana. Together with farmers in these states, the researchers conducted focus groups to understand how farmers learn new information about farming. Ultimately, the aim of this study was to “develop more meaningful ways to communicate information to farmers about sustainable agriculture” (p. 820). This improved communication, the researchers and farmers believed, would benefit not just researchers interested in the topic but also farmers and their communities. Farmers and researchers were both involved in all aspects of the research, from designing the project and determining focus group questions to conducting the focus groups and finally to analyzing data and disseminating findings.

Many additional examples of action research can be found at Loyola University Chicago’s Center for Urban Research and Learning (CURL; http://www.luc.edu/curl/index.shtml). The mission of the center is to create “innovative solutions that promote equity and opportunity in communities throughout the Chicago metropolitan region” (CURL, n.d., para. 1). CURL. (n.d.) Mission. Retrieved from: https://www.luc.edu/curl/Mission.shtml For example, in 2006 researchers at CURL embarked on a project to assess the impact on small, local retailers of new Walmart stores entering urban areas (Jones, 2008). Jones, S. M. (2008, May 13). Cities may mute effect of Wal-Mart. Chicago Tribune. The study found that while the effect of Walmart on local retailers seems to have a larger impact in rural areas, Chicago-area local retailers did not experience as dramatic an impact. Nevertheless a “small but statistically significant relationship” was found between Walmart’s arrival in the city and local retailers’ closing their doors (Jones, 2008, para. 3). This and other research conducted by CURL aims to raise awareness about and promote positive social change around issues affecting the lives of people in the Chicago area. CURL meets this aim by collaborating with members of the community to shape a research agenda, collect and analyze data, and disseminate results.

Perhaps one of the most unique and rewarding aspects of engaging in action research is that it is often interdisciplinary. Action research projects might bring together researchers from any number of disciplines, from the social sciences, such as sociology, political science, and psychology; to an assortment of physical and natural sciences, such as biology and chemistry; to engineering, philosophy, and history (to name just a few). One recent example of this kind of interdisciplinary action research can be seen in the University of Maine’s Sustainability Solutions Initiative (SSI) (https://umaine.edu/mitchellcenter/sustainability-solutions-initiative/). This initiative unites researchers from across campus together with local community members to “connect knowledge with action in ways that promote strong economies, vibrant communities, and healthy ecosystems in and beyond Maine” (Senator George J. Mitchell Center for Sustainability Solutions, para. 1). Senator George J. Mitchell Center for Sustainability Solutions. (n.d.) Sustainability solutions initiative. Retrieved from: https://umaine.edu/mitchellcenter/sustainability-solutions-initiative/ The knowledge-action connection is essential to SSI’s mission, and the collaboration between community stakeholders and researchers is crucial to maintaining that connection. SSI is a relatively new effort; stay tuned to the SSI website to follow how this collaborative action research initiative develops.

Anyone interested in social change can benefit from having some understanding of social scientific research methods. The knowledge you’ve gained from your methods course can be put to good use even if you don’t have an interest in pursuing a career in research. As a member of a community, perhaps you will find that the opportunity to engage in action research presents itself to you one day. Your background in research methodology will no doubt assist you in making life better for yourself and those who share your interests, circumstances, or geographic region.


Key Takeaways

  • Action research is conducted by researchers who wish to create some form of social change.
  • Stakeholders are true collaborators in action research.
  • Action research is often conducted by teams of interdisciplinary researchers.


Glossary

  • Action research- research that is conducted for the purpose of creating some form of social change in collaboration with stakeholders


Image attributions

protest by BruceEmmerling CC-0


XVI

16. Reporting research

76

16.0 Chapter introduction

The previous chapters in this textbook described how to create a research question and answer it using the methods of social science. Once you’ve completed your analysis, your project is not over. In many ways, it is just beginning. In the beginning of this textbook, you were introduced to the idea that social work research as knowledge for action on behalf of target populations. Research that sits idle on your computer is not of use to anyone. Most social workers who conduct research hope their work will have relevance to others besides themselves. As such, research is a public activity. While the work may be conducted by an individual in a private setting, the knowledge gained from that work should be shared with peers and other parties who may have an interest. Understanding how to share your work is an important aspect of the research process.

Chapter Outline

Content Warning

This chapter discusses or mentions the following topics: sexual and domestic violence, poverty, mental health, the criminal justice system, and cancer.

77

16.1 What to share and why we share

Learning Objectives

  • Identify the six questions researchers should be able to answer to ensure that their ethical obligations have been met
  • Describe how social work roles might shape how a person shares research findings


When preparing to share your work with others you must decide what to share, with whom to share it, and in what format(s) to share it. In this section, we’ll consider the former two aspects of sharing your work. In the section that follows, we’ll consider the various formats through which social workers might share their work.


woman sitting at computer in a conference room

Sharing it all: The good, the bad, and the ugly

Because conducting social work research is a scholarly pursuit and because social work researchers generally aim to reach a true understanding of social processes, it is crucial that we share all aspects of our research—the good, the bad, and the ugly. Doing so helps ensure that others will understand, use, and effectively critique our work. We considered this aspect of the research process in Chapter 5, but it is worth reviewing here. We learned about the importance of sharing all aspects of our work for ethical reasons and for the purpose of replication. In preparing to share your work with others, and in order to meet your ethical obligations as a social work researcher, challenge yourself to answer the following questions:

Understanding why you conducted your research will help you be honest—with yourself and your readers—about your own personal interest, investments, or biases with respect to the work. In Chapter 2, I suggested that starting where you are is an effective way to begin a research project. While this is true, using the idea of starting where you are effectively requires that you be honest with yourself and your readers about where you are and why you have chosen to conduct research on your topic. Being able to clearly communicate how you conducted your research is also important. This means being honest about your data collection methods, sample and sampling strategy, and data analysis.

The third question in the list is designed to help you articulate who the major stakeholders are in your research. Of course, the researcher is a stakeholder. Additional stakeholders might include funders, research participants, or others who share something in common with your research subjects (e.g., members of some community where you conducted research or members of the same social group, such as parents or athletes, upon whom you conducted your research). Professors for whom you conducted research as part of a class project might be stakeholders, as might employers for whom you conducted research. Understanding the answer to this question will allow you target formal and informal venues to share your research, which we will review in the next section.

The fourth question should help you think about the major strengths of your work. Finally, the last two questions are designed to make you think about potential weaknesses in your work and how future research might build from or improve upon your work. Presenting your research honestly requires admitting the limitations of your study but arguing why the results are important anyway. All scientific studies contain limitations and are open to questioning.

Social work roles

Another important factor is sharing your research is the social work role the researcher intends to adopt. For example, let’s imagine you have completed a study on domestic and sexual violence within your service area—four rural counties closest to your office. Your study found that domestic and sexual violence (DV/SV) occurs more often in your services area than the national or state average and is associated with poverty, mental health diagnosis, and race. Indeed, the majority of survivors in your study do not engage with formal supports, including advocacy or counseling, or the criminal justice system, including police or courts. How can we use these results to inform practice across the micro to macro spectrum?

Dubois and Krogsrud Miley (2005) describe generalist social work roles across three practice areas. The first practice area is resource management, and generalist social workers should understand that “resources are power” (p. 236). Organizations and individuals with money, knowledge, talent, staff, office space, technology, and other resources hold power in the social space and our ability to martial those resources on behalf of our clients can determine their treatment outcomes. The second practice area is education, and the authors emphasize that “knowledge is power,” as well. Social work involves learning from and educating our clients, as well as sharing our knowledge where it is needed in the social service system. The final practice area is consultancy, recognizing that social workers bring expertise and resources and collaborate with clients to create solutions to problems. Let’s think about how social workers on the micro, meso, and macro level might act within these roles to bring about change based on empirical research findings.


a child grasping the finger of an adult

If you are engaged in macro social work, the activist role demands advocacy on behalf of target populations to individuals who control resources. Your research provides clear evidence that county or state governments should dedicate more resources to combatting DV/SV in your area. Perhaps you wish to lobby these individuals directly through phone calls or letter campaigns which include your results. Another option would be to partner with DV/SV service agencies who can use your results in grant applications for additional funding for DV/SV services. Your research sharing—be it in the form of a journal article, conference presentation, editorial article, interview on local media, among countless others—contributes to what we all know about DV/SV as a society. You may also engage in the role of a planner, creating new programs and marshalling resources to address the growing problem of DV/SV is your community.

Meso-level social work roles are also compatible with disseminating social work research. As a convener and mediator, social workers can bring together community leaders and organizations to address problems as a team. Using your research, you can highlight how the problems of domestic and sexual violence, poverty, race, and criminal justice are intertwined. Perhaps your research can be a catalyst to creating a task force on DV/SV in your area. Your research could convince anti-poverty organizations, anti-racist organizations, as well as police, to come together to address a problem jointly. Your research will assure everyone that their time and resources are dedicated to a pressing community need. You may also use your research to propose trainings and outreach to advocates or police officers, to help them better accommodate survivors and lower the barriers to access supports in the community.

As a micro-level social worker, you can share the results of your study with your client, which may make them feel less alone and contextualize their struggle within their home community. You can advocate within the current system for your client’s right to services, for exceptions to policies that block them from accessing necessary resources, and for the effective delivery of services by DV/SV agencies. Your research may also cue you to address the effects of racism and poverty in their lives, providing a more comprehensive approach to intervention. Micro-level social workers also engage in educational practice roles, as well. Social workers not only work in intervention with survivors and abusers, but also in prevention roles that aim to stop abuse before it happens. Educating children on healthy relationships can help prevent domestic and sexual violence from happening, and your research can contribute to how violence is experienced in your community.

Social work research is research for action on behalf of target populations. Sharing your results with the world is a necessary part of that mission.


Key Takeaways

  • As they prepare to share their research, researchers must keep in mind their ethical obligations to their peers, their research participants, and the public.
  • Social work roles across the ecosystem will shape how one’s results are shared and for what purpose.


Image attributions

typing by StartupStockPhotos CC-0

hand by Myriams-Fotos CC-0


78

16.2 Disseminating your findings

Learning Objectives

  • Define dissemination
  • Describe how audience impacts the content and purpose of dissemination
  • Identify the options for formally presenting your work to other scholars
  • Explain the role of stakeholders in dissemination


Dissemination refers to “a planned process that involves consideration of target audiences and the settings in which research findings are to be received and, where appropriate, communicating and interacting with wider policy and…service audiences in ways that will facilitate research uptake in decision-making processes and practice” (Wilson, Petticrew, Calnan, & Natareth, 2010, p. 91). Wilson, P. M., Petticrew, M., Calnan, M. W., & Natareth, I. (2010). Disseminating research findings: What should researchers do? A systematic scoping review of conceptual frameworks. Implementation Science, 5, 91. In other words, dissemination of research findings involves careful planning, thought, consideration of target audiences, and communication with those audiences. Writing up results from your research and having others take notice are two entirely different propositions. In fact, the general rule of thumb is that people will not take notice unless you help and encourage them to do so.


a row of microphones on a stage

Disseminating your findings successfully requires determining who your audience is, where your audience is, and how to reach them. When considering who your audience is, think about who is likely to take interest in your work. Your audience might include those who do not express enthusiastic interest but might nevertheless benefit from an awareness of your research. Your research participants and those who share some characteristics in common with your participants are likely to have some interest in what you’ve discovered in the course of your research. Other scholars who study similar topics are another obvious audience for your work. Perhaps there are policymakers who should take note of your work. Organizations that do work in an area related to the topic of your research are another possibility. Finally, any and all inquisitive and engaged members of the public represent a possible audience for your work.

Where your audience is should be fairly obvious. You know where your research participants are because you’ve studied them. You can find interested scholars on your campus (e.g., perhaps you could offer to present your findings at a campus event); at professional conferences; and via publications, such as professional organizations’ newsletters (an often-overlooked source for sharing findings in brief form) and scholarly journals. Policymakers include your state and federal representatives who, at least in theory, should be available to hear a constituent speak on matters of policy interest. Perhaps you’re already aware of organizations that do work in an area related to your research topic, but if not, a simple web search should help you identify possible organizational audiences for your work. Disseminating your findings to the public more generally could take any number of forms: a letter to the editor of the local newspaper, a blog, or even a post or two on your social media channels.

Finally, determining how to reach your audiences will vary according to which audience you wish to reach. Your strategy should be determined by the norms of the audience. For example, scholarly journals provide author submission instructions that clearly define requirements for anyone wishing to disseminate their work via a particular journal. The same is true for newspaper editorials; check your newspaper’s website for details about how to format and submit letters to the editor. If you wish to reach out to your political representatives, a call to their offices or a simple web search should tell you how to do so.

Whether you act on all these suggestions is ultimately your decision. But if you’ve conducted high-quality research and you have findings that are likely to be of interest to any constituents besides yourself, I would argue that it is your duty as a scholar and a social worker to share those findings. In sum, disseminating findings involves the following three steps:

Tailoring your message to your audience

Once you are able to articulate what to share, you must decide with whom to share it. While you would never alter your actual findings for different audiences, understanding who your audience is will help you frame your research in a way that is most meaningful to that audience. Certainly, the most obvious candidates with whom you’ll share your work are other social scientists. If you are conducting research for a class project, your main “audience” will probably be your professor. Perhaps you’ll also share your work with other students in the class.

What is more challenging, and possibly a little scary, is sharing your research with the wider world. Sharing with professional audiences is designed to bring your work to the attention of other social scientists and academics, but also other social workers or professionals who practice in areas related to your research. In the next few paragraphs, I will refer to my research project on Medicaid programs for individuals with intellectual and developmental disabilities (DeCarlo, Bogenschutz, Hall-Lande, & Hewitt, 2017). DeCarlo, M., Hall-Lande, J. Bogenschutz, M., & Hewitt, A. (2017). State of the states in self-direction for individuals with intellectual and developmental disabilities (Policy research brief 26, 1). Minneapolis, MN:  Research and Training Center on Community Living at the University of Minnesota. Retrieved from: https://ici.umn.edu/index.php?products/view/952 Scientists are probably the most interested in my study’s methods, particularly statistical tests or qualitative data analysis frameworks. Sharing your work with this audience will require you to talk about your methods and data in a different way than you would with other audiences.


four people holding signs with speech bubbles over their head

Many outlets for sharing your research will not let you do so until your results have undergone peer review, which as you’ll remember from Chapter 2 is a formal process in which other esteemed researchers and experts ensure your work meets the standards and expectations of the professional field. Peer review is used for both conference presentations and journal publication, though not all presentations and articles are peer-reviewed. Scientists who evaluate your work will be looking to make sure that your conclusions follow logically from your data, your design minimized error and threats to validity, and your analysis of the literature is reasonable and thorough.

I’ve previously mentioned the qualitative study me and my colleagues conducted on policy for individuals with intellectual and developmental disabilities. After we completed the data analysis, we sought publication in academic journals related to our topic, like the Journal of Disability Policy Studies and Journal of Intellectual and Developmental Disability. In this way, our work would be shared more widely among other scholars and academics who study our topic. Helpfully, these journals were also interdisciplinary. Why limit sharing my results to just social workers? Nurses, state administrators, client advocates, and countless others could make use of my data in their work. It is important for social workers to look outside the discipline when they share their results. Look back at your literature review and note the journal articles that commonly publish on your topic. Not only should you consider submitting your results to these journals, but you should consider subscribing to them (in print or electronically) to stay current on the literature in your topic area.

Scholars take extraordinary care not to commit plagiarism. Presenting someone else’s words or ideas as if they are your own is among the most egregious transgressions a scholar can commit. Indeed, plagiarism has ended many careers (Maffly, 2011) As just a single example, take note of this story: Maffly, B. (2011, August 19). “Pattern of plagiarism” costs University of Utah scholar his job. The Salt Lake Tribune. Retrieved from http://www.sltrib.com/sltrib/cougars/52378377-78/bakhtiari-university-panel-plagiarism.html.csp?page=1 and many students’ opportunities to pursue degrees (Go, 2008). As a single example (of many) of the consequences for students of committing plagiarism, see Go, A. (2008). Two students kicked off semester at sea for plagiarism. U.S. News & World Report. Retrieved from http://www.usnews.com/education/blogs/paper-trail/2008/08/14/two-students-kicked-off-semester-at-sea-for-plagiarism Take this very seriously. If you feel a little afraid and paranoid after reading this warning, consider it a good thing— and let it motivate you to take extra care to ensure that you are not plagiarizing the work of others.

Formal presentations

Getting your work published in a journal is challenging and time-consuming, as journals receive many submissions but have limited room to publish. Researchers often seek to supplement their publications with formal presentations, which, while adhering to stringent standards, are more accessible and have more opportunities to share research. For researchers, presenting your research is an excellent way to get feedback on your work. Professional social workers often make presentations to their peers to prepare for more formal writing and publishing of their work. Presentations might be formal talks, either individually or as part of a panel at a professional conference; less formal roundtable discussions, another common professional conference format; or posters that are displayed in a specially designated area. We’ll look at all three presentation formats here.

When preparing an oral presentation, it is very important to get details well in advance about how long your presentation is expected to last and whether any visual aids such as video or slideshows are expected by your audience. At conferences, the typical oral presentation is usually expected to last between 15 and 20 minutes. While this may sound like a torturously lengthy amount of time, you’ll be amazed by how easily time can fly the first time you present formally. Researchers, myself included, can get so caught up explaining minute details like background literature or measurement quality that we don’t have enough time to thoroughly address the key conclusions of the study. To avoid this all-too-common occurrence, it is crucial that you repeatedly practice your presentation in advance—and time yourself.


photo of many people in a large auditorium listening to a speaker

One stumbling block in oral presentations of research work is spending too much time on the literature review. Keep in mind that with limited time, audience members will be more interested to hear about your original work than to hear you cite a long list of previous studies to introduce your own research. While in scholarly written reports of your work you must discuss the studies that have come before yours, in a presentation of your work the key is to use what precious time you have to highlight your work. Whatever you do in your oral presentation, do not read your paper verbatim. Nothing will bore an audience more quickly than that. Highlight only the key points of your study. These generally include your research question, your methodological approach, your major findings, and a few final takeaway messages.

In less formal roundtable presentations of your work, the aim is usually to help stimulate a conversation about a topic. The time you are given to present may be slightly shorter than in a formal presentation, and you’ll also be expected to participate in the conversation that follows all presenters’ talks. Roundtables can be especially useful when your research is in the earlier stages of development. Perhaps you’ve conducted a pilot study and you’d like to talk through some of your findings and get some ideas about where to take the study next. A roundtable is an excellent place to get some suggestions and also get a preview of the objections reviewers may raise with respect to your conclusions or your approach to the work. Roundtables are also suitable places to network and meet other scholars who share a common interest with you.

Finally, in a poster presentation, you visually present your work. Just as you wouldn’t read a paper verbatim in a formal presentation, avoid at all costs printing and pasting your paper onto a poster board. Instead, think about how to tell the “story” of your work in graphs, charts, tables, and other images. Bulleted points are also fine, as long as the poster isn’t so wordy that it would be difficult for someone walking by very slowly to grasp your major argument and findings. Posters, like roundtables, can be quite helpful at the early stages of a research project because they are designed to encourage the audience to engage you in conversation about your research. Don’t feel that you must share every detail of your work in a poster; the point is to share highlights and then converse with your audience to get their feedback, hear their questions, and provide additional details about your research.

For my study on policy for people with intellectual and developmental disabilities, I decided to present at two social work research conferences the Society for Social Work and Research conference and the Council on Social Work Education’s Annual Program Meeting. I encourage you to consider attending these conferences, and other social work conferences, during your social work education and beyond. Not only will you learn about the cutting edge of research in social work, but you may walk away with a sense of how wide-ranging and vast the professional of social work truly is. Sharing my results with social workers is a good start, but to reach across various fields, my coauthors and I presented at the Association of University Centers on Disability conference, an interdisciplinary conference focused on research and advocacy for people with disabilities.

Presentations to stakeholders

While it is important to let academics and scientists know about the results of your research, it is important to identify stakeholders who would also benefit from knowing the results of your study. Stakeholders, as you’ll recall from Chapters 8 and 15, are individuals or groups who have an interest in the outcome of the study you conduct. Instead of the formal presentations or journal articles you may use to engage academics or fellow researchers, stakeholders will expect a presentation that is engaging, understandable, and immediately relevant to their lives and practice. Informal presentations are no less rigorous than formal presentations, but they do not follow a strict format.

For example, in my project on policy for people with intellectual and developmental disabilities, I could have partnered with the National Association of Developmental Disabilities Program Directors (NASDDDS). NASDDDS provides training and coordination for the participants in our study, disability program administrators. I could make the results of my study relevant to the practice of these administrators and share them via a webinar, presentation at an annual meeting, or policy brief. Because these individuals are practitioners, their foremost concern will be how to apply the results of my study in practice. They are also immensely knowledgeable about my topic, so representing conclusions with the humility required of a social scientist is prudent.

Simultaneously, I could have also addressed people with disabilities through the National Disability Rights Network. In this research project, people with IDD are my target population—the people for whom I want my study to have an impact. Providing these individuals with access to information about the programs designed to support them will support their self-advocacy for better and more responsive programs. Individuals in a state with relatively few benefits can point to programs from other states who have more robust programs as models for policymakers. I stated earlier that scientists and academics may be the most interested in your study’s methods. That is only partially true. Advocates from your target population experience the issues you study every day. Because of that, they are immensely knowledgeable and will closely scrutinize your methods and results to make sure they accurately represent what happens in the real world.

Disseminating to the general public

While there are a seemingly infinite number of informal audiences, there is one more that is worth mentioning—the general public. I often say to my students that social work involves working in the areas of the social world that others do not want to see. Part of our job as social workers is to shine a light towards areas of social injustice and raise the consciousness of the public as a whole. Researchers commonly share their results with popular media outlets to reach a broader audience with their study’s conclusions. Unfortunately, journalism about scientific results can sometimes overstate the degree of certainty researchers have in their conclusions. If you’ve ever heard a study that says chocolate cures cancer, you know what I’m talking about. Consequently, it’s important to review the journalistic standards at the media outlet and reporter you approach by examining their previous work and clarifying the degree of control over the final product you will have.


man staring at rows of post-it notes on the wall

Reports written for public consumption differ from those written for scholarly consumption. As noted elsewhere in this chapter, knowing your audience is crucial when preparing a report of your research. What are they likely to want to hear about? What portions of the research do you feel are crucial to share, regardless of the audience? What level of knowledge do they have about your topic? Answering these questions will help you determine how to shape any written reports you plan to produce. In fact, some outlets answer these questions for you, as in the case of newspaper editorials where rules of style, presentation, and length will dictate the shape of your written report.

Whoever your audience, don’t forget what it is that you are reporting: social scientific evidence. Take seriously your role as a social scientist and your place among peers in your discipline. Present your findings as clearly and as honestly as you possibly can; pay appropriate homage to the scholars who have come before you, even while you raise questions about their work; and aim to engage your readers in a discussion about your work and about avenues for further inquiry. Even if you won’t ever meet your readers face-to-face, imagine what they might ask you upon reading your report, imagine your response, and provide some of those details in your written report.

In this chapter, the venues through which I shared my work may not be particularly helpful to your project (unless you also completed a project on intellectual and developmental disabilities). You will need to identify conferences, journals, stakeholders, or media for disseminating your research results. As you proceed, consider the following questions:


Key Takeaways

  • Disseminating findings takes planning and careful consideration of your audiences.
  • The dissemination process includes determining the who, where, and how of reaching your audiences.
  • Plagiarism is among the most egregious transgressions a scholar can commit.
  • In formal presentations, include your research question, methodological approach, major findings, and a few final takeaways.
  • Roundtable presentations emphasize discussion among participants.
  • Poster presentations are visual representations of research findings that also encourage discussion.
  • Reports for public consumption usually contain fewer details than reports for scholarly consumption.
  • Keep your role and obligations as a social scientist in mind as you write research reports.


Glossary

  • Dissemination- “a planned process that involves consideration of target audiences and the settings in which research findings are to be received and, where appropriate, communicating and interacting with wider policy and…service audiences in ways that will facilitate research uptake in decision-making processes and practice” (Wilson, Petticrew, Calnan, & Natareth, 2010, p. 91)
  • Oral presentation- verbal presentation of research findings to a conference audience
  • Plagiarism- presenting someone else’s words or ideas as if they are your own
  • Poster presentation- presentations that use a poster to visually represent the elements of the study
  • Roundtable presentation- presentations designed to stimulate discussion on a topic


Image attributions

microphone by Skitterphoto CC-0

woman man teamwork by rawpixel CC-0

audience by MariSmithPix CC-0

feedback by surdumihail CC-0


79

16.3 The uniqueness of the social work perspective on science

Learning Objectives

  • Describe how social workers contribute to social science


I hope that through reading this textbook you understand how science and research support effective and ethical social work practice. As I mentioned in Chapter 1, the question I hear the most in my research methods classes is “when I am going to use this information, as a social worker?” If I’ve done anything right, you can answer that question by now. While it’s important to understand why science is important to a social worker like you, it’s also important that you understand why you are important to science. Social workers, by the nature of their work and their ethical orientation, have a lot of knowledge and expertise to contribute to social science.


crayon drawing of people of different colors arranged in a circle

Social work research is, by its very nature, interdisciplinary. A social worker who wishes to understand how masculinity is impacting her adolescent male clients must become fluent in not only the social work literature on masculinity but also the literature from gender studies, sociology, and psychology. The synthesis of the insights from various social science disciplines, each representing a part of the person-in-environment framework, is a hallmark of strong social work research. Social work has, over time, established a substantial base of empirical and theoretical insights, represented in journals such as Social Work and Social Service Review. But its interdisciplinary roots remain. Given the recent direction in research and practice grant funding towards interdisciplinary projects, this is a significant strength.

Social workers are a pragmatic group. We use what is most useful to us in a given practice situation. This pragmatism also extends to the theories that social workers use. Social work education emphasizes theoretical fluency, or the ability to switch theoretical frames to understand the same situation in different ways. I spend a lot of time around economists, and they are quite wedded to rational choice theory. When an economist examines a public policy problem, their perspectives are based in a rational calculation of costs and benefits by individuals in the action situation—and that’s all. As social workers, we understand that as one of many different theoretical lenses through which to view a given situation. Each theory will lend itself to different testable propositions in quantitative research or jumping-off points for qualitative research. Because of this, social workers can see beyond disciplinary and theoretical blinders to produce a more comprehensive understanding of a phenomenon.

In addition to incorporating multiple theories, social work is an explicitly multi-paradigmatic discipline. It acknowledges not only the methods and assumptions of the positivist paradigm, which is almost universally accepted in all social science disciplines, but also the social constructionist, critical, and postmodern paradigms. Social workers understand the limitations of the positivist paradigm and have created new ways of knowing to respond to the unquantifiable and context-dependent aspects of the human experience. Social workers can challenge social science that is deemed to be “universally true” for all people because it understands the complexity and diversity of human life.

Social work is a values-oriented profession. When social workers examine theories, research, or social problems, they do so with an orientation towards social justice, self-determination, strengths and capacities, and interdependence between all peoples. These values are a strength, as they help social workers interpret and analyze research findings in terms of fighting oppression. At the same time, social work is action-oriented. Not only do social workers think in terms of social change, but they seek to create that change themselves. Social workers always ask the “so what” question. That is, “so what does this mean for my client?”


Key Takeaways

  • Social work contributes to social science through its orientation towards interdisciplinary knowledge, multiple theories and paradigms, and action on behalf of clients.


Image attributions

social media by geralt CC-0


1

Glossary

A-

Abstract– the short paragraph at the beginning of an article that summarizes its main point (3.1)

Accuracy– the extent to which one’s coding procedures correspond to some preexisting standard (14.5)

Acquiescence bias– when respondents say yes to whatever the researcher asks (9.5)

Action research– research that is conducted for the purpose of creating some form of social change in collaboration with stakeholders (15.3)

Aggregate matching– when the comparison group is determined to be similar to the experimental group along important variables (12.2)

Anonymity– when the identity of research participants is not known to researchers (5.2)

Anonymized data– data that does not contain personally identifying information (14.4)

Attributes– the characteristics that make up a variable (9.5)

Authenticity– the degree to which researchers capture the multiple perspectives and values of participants in their study and foster change across participants and systems during their analysis (9.4)

Authority– learning by listening to what people in authority say is true (1.1)


B-

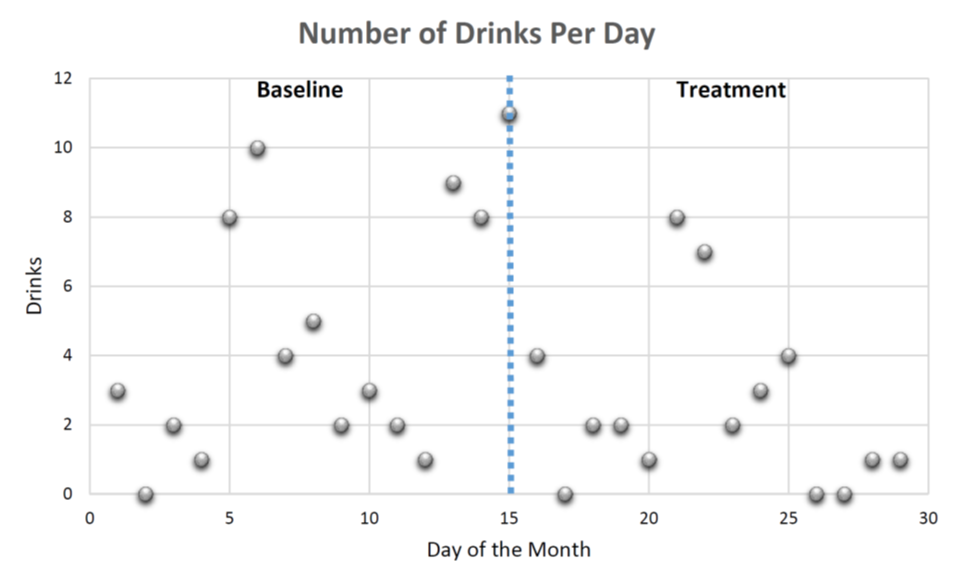
Baseline stage– the period of time before the intervention starts (15.2)

Bias– in sampling, when the elements selected for inclusion in a study do not represent the larger population from which they were drawn due to sampling method or thought processes of the researcher (10.5)

Bivariate analysis– quantitative analysis that examines relationships among two variables (12.4)


C-

Categorical measures– a measure with attributes that are categories (9.5)

Causality– the idea that one event, behavior, or belief will result in the occurrence of another, subsequent event, behavior, or belief (7.2)

Classic experimental design– a type of experimental design that uses random assignment, an experimental and control group, as well as pre- and posttesting (12.1)

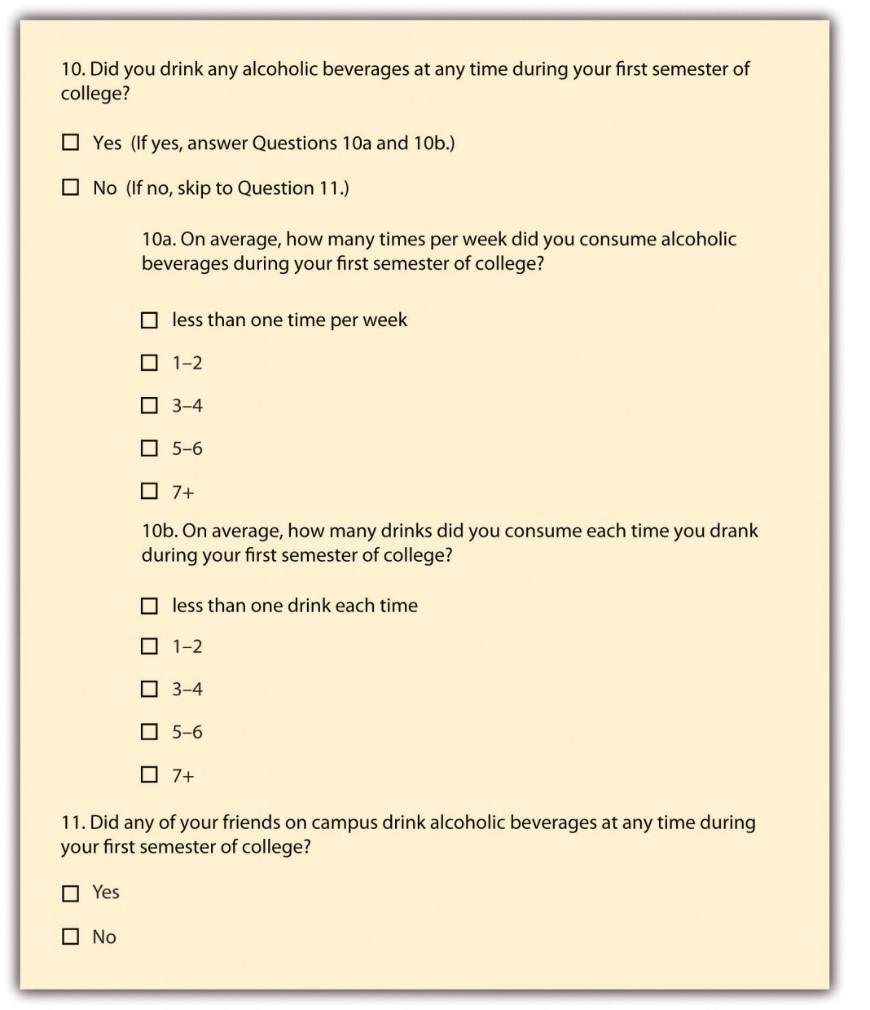
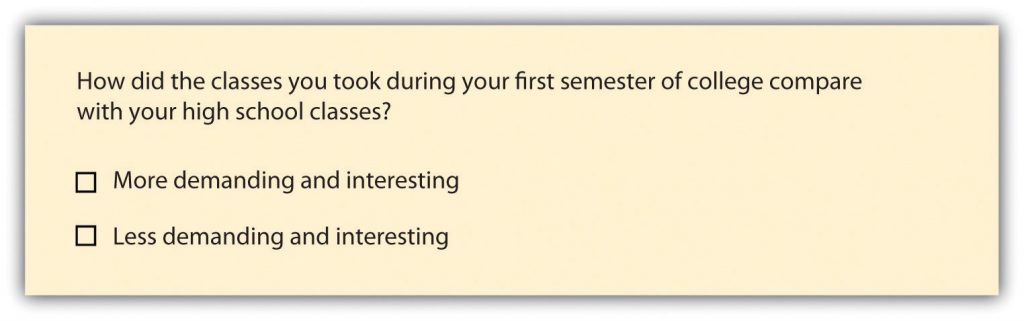
Closed-ended questions– questions for which the researcher offers response options (11.4)

Cluster sampling– a sampling approach that begins by sampling groups (or clusters) of population elements and then selects elements from within those groups (10.3)

Code– a shorthand representation of some more complex set of issues or ideas (13.5)

Code sheet– the instrument an unobtrusive researcher uses to record observations (14.3)

Codebook– a document that outlines how a survey researcher has translated her data from words into numbers (12.4)

Coding– identifying themes across qualitative data by reading transcripts (13.5)

Cognitive biases– predictable flaws in thinking (1.1)

Cohort survey– describes how people with a defining characteristic change over time (11.3)

Comparable groups– groups that are similar across factors important for the study (12.3)

Comparison group– a group in quasi-experimental designs that receives “treatment as usual” instead of no treatment (12.1)

Concept– notion or image that we conjure up when we think of some cluster of related observations or ideas (9.2)

Conceptualization– writing out clear, concise definitions for key concepts, particularly in quantitative research (9.2)

Concurrent validity– if a measure is able to predict outcomes from an established measure given at the same time (9.4)

Confidence interval– a range of values in which the true value is likely to be (3.1)

Confidentiality– when identifying information about research participants is known to the researchers but is not divulged to anyone else (5.2)

Confirmability– the degree to which the results reported are linked to the data obtained from participants (9.4)

Confirmation bias– observing and analyzing information in a way that confirms what you already think is true (1.1)

Constructs– are not observable but can be defined based on observable characteristics (9.1)

Content analysis– a type of unobtrusive research that involves the study of texts and their meaning (14.3)

Content validity– if the measure includes all of the possible meanings of the concept (9.4)

Contingency table– shows how variation on one variable may be contingent on variation on another (12.4)

Continuous measures– a measure with attributes that are numbers (9.5)

Control group– the group in an experiment that does not receive the intervention (12.1)

Control variables– potential “third variables” effects that are controlled for mathematically in the data analysis process to highlight the relationship between the independent and dependent variable (7.2)

Convenience sample– when a researcher gathers data from whatever cases happen to be convenient (10.2)

Convergent validity– if a measure is conceptually similar to an existing measure of the same concept (9.4)

Covariation– the degree to which two variables vary together (7.2)

Credibility– the degree to which the results are accurate and viewed as important and believable by participants (9.4)

Critical paradigm– a paradigm in social science research focused on power, inequality, and social change (6.2)

Cross-sectional surveys– surveys that are administered at just one point in time (11.3)


D-

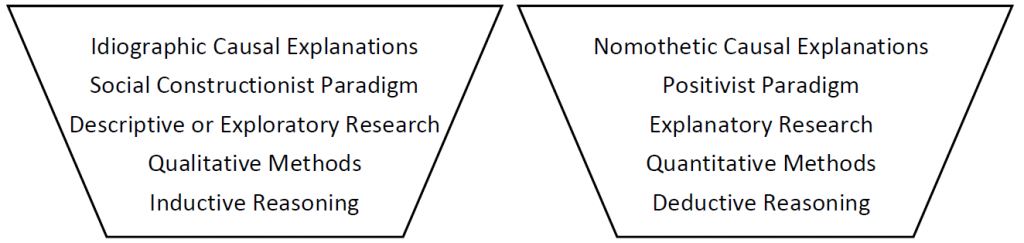
Deductive approach– when a researcher studies what others have done, reads existing theories of whatever phenomenon she is studying, and then tests hypotheses that emerge from those theories (6.3)

Dependability– ensures that proper qualitative procedures were followed during the research process and that any changes that emerged during the research process are accounted for, justified, and described in the final report (9.4)

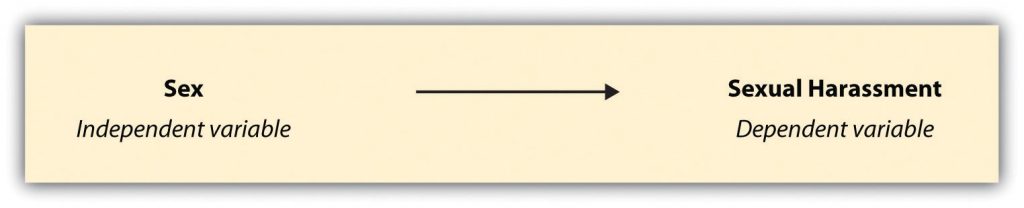
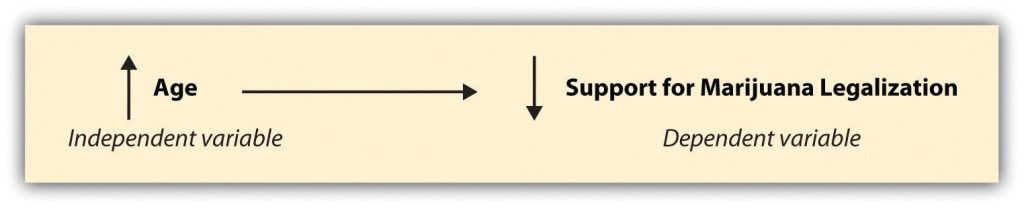
Dependent variable– a variable that depends on changes in the independent variable (7.2)

Descriptive research– research that describes or defines a particular phenomenon (7.1)

Direct experience– learning through informal observation (1.1)

Discriminant validity– if a measure is not related to measures to which it shouldn’t be statistically correlated (9.4)

Dissemination– “a planned process that involves consideration of target audiences and the settings in which research findings are to be received and, where appropriate, communicating and interacting with wider policy and…service audiences in ways that will facilitate research uptake in decision-making processes and practice” (Wilson, Petticrew, Calnan, & Natareth, 2010, p. 91) (16.2)

Double-barreled question– a question that asks two different questions at the same time, making it difficult for a research participant to respond accurately (11.4)

Double-blind– when researchers interact with participants are unaware of who is in the control or experimental group (12.3)

Dunning-Kruger effect– when unskilled people overestimate their ability and knowledge (and experts underestimate their ability and knowledge)


E-

Ecological fallacy– claims about one lower-level unit of analysis are made based on data from some higher-level unit of analysis (7.3)

Emphasis– in a mixed methods study, refers to the priority that each method is given (7.4)

Empirical articles– apply theory to a behavior and reports the results of a quantitative or qualitative data analysis conducted by the author (2.2)

Empirical questions– questions that can be answered by observing experiences in the real world (8.1)

Epistemology– a set of assumptions about how we come to know what is real and true (1.1)

Ethical questions– questions that ask about general moral opinions about a topic and cannot be answered through science (8.1)

Evaluation research– research that evaluates the outcomes of a policy or program (1.3)

Evidence-based practice– making decisions on how to help clients based on the best available evidence (1.3)

Ex post facto control group– a control group created when a researcher matches individuals after the intervention is administered (12.2)

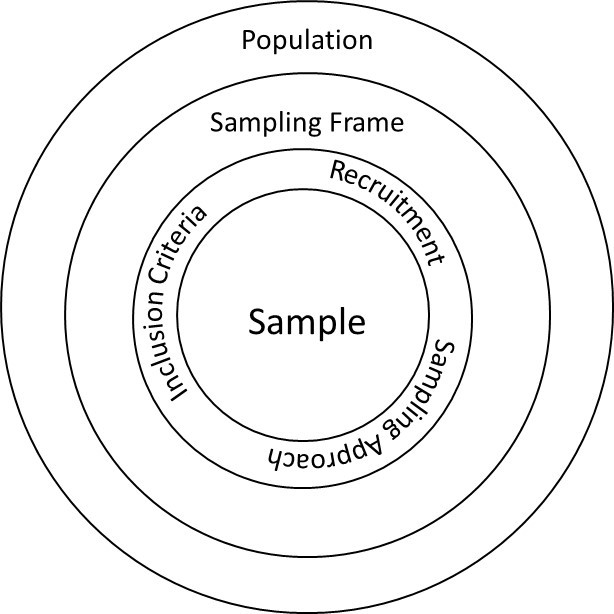
Exclusion criteria– characteristics that disqualify a person from being included in a sample (10.1)

Exempt review– lowest level of IRB review for studies with minimal risk or human subject involvement (5.1)

Exhaustiveness– when all possible attributes are listed (9.5)

Expedited review– middle level of IRB review for studies with minimal risk but greater human subject involvement (5.1)

Experiment– a method of data collection designed to test hypotheses under controlled conditions (12.1)

Experimental group– the group in an experiment that receives the intervention (12.1)

Explanatory research– explains why particular phenomena work in the way that they do; answers “why” questions (7.1)

Exploratory research– conducted during the early stages of a project, usually when a researcher wants to test the feasibility of conducting a more extensive study (7.1)

External validity– the degree to which experimental conclusions generalize to larger populations and different situations (12.3)


F-

Face validity– if it is plausible that the measure measures what it intends to (9.4)

Fairness– the degree to which “different constructions, perspectives, and positions are not only allowed to emerge, but are also seriously considered for merit and worth” (Rodwell, 1998, p. 107) (9.4)

False negative– when a measure does not indicate the presence of a phenomenon, when in reality it is present (9.5)

False positive– when a measure indicates the presence of a phenomenon, when in reality it is not present (9.5)

Fence-sitters– respondents who choose neutral response options, even if they have an opinion (11.4)

Field notes– written notes produced by the researcher during the data collection process (13.2)

Filter question– a question that identifies some subset of survey respondents who are asked additional questions that are not relevant to the entire sample (11.4)

Floaters– respondents that choose a substantive answer to a question when really, they don’t understand the question or don’t have an opinion (11.4)

Focus groups– planned discussions designed to elicit group interaction and “obtain perceptions on a defined area of interest in a permissive, nonthreatening environment” (Krueger & Casey, 2000, p. 5) (13.4)

Focused coding– collapsing or narrowing down codes, defining codes, and recoding each transcript using a final code list (13.5)

Frequency distribution– summarizes the distribution of responses on a single survey question (12.4)

Full board review– highest level of IRB, for studies with greater than minimal risk to participants (5.1)


G-

Generalizability – the idea that a study’s results will tell us something about a group larger than the sample from which the findings were generated (10.3)

Generalize– to make claims about a larger population based on an examination of a smaller sample (7.2)

Gray literature– research and information released by non-commercial publishers, such as government agencies, policy organizations, and think-tanks (2.2)


H-

Hawthorne effect– participants in a study will behave differently because they know they are being observed (14.2)

Historical research– analyzing data from primary sources of historical events and proceedings (14.4)

Hypothesis– a statement describing a researcher’s expectation regarding what she anticipates finding (7.2)


I-

Idiographic research– attempts to explain or describe the phenomenon exhaustively, based on the subjective understandings of the participants (7.2)

Inclusion criteria– the characteristics a person must possess in order to be included in a sample (10.1)

In-depth interviews– interviews in which researchers hear from respondents about what they think is important about the topic at hand in the respondent’s own words (13.2)

Independence– when there is no relationship between the two variables in question (12.4)

Independent variable– a variable that causes a change in the dependent variable (7.2)

Index– a measure that contains several indicators and is used to summarize a more general concept (9.3)

Indicators– represent the concepts that a researcher is interested in studying (9.3)

Indirect observables– things that require indirect observation and inference to measure (9.1)

Individual matching– pairing participants with similar attributes for the purpose of assignment to groups (12.2)

Inductive approach– when a researcher starts with a set of observations and then moves from particular experiences to a more general set of propositions about those experiences (6.3)

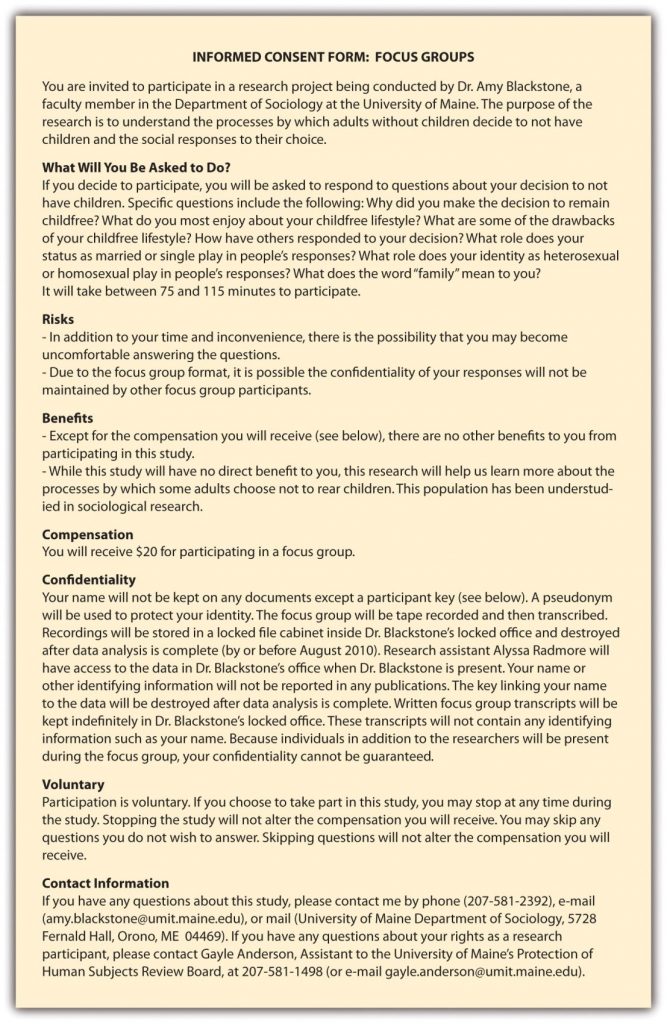
Informed consent– a research subject’s voluntary agreement to participate in a study based on a full understanding of the study and of the possible risks and benefits involved (5.2)

Inputs– resources needed for the program to operate (15.1)

Internal consistency reliability– the degree to which scores on each question of a scale are correlated with each other (9.4)

Internal validity– the confidence researchers have about whether their intervention produced variation in their dependent variable (12.3)

Inter-rater reliability– the degree to which different observers agree on what happened (9.4)

Interval level– a level of measurement that is continuous, can be rank ordered, is exhaustive and mutually exclusive, and for which the distance between attributes is known to be equal (9.5)

Interview guide– a list of topics or questions that the interviewer hopes to cover during the course of an interview (13.2)

Interview schedules– when a researcher poses questions verbally to respondents (11.3)

Interviews– a method of data collection that involves two or more people exchanging information through a series of questions and answers (13.1)

Intuition– your “gut feeling” about what to do


J-

Journaling– making notes of emerging issues and changes during the research process (13.2)


L-

Latent content– the underlying meaning of the surface content (14.3)

Leading question– a question with wording that influences how a participant responds (9.5)

Likert scales– ordinal measures that use numbers as a shorthand (e.g., 1=highly likely, 2=somewhat likely, etc.) to indicate what attribute the person feels describes them best (9.5)

Literature review– a survey of factual or nonfiction books, articles, and other documents published on a particular subject (4.1)

Longitudinal surveys– surveys in which a researcher makes observations over an extended period of time (11.3)


M-

Macro-level– examining social structures and institutions (1.1)

Manifest content– the most apparent and surface-level content in a communication (14.3)

Matrix question– lists a set of questions for which the answer categories are all the same (11.4)

Mean– also known as the average, this is the sum of the value of all responses on a given variable divided by the total number of responses (12.4)

Measurement– the process by which researchers describe and ascribe meaning to the key facts, concepts, or other phenomena they are investigating (9.1)

Median– the value that lies in the middle of a distribution of responses (12.4)

Meso-level– examining interaction between groups (1.1)

Micro-level– examining the smallest levels of interaction, usually individuals (1.1)

Mode– the most common response given to a question (12.4)

Moderator– the researcher tasked with facilitating the conversation in the focus group (13.4)

Multiple treatment design– beginning a new course of treatment or adding a new dimension to an existing treatment (15.2)

Multivariate analysis– quantitative analysis that examines relationships among more than two variables (12.4)

Mutual exclusivity– when a person cannot identify with two different attributes simultaneously (9.5)

Multi-dimensional concepts– concepts that are comprised of multiple elements (9.2)


N-

Natural experiments– situations in which comparable groups are created by differences that already occur in the real world (12.2)

Nominal– a level of measurement that is categorical and for which those categories cannot be mathematically ranked, though they are exhaustive and mutually exclusive (9.5)

Nomothetic research– a type of research that provides a more general, sweeping explanation that is universally true for all people (7.2)

Nonequivalent comparison group design– a quasi-experimental design similar to a classic experimental design but without random assignment (12.2)

Nonprobability sampling– sampling techniques for which a person’s likelihood of being selected for membership in the sample is unknown (10.2)

Nonresponse bias– bias reflected in differences between people who respond to a survey and those who do not respond (12.4)

Null hypothesis– the assumption that no relationship exists between the variables in question (3.1)


O-

Objective truth– a single truth, observed without bias, that is universally applicable

Observational terms– things that can be seen with the naked eye simply by looking at them (9.1)

One-group pre-/posttest design– a type of pre-experimental design that applies an intervention to one group and administers a pretest and posttest (12.2)

One-shot case study– a pre-experimental design that applies an intervention to only one group without a pretest (12.2)

Ontology– a set of assumptions about what is real (1.1)

Open coding– reading through each transcript, line by line, and makes a note of whatever categories or themes seem to jump out (13.5)

Open-ended questions– questions for which the researcher does not include response options (11.4)

Operationalization– a process by which researchers conducting quantitative research spell out precisely how a concept will be measured and how to interpret that measure (9.3)

Oral presentation– a verbal presentation of research findings to a conference audience (16.2)

Ordinal– a level of measurement that is categorical, has categories that can be rank ordered, and those categories are exhaustive and mutually exclusive (9.5)

Outcomes– the issues a researcher is trying to change in her clients (15.1)

Outcomes assessment– an evaluation designed to discover if a program achieved its intended outcomes (15.1)

Outputs– tangible results of the program process (15.1)

Overgeneralization– using limited observations to make assumptions about broad patterns (1.1)


P-

Panel survey– describes how people in a specific group change over time, asking the same people each time the survey is administered (11.3)

Paradigm– a way of viewing the world and a framework from which to understand the human experience (6.2)

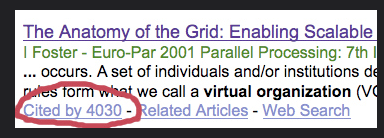
Peer review– a formal process in which other esteemed researchers and experts ensure the work meets the standards and expectations of the professional field (2.2)

Periodicity– the tendency for a pattern to occur at regular intervals (10.3)

Placebo effect– when a participant feels better, despite having received no intervention at all (12.3)

Plagiarism– presenting someone else’s words or ideas as if they are your own (16.2)

Plausibility– in order to make the claim that one event, behavior, or belief causes another, the claim has to make sense (7.2)

Population– the cluster of people about whom a researcher is most interested (10.1)

Positivism– a paradigm guided by the principles of objectivity, knowability, and deductive logic (6.2)

Poster presentation– presentations that use a poster to visually represent the elements of the study (16.2)

Postmodernism– a paradigm focused on the historical and contextual embeddedness of scientific knowledge and a skepticism towards certainty and grand explanations in social science (6.2)

Posttest– a measurement taken after the intervention (12.1)

Posttest-only control group design– a type of experimental design that uses random assignment and an experimental and control group, but does not use a pretest (12.1)

Practical articles– describe “how things are done” in practice (Wallace & Wray, 2016, p. 20) (2.2)

Practice wisdom– “learning by doing” that guides social work intervention and increases over time (1.1)

Predictive validity– if a measure predicts things, it should be able to predict in the future (9.4)

Pre-experimental designs– a variation of experimental design that lacks the rigor of experiments and is often used before a true experiment is conducted (12.2)

Pretest– a measurement taken prior to the intervention (12.1)

Process assessment– an evaluation conducted during the earlier stages of a program or on an ongoing basis (15.1)

Program– the intervention clients receive (15.1)

Primary source– published results of original research studies (2.2)

Probability proportionate to size– in cluster sampling, giving clusters different chances of being selected based on their size so that each element within those clusters has an equal chance of being selected (10.3)

Probability sampling– sampling approaches for which a person’s likelihood of being selected from the sampling frame is known (10.3)

Probe– a request for more information in qualitative research (13.3)

Process assessment– an evaluation conducted during the earlier stages of a program or on an ongoing basis

Purposive sample– when a researcher seeks out participants with specific characteristics (10.2)

P-value– a statistical measure of the probability that there is no relationship between the variables under study (3.1)


Q-

Qualitative methods– examine words or other media to understand their meaning (1.2)

Quantitative methods– examine numerical data to precisely describe and predict elements of the social world (1.2)

Quasi-experimental design– a variation of experimental design that lacks random assignment to experimental and control groups (12.2)

Query– search terms used in a database to find sources (2.3)

Quota sample– when a researcher selects cases from within several different subgroups (10.2)


R-

Random assignment– using a random process to assign people into experimental and control groups (12.1)

Random error– unpredictable error that does not consistently result in scores that are consistently higher or lower on a given measure (9.5)

Random selection– using a randomly generated numbers to determine who from the sampling frame gets recruited into the sample (10.3)

Ratio level– a level of measurement in which attributes are mutually exclusive and exhaustive, attributes can be rank ordered, the distance between attributes is equal, and attributes have a true zero point (9.5)

Recruitment– the process by which the researcher informs potential participants about the study and attempts to get them to participate (10.1)

Reductionism– when claims about some higher-level unit of analysis are made based on data from a lower-level unit of analysis (7.3)

Reification– assuming that abstract concepts exist in some concrete, tangible way (9.2)

Reliability– a measure’s consistency (9.4)

Replication– conducting another researcher’s experiment in the same manner and seeing if it produces the same results (12.3)

Representative sample– a sample that resembles the population from which it was drawn in all the ways that are important for the research being conducted (10.3)

Reproducibility– the extent to which a researcher’s coding procedures will result in the same results when the same text is coded by different people (14.5)

Research methods– an organized, logical way of knowing based on theory and observation (1.1)

Response rate– the number of people who respond to a survey divided by the number of people to whom the survey was distributed (12.4)

Retrospective surveys– a type of survey that describes changes over time but are administered only once (11.3)

Roundtable presentation– presentations designed to stimulate discussion on a topic (16.2)


S-

Sample– the group of people who are successfully recruited from the sampling frame to participate in a study (10.1)

Sampling error– a statistical calculation of the difference between results from a sample and the actual parameters of a population (10.3)

Sampling frame– a real or hypothetical list of people from which a researcher will draw her sample (10.1)

Scale– a composite measure designed in a way that accounts for the possibility that different items on an index may vary in intensity (9.3)

Science– a particular way of knowing that attempts to systematically collect and categorize facts or knowledge (1.2)

Secondary data analysis– analyzing data originally gathered by another person or entity (14.4)

Secondary sources– interpret, discuss, and summarize original sources (2.2)

Selection bias– when a researcher consciously or unconsciously influences assignment into experimental and control groups (12.3)

Self-administered questionnaires– when a research participant is given a set of questions, in writing, to which they are asked to respond (11.3)

Semi-structured interviews– questions that are open ended and may not be asked in exactly the same way or in exactly the same order to each and every respondent (13.2)

Seminal articles– classic works noted for their contribution to the field and high citation count (2.2)

Sequence– in a mixed methods study, refers to the order that each method is used, either concurrently or sequentially (7.4)

Signposting– words that identify the organization and structure of a literature review (4.3)

Simple random sampling– selecting elements from a list using randomly generated numbers (10.3)

Snowball sample– when a researcher relies on participant referrals to recruit new participants (10.2)

Social constructionism– a paradigm based on the idea that social context and interaction frame our realities (6.2)

Social desirability bias– when respondents answer based on what they think other people would like, rather than what is true (9.5)

Solomon four-group design– a type of experimental design that uses random assignment, two experimental and two control groups, pretests for half of the groups, and posttests for all (12.1)

Spurious relationship– when an association between two variables appears to be causal but can in fact be explained by some third variable (7.2)

Stability– the extent to which the results of coding vary across different time periods (14.5)

Stakeholders– individuals or groups who have an interest in the outcome of the study a researcher conducts (8.5)

Static group design– uses an experimental group and a comparison group, without random assignment and pretesting (12.2)

Statistical significance– the likelihood that the relationships that are observed could be caused by something other than chance (3.1)

Strata– the characteristic by which the sample is divided (10.3)

Stratified sampling– dividing the study population into relevant subgroups and then drawing a sample from each subgroup (10.3)

Subjective truth– one truth among many, bound within a social and cultural context

Survey research– a quantitative method whereby a researcher poses some set of predetermined questions to a sample (11.1)

Systematic error– when measures consistently output incorrect data, usually in one direction and due to an identifiable process (9.5)

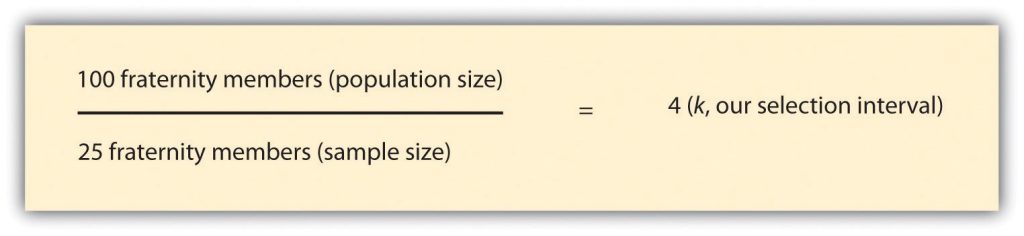
Systematic sampling– selecting every kth element from a list (10.3)


T-

Table– a quick, condensed summary of the report’s key findings (3.1)

Target population– a group of people whose needs your study addresses (8.2)

Temporality– whatever cause a researcher identifies must happen before the effect (7.2)

Tertiary sources– synthesize or distill primary and secondary sources, such as Wikipedia (2.2)

Testing effects– when a participant’s scores on a measure change because they have already been exposed to it (12.1)

Test-retest reliability– if a measure is given multiple times, the results will be consistent each time (9.4)

Theoretical articles– articles that discuss a theory, conceptual model, or framework for understanding a problem (2.2)

Theory– “a systematic set of interrelated statements intended to explain some aspect of social life” (Rubin & Babbie, 2017, p. 615) (6.2)

Theory building– the creation of new theories based on inductive reasoning (7.2)

Theory testing– when a hypothesis is created from existing theory and tested mathematically (7.2)

Time series design– a quasi-experimental design that uses multiple observations before and after an intervention (12.2)

Transcript– a complete, written copy of the recorded interview or focus group containing each word that is spoken on the recording, noting who spoke which words (13.5)

Treatment stage– the time in which the treatment is administered by the social worker (15.2)

Trend– a pattern in the data of a single-subjects design (15.2)

Trend survey– describes how people in a specific group change over time, asking different people each time the survey is administered (11.3)

True experiments– a group of experimental designs that contain independent and dependent variables, pretesting and post testing, and experimental and control groups (12.1)

Trustworthiness– the “truth value, applicability, consistency, and neutrality” of the results of a research study (Rodwell, 1998, p. 96) (9.4)

Typology– a measure that categorizes concepts according to particular themes (9.3)


U-

Unit of analysis– an entity that a researcher wants to say something about at the end of her study (7.3)

Unit of observation– the item that a researcher actually observes, measures, or collects in the course of trying to learn something about her unit of analysis (7.3)

Univariate analysis– quantitative analysis that describes patterns across just one variable (12.4)

Unobtrusive research– methods of collecting data that don’t interfere with the subjects under study (14.1)


V-

Validity– a measure’s accuracy (9.4)

Variable– refers to a grouping of several characteristics (9.5)

Vulnerable populations– groups of people who receive additional protection during IRB review (5.1)


2

Practice behavior index

 Educational Policy and Accreditation Standards Chapters Referenced
Competency 1- Demonstrate Ethical and Professional Behavior:  
a. Make ethical decisions by applying the standards of the NASW Code of Ethics, relevant laws and regulations, models for ethical decision-making, ethical conduct of research, and additional codes of ethics as appropriate to context 1, 5
b. Use reflection and self-regulation to manage personal values and maintain professionalism in practice situations
c. Demonstrate professional demeanor in behavior; appearance; and oral, written, and electronic communication
d. Use technology ethically and appropriately to facilitate practice outcomes 1, 15
e. Use supervision and consultation to guide professional judgment and behavior
Competency 2- Engage Diversity and Difference in Practice:  
a. Apply and communicate understanding of the importance of diversity and difference in shaping life experiences in practice at the micro, mezzo, and macro levels 5
b. Present themselves as learners and engage clients and constituencies as experts of their own experiences 1, 15
c. Apply self-awareness and self-regulation to manage the influence of personal biases and values in working with diverse clients and constituencies
Competency 3- Advance Human Rights and Social, Economic, and Environmental Justice:  
a. Apply their understanding of social, economic, and environmental justice to advocate for human rights at the individual and system levels 1, 2, 5, 15, 16
b. Engage in practices that advance social, economic, and environmental justice 1, 5, 15, 16
Competency 4- Engage in Practice-informed Research and Research-informed Practice:  
a. Use practice experience and theory to inform scientific inquiry and research 1, 2, 6, 15
b. Apply critical thinking to engage in analysis of quantitative and qualitative research methods and research findings 1, 2, 3, 4, 5, 6, 7, 8, 9, 10, 11, 12, 13, 14, 15, 16
c. Use and translate research evidence to inform and improve practice, policy, and service delivery 1, 2, 3, 4, 5, 6, 7, 8, 9, 10, 11, 12, 13, 14, 15, 16
Competency 5- Engage in Policy Practice:  
a. Identify social policy at the local, state, and federal level that impacts well-being, service delivery, and access to social services
b. Assess how social welfare and economic policies impact the delivery of and access to social services 12, 15, 16
c. Apply critical thinking to analyze, formulate, and advocate for policies that advance human rights and social, economic, and environmental justice
Competency 6-Engage with Individuals, Families, Groups, Organizations, and Communities:  
a. Apply knowledge of human behavior and the social environment, person-in-environment, and other multidisciplinary theoretical frameworks to engage with clients and constituencies 6
b. Use empathy, reflection, and interpersonal skills to effectively engage diverse clients and constituencies
Competency 7- Assess Individuals, Families, Groups, Organizations, and Communities:  
a. Collect and analyze data, and apply critical thinking to interpret information from clients and constituencies 1, 2, 5, 6, 7, 8, 9, 10, 11, 12, 13, 14, 15
b. Apply knowledge of human behavior and the social environment, person-in-environment, and other multidisciplinary theoretical frameworks in the analysis of assessment data from clients and constituencies 6, 7, 9, 12
c. Develop mutually agreed-on intervention goals and objectives based on the critical assessment of strengths, needs, and challenges within clients and constituencies
d. Select appropriate intervention strategies based on the assessment, research knowledge, and values and preferences of clients and constituencies 1, 2, 3, 4, 15
Competency 8- Intervene with Individuals, Families, Groups, Organizations, and Communities:  
a. Critically choose and implement interventions to achieve practice goals and enhance capacities of clients and constituencies 1, 15
b. Apply knowledge of human behavior and the social environment, person-in-environment, and other multidisciplinary theoretical frameworks in interventions with clients and constituencies 1, 15
c. Use inter-professional collaboration as appropriate to achieve beneficial practice outcomes
d. Negotiate, mediate, and advocate with and on behalf of diverse clients and constituencies
e. Facilitate effective transitions and endings that advance mutually agreed-on goals
Competency 9- Evaluate Practice with Individuals, Families, Groups, Organizations, and Communities:  
a. Select and use appropriate methods for evaluation of outcomes 1, 2, 3, 5, 6, 7, 8, 9, 10, 11, 12, 13, 14, 15, 16
b. Apply knowledge of human behavior and the social environment, person-in-environment, and other multidisciplinary theoretical frameworks in the evaluation of outcomes 1, 2, 3, 6, 9, 15
c. Critically analyze, monitor, and evaluate intervention and program processes and outcomes 1, 2, 5, 6, 7, 8, 9, 10, 11, 12, 13, 14, 15, 16
d. Apply evaluation findings to improve practice effectiveness at the micro, mezzo, and macro levels 1, 12, 15, 16


3

Attributions index

This open textbook was based on two open textbooks, Principles of Sociological Inquiry: Qualitative and Quantitative Methods by Dr. Amy Blackstone and Literature Reviews for Education and Nursing Graduate Students by Dr. Linda Frederiksen and Dr. Sue F. Phelps. Licensing information can be found in the front matter. The following index details where content from each source textbook was used in this manuscript.  New content (as noted below) indicates major additions, such as chapters, sections, subsections, or key concepts that I created.

In all chapters, examples, definitions, and descriptions of concepts were changed to better reflect the social work discipline.  This entailed a substantial revision of the content adapted from both source textbooks.  These revisions are not noted below, as they are too numerous.

Other minor revisions not noted below include editing language for clarity, length, and flow as well as corrections to hyperlinks and citations.  Exercises from both textbooks were not included in this textbook.  This book includes a glossary and practice behavior index not present in either source textbook.