Crafting Research Narratives that Transcend Technical Jargon

Crafting Research Narratives that Transcend Technical Jargon

An Enhanced Self-Guided Journey to Mastering Your Thesis

Sevda Montakhaby

Contents

1

Introduction - Embarking on Your Research Adventure

Hello fellow researchers,

Welcome to a journey that promises to be as enlightening as it is rewarding. Whether you’re a fresh-faced undergraduate taking your first steps into the world of research or a seasoned graduate student with a few academic battles under your belt, this 10-week self-paced guide is your companion through the labyrinth of academic inquiry.

Now, I sympathize, at first glance, the idea of diving into this seemingly endless sea of data and theories can be a tad overwhelming. But I’m here to tell you that it’s not just a checkbox on your academic to-do list; it’s an adventure waiting to unfold.

Embarking on a research journey can feel like setting out on a road trip without a GPS guide. Don’t worry; we’ve all been there. This self-paced course is designed to be your reliable navigator, your Google Maps, Apple Maps, or perhaps even Waze, there to gently steer you through the complexities of research by charting the most effective route. As a seasoned researcher myself, I am committed to sharing with you all the valuable insights I’ve accumulated over the years. These range from my initial beginnings in research in the second year of my undergraduate journey to my current position as a Ph.D. student.

This course is crafted to serve as your dependable navigator, akin to Google Maps, Apple Maps, or perhaps even Waze, guiding you smoothly through the complexities of research by charting the most effective route. Drawing on my extensive experience as a researcher, I am committed to imparting the valuable insights I’ve accumulated over the years. These range from my initial forays into research during my sophomore year of undergraduate studies to my present role as a Ph.D. student.


Nurturing Accountability and Productivity

Let’s face it—conducting research is not for the faint of heart. It’s a thrilling yet daunting task that often leaves us staring at a mountain of information, wondering where to begin. This guide aims to inject a bit of structure into the chaos, offering insights and tips to keep you accountable and productive, because let’s be honest, we could all use a nudge in the right direction.


A Note to the Overwhelmed

If you’re feeling overwhelmed right now, take a deep breath. You’re not alone in this, and that’s the beauty of this guide. Consider it a virtual hand on your shoulder, here to remind you that research, no matter how intricate, is a journey to be savoured, not a maze to get lost in. Let’s Make Research a Bit More Approachable, Shall We?

So, buckle up for the next 10 weeks. We’re going to dive into the world of research together, armed with tips, tricks, and a touch of humour to lighten the load. Ready to turn this potentially overwhelming journey into a rewarding experience?

Let’s get started!

2

Disclaimer: Acknowledging Individuality in Thesis Work

While this guide has been meticulously designed to provide invaluable guidance and structure for your research and writing journey, it’s crucial to acknowledge the inherent diversity in projects and academic advisory relationships. Each academic advisor may hold specific expectations, requirements, or methodologies that differ from the guidelines provided here.

This guide is not a one-size-fits-all solution; rather, it serves as a foundational resource to facilitate productive dialogues with your academic advisor or principal investigator (PI). Its purpose is to equip you with the essential tools, skills, and strategies to initiate your thesis writing process, enabling you to align your work seamlessly with your advisor’s expectations and your academic goals.

Throughout this journey, anticipate gaining insights and resources that will empower you to adapt and customize your writing process to suit the unique characteristics of your project and research context. Collaboration and effective communication with your PI are pivotal in ensuring a successful research experience. Therefore, as you progress through this guide, bear in mind that flexibility and open discussion with your PI will be paramount in shaping your path toward a successful research career.


How to Utilize This Guide for Maximum Benefit

It’s important to recognize that the timeline presented in this guide is intentionally condensed to provide a structured framework. However, it’s essential to understand that this may not align perfectly with your circumstances or project requirements. Avoid placing undue pressure on yourself to meet these proposed deadlines if they don’t fit your situation. Here’s how you can adapt the guide to your needs for maximum benefit:

  1. Flexibility in Application: View the weekly exercises more as a series of steps rather than strict weekly commitments. This perspective allows you to progress at a pace that suits your unique situation and needs.
  2. Customizing Your Timeline: If certain phases of your thesis require more time – for example if data collection takes 3-4 months to complete instead of the two weeks outlined here – adjust your timeline accordingly. Recognize that research often involves unexpected complexities that may require additional time.
  3. Institutional Deadlines: Always prioritize and be aware of the deadlines your institution and thesis supervisor set. These are critical benchmarks that you must adhere to.
  4. Stress Management: Remember, the ultimate goal is the successful completion of your thesis, not rigid adherence to a predefined schedule. Prioritize your well-being and avoid unnecessary stress from timelines that may not be feasible.
  5. Seeking Feedback and Support: Don’t hesitate to seek feedback from peers or mentors about your adjusted timeline. Sometimes, an external perspective can offer valuable insights and suggestions for efficient time management.

By treating the guide as a flexible resource and tailoring it to fit your specific research journey, you can maintain a balanced and productive approach to your thesis project. Remember, the key is to find a rhythm that works for you and allows you to conduct thorough and meaningful research.

3

Understanding Thesis Work: An Introduction to Academic Research & Writing

In the next section of this week’s module, we will briefly go over what you may expect from a thesis project and what some of the fundamentals

Introduction to Academic Research and Writing
Gain an understanding of the fundamentals of academic research and writing, setting the stage for your thesis work.

What is Academic Research?: Explore the purpose and approach of academic research.
The Thesis Project: Get an overview of what a thesis entails and the various types involved.
The Research and Writing Process: Learn about the stages you’ll go through, from research to writing to revision.
What Happens in a Thesis Project
Understanding the overall flow and common challenges of a thesis project will help you anticipate and navigate the journey ahead.

Stages of a Thesis: Learn about each phase, from topic selection to defense.
Typical Challenges: Gain insight into common hurdles and how to overcome them.
The End Goal: Keep in mind the significance of your thesis in your academic and professional development.
Conclusion
As you start this exciting chapter, remember that understanding your supervisor’s responsibilities and adopting a proactive stance will set the foundation for a successful and rewarding thesis experience. By taking the initiative, you ensure that your journey is not just guided but also enriched by your own active engagement and dedication. Welcome to your first week, where your journey of inquiry, discovery, and academic achievement begins!


4

The Thesis Timeline

When working on a thesis, it’s crucial to establish and adhere to specific timelines to ensure a smooth and timely completion. Here are some important timelines to consider during the thesis process:

1. Topic Selection and Proposal Submission:

2. Literature Review Completion:

3. Research Methodology Approval:

4. Data Collection:

5. Data Analysis:

6. Writing the First Draft:

7. Revision and Feedback:

8. Preparation for Defense:

9. Final Submission:

10. Post-Submission Revisions (if applicable):

   – Timeline: Immediately after the thesis defence, as specified by the examination committee.
   – Considerations: Make any required changes or improvements to your thesis manuscript as suggested during the defence or by the examiners.

General Tips:

By considering these timelines and planning accordingly, you can navigate your thesis process more effectively, ensuring a well-conducted study and a timely completion.

5

The Multifaceted Significance of Thesis Projects - A Dual Perspective

As a first-year Ph.D. student in Cognitive Psychology, I often find myself reflecting on my academic journey thus far. The pivotal moments of completing thesis projects during both my undergraduate and graduate studies have left an enduring mark on me. These weren’t just boxes to check off on my academic to-do list; they were transformative experiences that shaped my understanding, skills, and vision for the future.

As a first-year undergrad in general life sciences, I was steadfast in my decision to major in chemistry by my second year, given that it was my favourite subject in high school. My long-term aspiration was to complete a co-op program at a chemical or pharmaceutical company in the final years of my undergrad, preferably a cosmetic company, and enter the workforce after graduation. However, my required psychology courses piqued my interest more, and after becoming involved in several labs in my undergrad, including a biology lab, a neuroscience lab, and a cognitive psychology lab, where I ended up completing my undergrad thesis, master’s, and now doctoral studies. I found myself pursuing a career in academia. I found my undergraduate and graduate thesis projects rewarding, and I loved learning the technical skills required to become an independent researcher.

All that is to say, my thesis projects transformed my career aspirations and the trajectory of my life. I advocate for all students to embark on this journey, not only for those eyeing a future in academia but also for anyone aiming to enter the industry armed with a broad array of skills that are highly coveted by employers. In this chapter, I aim to explore the comprehensive significance of thesis projects, drawing not only from my journey but also considering the wider impact on students at varying academic junctures.

Cultivating Curiosity

As children, it is in our nature to be curious. To venture out into the world and discover a world of our own. Guided by our parents and loved ones, we embark on a grand project of discovery, feeding our imaginations with endless questions about the world and everything in it. However, with age, this innate curiosity often diminishes, gradually overshadowed by societal expectations and other obligations. However, the realm of research offers a unique opportunity to rekindle this dormant curiosity. It invites you to delve into any topic that sparks your interest, to learn, speculate, and uncover new truths.

For me, my thesis was far more than a degree requirement; it was a journey that reignited a deep-seated curiosity about the human mind. It was an opportunity to delve into the mysteries of cognitive psychology, exploring complex questions and contributing to the broader conversation of understanding.

In essence, academic research is more than just an assignment; it’s a venture back into the innate curiosity we all had as children. It’s an opportunity to challenge yourself, to learn, to question, and ultimately, to grow not just as a student but as a thinker and innovator. It’s a journey that prepares you not only for the academic challenges of a thesis but for a lifetime of inquiry and discovery.

So, as you begin your thesis journey, I encourage you to embrace this opportunity. Dare to be curious. Allow yourself to be drawn to the topics that fascinate you, to learn deeply about them, and to discover new facets of the world and yourself. This is not just an academic endeavour; it’s a personal quest, a chance to reconnect with the wonder that once defined your view of the world. Your thesis can be more than a requirement; it can be a renewal, a rediscovery, and a remarkable journey of intellectual and personal growth.

Advancing Knowledge & Expertise: Breaking the Mold of Traditional Learning

Academic research, particularly at the undergraduate level, offers a dynamic extension to traditional classroom education. While lectures and textbooks lay the essential groundwork for understanding, it’s the hands-on, experiential learning through research that truly animates these theoretical concepts. Engaging in research projects means witnessing firsthand the practical application of knowledge, elevating your comprehension and appreciation of the subject matter.

Incorporating research methodologies and the hypothesis-driven process into your academic journey does more than build upon the foundation laid by your coursework. It cultivates independent critical thinking skills and enhances both oral and written communication abilities. As you delve into research, you develop the confidence to formulate and defend your conclusions based on evidence. Over time, you’ll not only understand the rationale behind other researchers’ studies, including their methodologies and outcomes, but you might also find yourself contemplating follow-up experiments.

For instance, it’s a universally shared experience: nearly all of us, at some point in our high school or even middle school years, have been introduced to the scientific method. These fundamental steps of research are often presented to us repeatedly, in various formats and fonts on our instructors’ slides. However, I firmly believe that one can never fully comprehend the depth and nuances of the scientific method until they’ve navigated its complexities firsthand. Engaging in your undergraduate thesis offers this exact opportunity. My undergraduate thesis was my first genuine venture into the realm of independent research — a truthfully daunting yet thrilling endeavour. It was during this time that I truly began to understand the art of hypothesis formulation and the rigorous, detailed nature of empirical research. This experience isn’t just about understanding the scientific method; it’s about living it.

Leave it to researchers to research the benefits of doing research. A loaded sentence I know, but empirical evidence supports the positive impact of undergraduate research on classroom learning. For instance, students who pursued research within their academic department reported significant enhancements in their independence, motivation, and engagement (Lopatto, 2007). They also noted a heightened capacity for independent thought and generating original ideas. Furthermore, some academic departments mandate an independent research project or senior thesis. This represents an original and self-reliant research endeavour aiming to synthesize the knowledge acquired within your major into a formal academic article.

Thesis Project: Your Golden Ticket to Mentorship Par Excellence

Engaging with professors is one of the most significant benefits of undertaking a research project. These individuals, who have navigated the very paths we tread, offer an invaluable resource, a well of wisdom from which we can draw. Through research, you’re granted the golden opportunity to form one-on-one bonds with these mentors, relationships that can shape your academic journey and beyond.

These seasoned academics become much more than just instructors; they are guides, advisors, and sometimes even lifelong contacts. They impart not only domain-specific knowledge but also the subtler, yet crucial, principles of research ethics, tenacity, and intellectual rigor. They teach you how to question, how to think critically, and how to persist when the research becomes challenging. Their guidance is not just about helping you navigate your current project; it’s about instilling a mindset, a way of thinking and approaching problems that will serve you well throughout your career.

Moreover, these mentorship relationships often go beyond the academic realm. Professors can provide insights into the world of academia and beyond, offering advice on career paths, networking, and life after university. They can open doors, recommend you for opportunities, introduce you to colleagues, and endorse your capabilities. Their support can be a pivotal factor in your academic and professional development.

But remember, mentorship is a reciprocal relationship. It’s not just about what you can learn from them, but also about what your fresh perspective and enthusiasm bring to the table. Your work can contribute new ideas and energy to their research, creating a dynamic partnership where both mentor and mentee benefit and grow. This symbiotic relationship forms the bedrock of undergraduate and graduate research, creating a vibrant academic community fueled by shared curiosity and the pursuit of knowledge. Engaging deeply with your professors and mentors is not just an opportunity; it’s a privilege that can transform your academic experience, opening up new horizons and laying the foundations for a future rich with potential.

Harnessing Mentorship: The Power of Personalized Recommendations

Professors and mentors, especially those who have collaborated closely with you during your research, are arguably the best sources for personalized and detailed recommendations. Their close working relationship with you means they have witnessed your academic journey first-hand. They can vouch for your specific contributions, accomplishments, and personal growth with an authenticity and depth that others simply cannot match.

These tailored recommendations hold significant weight. When a professor speaks to your unique qualities, dedication, and the specific ways you’ve contributed to a research project, it paints a vivid, compelling picture of your capabilities and potential. It’s one thing for a reference letter to say you’re diligent and intelligent; it’s another entirely for it to detail how you problem-solved under pressure, innovated research methods, or contributed original ideas that significantly impacted the project’s outcome.

Furthermore, these mentors can reflect on your journey, highlighting not just where you excelled but also where you faced challenges and grew as a result. This narrative of growth is incredibly powerful, illustrating your resilience, adaptability, and commitment to continuous learning. Such insights make your reference letters not just summaries of your past achievements but also endorsements of your future potential.

In essence, the recommendations from professors and mentors who have worked closely with you are more than just letters; they are testaments to your character, intellect, and potential. They provide a nuanced, comprehensive view of your capabilities and experiences, making your applications for further study, scholarships, or jobs markedly more compelling and distinctive. These are the endorsements that can set you apart in a sea of candidates, opening doors to new opportunities and paving the way for continued success.

The Social Network: Making Connections

Extending from the individual mentorship provided by professors, research inherently fosters a culture of collaboration. As a researcher, you’re not just working in isolation; you’re becoming part of a vibrant, interconnected lab community. You will forge connections with fellow students, graduate students, and experts in your field, each relationship offering its unique value and perspective.

Participating in research provides a platform for active engagement with a broader academic community. You’ll have the opportunity to attend lab meetings, departmental research symposiums, conferences, and workshops, where you can present your findings and engage in dialogue with like-minded individuals from diverse universities and disciplines. These events are not just about showcasing your work; they’re about immersion in a communal pool of knowledge, ideas, and inspiration. The conversations you have and the contacts you make can spark new ideas, lead to collaborative projects, or even reshape the direction of your research.

For example, in 2022, I was privileged to attend a conference in Halifax, where I presented my research. This conference wasn’t just an academic forum; it was a vibrant meeting ground that allowed me to connect with fellow researchers from various institutions across Canada, many of whom were delving into the same areas of interest as me. It was an invigorating experience, made even more remarkable by Halifax’s stunning scenery and the memorable bonding moments shared with my peers. These interactions not only broadened my academic network but also enriched my understanding and enthusiasm for my field, making it an unforgettable part of my research journey.

Moreover, the well-established networks of your professor can unlock doors to opportunities that might otherwise remain closed. Take, for example, my supervisor’s enduring collaboration with researchers in Spain. This partnership has fostered an exchange program, allowing students from his colleagues’ lab to visit ours in Canada, and conversely, offering us the chance to study abroad in Spain. This isn’t just about swapping locations; it’s a reciprocal cultural and academic exchange. Recently, a colleague from our lab seized this opportunity, spending several months in Spain conducting his research. During this time, he didn’t just advance academically; he also deeply immersed himself in a new culture, an experience that enriched his personal and professional growth in unparalleled ways.

In essence, the collaborative nature of research doesn’t just enrich your current project; it opens doors to a world of possibilities. Each connection is a seed that, with nurturing, can grow into opportunities for internships, job offers, and future research collaborations. They represent the beginnings of your professional network, a web of contacts that can provide support, advice, and opportunities throughout your career. Engaging actively and positively with this community, you’re not just building a network; you’re joining a dynamic, global community of scholars and professionals.

From Curiosity to Career: Thesis Studies as the Gateway to Graduate School

Participating in thesis research is not just an academic exercise; it’s a strategic move in career planning and a prelude to potential graduate studies. This was certainly the case for me. From undergraduate studies to a master’s, and now to doctoral studies, and hopefully soon to a faculty position and my own lab! As you immerse yourself in research within a field that captures your imagination, you might find your academic and career path becoming clearer. This initial foray into research can ignite a passion so profound that it reshapes your academic focus, leading you to major or minor in that area. It’s a process of self-discovery, where the subject you research might just become the subject you dedicate your life to.

Furthermore, for those considering graduate studies, thesis work serves as an invaluable stepping stone. It’s a taste of what graduate studies has in store for you. Engaging in research early in your academic journey provides you with a robust foundation in research methodologies, literature reviews, and scholarly writing. These skills are not just prerequisites for graduate studies; they are the tools that will enable you to excel.

Graduate programs often regard research experience as a testament to a candidate’s potential. By starting your research journey early, you’re not just building a portfolio; you’re enhancing your proficiency and shaping yourself into a promising candidate for advanced studies. Your early and sustained engagement in research sets you apart, showcasing your commitment and evolving expertise, thereby boosting your prospects of thriving as a researcher in the future.

However, it’s crucial to approach the decision to pursue graduate studies with deliberate consideration. Unfortunately, some undergraduates, unsure of their post-graduation path, view graduate school as the default next step, a perspective that can lead to misaligned expectations and dissatisfaction (Madan & Teitge, 2013). This is where the true value of early research experience comes to light. By engaging in research during your undergraduate years, you gain firsthand insight into the world of academic inquiry. This experience provides a clearer picture of what graduate studies entail, helping you make an informed decision about whether this path aligns with your personal and professional goals.

In essence, undergraduate research is more than just an academic endeavour; it’s a formative experience that can significantly influence your career trajectory. It helps you discover your passions, prepares you for the rigours of graduate studies, and ensures that any decision to pursue further education is well-informed and aligned with your long-term aspirations. It’s an opportunity to explore, to grow, and to set the stage for a future rich with academic and professional achievements.

The Research Résumé: Crafting a Career from Curiosity

Speaking of career planning. Thesis research can significantly enhance your resume, adding a distinctive flair that sets you apart. Prospective employers and graduate programs highly value candidates with research experience. This experience doesn’t just signify that you’ve spent time in a lab or poring over data; it indicates a range of competencies and qualities that are highly sought after in the professional world.

When employers and academic selection committees see research experience on your CV, they see a candidate who has engaged deeply with complex problems and who possesses the persistence and creativity to overcome them. They see someone who has been exposed to critical thinking, analytical skills, and meticulous attention to detail. They recognize an individual who understands the value of evidence-based decision-making, a crucial skill in virtually any field.

Moreover, research experience implies that you’re a self-starter, someone who’s motivated and capable of independent work. It suggests that you’re not just a passive learner but an active seeker of knowledge, ready to take on the challenges that lie ahead. Your research background tells a story of a person who’s prepared to ask questions, seek answers, and contribute meaningfully to their field. It positions you as a candidate who’s ready to hit the ground running, bringing a rich set of skills and experiences to any role or academic program.

In short, your participation in research is more than just a line on your resume; it’s a testament to your capacity to tackle complex challenges, learn and grow from your experiences, and contribute effectively in your chosen field. It’s a powerful endorsement of your potential as both a professional and a scholar, setting the stage for a career rich with opportunities and achievements. We will elaborate further on some of the transferrable skills you may learn from conducting thesis research in the following chapter.

A Launchpad into Scholarship: Recognizing and Fostering talent

Embarking on a research journey can be more than just an intellectually rewarding experience; it often comes with financial incentives that can significantly support your academic endeavours. Many research opportunities are accompanied by scholarships, stipends, or even paid positions. These financial acknowledgments do more than just ease the monetary burden; they serve as a testament to your dedication and hard work. Receiving a scholarship or stipend is a recognition of your potential and commitment to contributing valuable insights to your field. It’s a nod from the academic community, affirming that your research is not only worthwhile but also deserving of support. Such financial backing enables you to focus more intently on your research, free from the distractions of financial concerns. This support can be instrumental in allowing you to delve deeper into your work, access better resources, and possibly travel for conferences or fieldwork, enriching your academic journey. In essence, these financial incentives are not just about the monetary benefit; they’re about recognizing and fostering talent, supporting scholarly pursuits, and encouraging a deeper engagement with research.

Character Crucible

One aspect of research that seasoned veterans understand intimately, yet often eludes newcomers, is the sheer number of challenges. Experiments might not go as planned, data can be confusing, and setbacks might test your endurance. It’s easy to view these obstacles as purely negative, but in reality, they’re invaluable opportunities for growth. Each hurdle you encounter and overcome in the lab or while poring over data is quietly shaping you into a more resilient, adaptable, and growth-oriented individual.

This process of facing and overcoming challenges is not just about getting through your thesis project; it’s a form of intense personal development. As you navigate these trials, you’re not only advancing your academic understanding but also cultivating a set of skills and attitudes that are incredibly valuable in any context. Resilience, the ability to bounce back from setbacks, is crucial in all areas of life, from personal relationships to professional endeavours. Adaptability, the capacity to adjust your approach when faced with new information or unexpected situations, is a trait highly prized in today’s ever-changing world. And a growth-oriented mindset, which encourages you to see challenges as opportunities to learn and develop, can transform the way you approach not just research, but any task or project you undertake.

So, as you embark on or continue your research journey, remember that the trials and tribulations you encounter are more than just obstacles to overcome. They are the crucibles in which your character is formed and strengthened. They are opportunities to develop a suite of skills and attitudes that will serve you well long after you’ve left the lab or library. These attributes, integral to personal and professional success, extend far beyond the confines of research, enriching your life and work in countless ways.

Your Thesis Project: A Rite of Passage

Reflecting on these experiences, it’s clear that thesis projects are far more than mere academic hurdles. They are rites of passage in the truest sense — transformative experiences that mold not just scholars but thinkers, innovators, and lifelong learners. They are where curiosity meets rigour, where challenges become opportunities for growth, and where young scholars take their first steps into the vast, uncharted territories of their future academic and professional careers. In the next chapter, we will discuss some of the complex skills you can expect to hone when completing a thesis project.

6

The Research Résumé: Unlocking Employability Skills for Success

Embarking on the thesis journey is akin to setting out on an uncharted path that promises both challenges and triumphs. As I reflect on my own academic journey, I realize that the thesis project was not just a milestone but a transformative expedition that honed a symphony of skills within me. These skills have proven invaluable, not only in the realm of academia but also as I navigated the diverse landscapes of the professional world.

This section isn’t just a list of skills; it’s a narrative of growth and empowerment. Each skill represents a chapter in my personal story, a story marked by persistence, discovery, and development. As you read through, I invite you to see more than the skills themselves; look for the journey behind them, the late nights, the moments of doubt overcome by breakthroughs, and the tireless pursuit of knowledge. These are the true treasures of the thesis journey, and they’re as personal as they are universal. So, let’s embark on this reflective exploration together, uncovering the multifaceted skills that the thesis journey cultivates and cherishes.

Critical Thinking and Problem-Solving

Through thesis research, you learn to navigate complex problems, analyze data, and draw logical conclusions. This process sharpens your ability to identify key issues, consider various solutions, and make informed decisions. In the professional world, these skills are crucial for tackling workplace challenges, developing innovative solutions, and driving successful outcomes.

Project Management

Completing a thesis involves setting goals, planning timelines, managing resources, and coordinating various tasks. This experience is a practical exercise in project management, teaching you how to break down large projects into manageable parts, set and meet deadlines, and coordinate different components to achieve a specific goal. These skills are directly transferable to any job that requires project planning and execution.

Research and Analytical Skills

Conducting thesis research hones your ability to gather, evaluate, and synthesize information from various sources. You learn to discern the quality of sources, analyze data, and derive insights. These skills are invaluable in a world where decision-making increasingly relies on understanding and interpreting complex information.

Communication Skills

Writing a thesis enhances your ability to communicate complex ideas clearly and effectively, both in writing and verbally. You learn to craft well-structured arguments, present data coherently, and articulate your findings persuasively. These communication skills are essential in virtually every profession, particularly those involving reporting, presenting, or teaching.

My supervisor once shared a story that perfectly captures the universal applicability of communication skills, a tale that has stayed with me as a testament to the transferable nature of skills honed during thesis work. This story centers around a former graduate student from my professor’s lab, who, upon completing their master’s, ventured forth from the world of academia into the advertising industry. This individual, having decided that academia wasn’t their calling, found themselves in an environment vastly different from the research lab. Yet, it wasn’t long before they made a remarkable impression on their colleagues. Known for their exceptional ability to lead client presentations, they quickly became the go-to person for this critical task. What set them apart wasn’t just their confidence or charisma; it was their innate ability to break down complex ideas and projects into easily digestible, compelling narratives.

Their proficiency in presenting ideas, a skill finely tuned through numerous academic conferences and scholarly discussions, now shone in a new arena. The scientific communication skills once applied to explaining intricate research to fellow scholars, now proved invaluable in an industry seemingly unrelated to their degree. Their team, recognizing the unique clarity and precision they brought to the table, deeply valued their contribution. This anecdote underscores a profound truth about the skills we cultivate through thesis work: they extend far beyond the confines of our specific academic disciplines. In the vast, interconnected world of work, the ability to communicate complex ideas with clarity and impact is a skill that transcends boundaries, a skill that can redefine your path and open doors you never anticipated. As I reflect on this story, I’m reminded of the power of effective communication and the myriad ways it can manifest and enrich one’s professional journey.

Formal Writing Skills

Completing a thesis project is akin to embarking on an intensive masterclass in formal writing. This skill is an essential element of the thesis journey and is honed through the process of drafting, revising, and finalizing your academic manuscript. Here’s a detailed look at how thesis writing enhances your formal writing skills:

In completing your thesis, you’re not just contributing to your field of study; you’re also significantly enhancing your formal writing skills. These skills will serve you well beyond your academic career, as clear, structured, and precise communication is highly prized in virtually all professions. Whether you’re crafting a business proposal, drafting a legal document, or writing a technical report, the formal writing skills honed during your thesis project will be one of your most valuable assets.

Adaptability and Resilience

We briefly touched on this point in the previous chapter, but it’s important to understand that research rarely goes as planned. Experiments fail, hypotheses are disproven, and data can be confusing. Navigating these challenges requires adaptability and resilience. You learn to adjust your approach, find alternative solutions, and persevere through setbacks. These skills are precious in any work environment, as they equip you to handle change, overcome obstacles, and persist in the face of adversity.

My research journey is the best testament to this skill. When completing my undergraduate thesis, I failed to replicate a well-known effect previously found in the lab. It was disappointing, to say the least, it set me back. However, three years later I have a manuscript on the cusp of publication, and working on a second based on interesting exploratory work to figure out why I was not able to replicate the effect. The point is, that things rarely turn out as you’d hoped for, and when they do, it’s exhilarating, but research will humble you. However, you never know where your project takes you, the trajectory that it takes may not be the one you had hoped for, but it might be better than you ever imagined,

There is no better testament to the indispensable skills of adaptability and resilience than my undergraduate thesis, where I found myself grappling with an unexpected challenge. I was attempting to replicate a well-known effect that had been previously demonstrated and published by our lab. Despite my meticulous efforts, I failed, multiple times… The disappointment was palpable, casting a shadow of doubt over my research capabilities and setting my progress back considerably.

Fast forward three years, one master’s degree later, and the scenario is dramatically different. I’m on the brink of publishing a manuscript, a culmination of relentless pursuit and intellectual rigour, born from the very ashes of my initial setback. Moreover, I’m engrossed in a second project, an intriguing exploratory venture to unravel the mysteries behind my initial inability to replicate the effect. This journey underscored a profound truth about research — it’s an unpredictable voyage, one that can humble the most confident among us. There are moments of sheer exhilaration when everything aligns perfectly, and then there are times when nothing seems to go as planned. But here’s the hard truth: you never truly know where your project might lead. The trajectory it takes might diverge wildly from your initial blueprint, leading you down paths you never anticipated, maybe richer and more rewarding than you ever imagined.

This story isn’t just mine; it’s shared by countless researchers who have navigated the turbulent waters of academic inquiry. It’s a story of hope, perseverance, and the unexpected twists and turns that often lead us to our most significant discoveries and personal growth. So, as you start your journey, remember that adaptability and resilience are your most trusted companions, guiding you through the twists and turns, and occasionally, leading you to shores more splendid than you ever envisioned.

Technical Proficiency

Depending on your field of study, completing a thesis may involve learning and using various technical tools, from statistical analysis software to laboratory equipment. These technical skills are not only specific to your field but also demonstrate your ability to learn and master new technologies, a highly valued trait in today’s rapidly evolving job market.

Attention to Detail

A successful thesis requires meticulous attention to detail, from ensuring data accuracy to adhering to formatting guidelines. This painstaking focus translates into a keen eye for detail in the professional world, where such precision can be the difference between success and failure in many tasks and projects.

Self-Motivation and Time Management

Completing a thesis is a long and often solitary journey that requires self-discipline and effective time management. Sure you will have your supervisor to advise and guide you, but they are far too busy to micromanage you. You learn to set your schedule, prioritize tasks, and stay motivated without constant supervision. These self-management skills are critical in any job, especially in roles requiring independent work and initiative.

Collaboration and Teamwork

While a thesis is an independent project, it often involves collaborating with advisors, peers, and other researchers. This experience teaches you to work effectively as part of a team, incorporating feedback, providing constructive feedback, sharing responsibilities, and contributing to a collective goal. Teamwork is a fundamental aspect of most professional environments, where collaborative projects and cross-functional teams are the norms.

Ethical Judgment and Integrity

Conducting research ethically is paramount in thesis work. This involves understanding and adhering to ethical guidelines, accurately reporting data, and giving proper credit to sources. Developing a strong sense of ethical judgment and integrity is crucial, as employers highly value these traits in their employees.

 Skill Symphony

As you select your thesis topic, think of it as an investment in your future. The topic you choose now can define the trajectory of your academic and professional journey. The process of completing a thesis is a comprehensive skill-building exercise. Each skill you develop during this journey is a tool in your employability arsenal, making you a more competent, versatile, and attractive candidate in the job market. By aligning your thesis with your future aspirations, you’re not just completing an academic requirement; you’re setting the stage for future success and fulfillment. Remember, the broader impacts of your thesis extend well beyond the confines of your current academic environment and can have lasting effects on your career and beyond.

I

Week 1 - Jumpstarting Your Thesis Project

Welcome to Week 1 of your thesis research module. This initial phase is crucial in setting the stage for a successful thesis journey. As you embark on this path, it’s essential to recognize the multifaceted role of your supervisor and how understanding their responsibilities can help you foster a more productive and harmonious working relationship.

Your relationship with your thesis supervisor is pivotal. They are your most valuable resource. They are the expert in the field of research you are interested in, therefore, learning how to navigate this partnership will be essential to not just your success but learning as well. This week, you’ll learn the art of proactive communication, understand the breadth of your supervisor’s commitments, and get working on completing organizational tasks to jumpstart your thesis journey. This week, you’ll learn how to effectively communicate and build a productive relationship with your supervisor, and establish clear expectations. You will also learn the value of realistic goal setting and the importance of creating a thesis timeline. These initial steps will set the tone for how you progress through your thesis journey.

1

Setting Realistic Goals and Timelines

Every thesis journey begins with a vision — an aspiration to contribute something meaningful to your field of study. However, the bridge between aspiration and achievement is built with the bricks of realistic goals and well-planned timelines. This chapter delves into the significance of setting achievable objectives and mapping out a practical schedule for your thesis project, ensuring a path that leads to success without unnecessary stress.

The Art of Realistic Goal Setting

Know Your Limits: Before setting goals, assess your skills, resources, and constraints. Recognize your strengths and acknowledge areas where you might need more time or help. This self-awareness forms the foundation of realistic goal-setting. While ambition drives progress, overambition can lead to burnout and disappointment. Learn to balance the desire for a significant contribution with what’s practically achievable within your constraints.

SMART Goals: Adopt the SMART criteria — Specific, Measurable, Achievable, Relevant, and Time-bound. A goal well set is a goal half achieved. For a thesis, this might mean defining clear milestones, such as completing the literature review by a certain date or drafting a particular chapter within a specified period. For this week’s module, a SMART goals worksheet has been created and made available under exercises if you are interested in adopting this technique.

Flexibility within Framework: While your goals should be specific, maintain flexibility. Research is unpredictable, and you might need to adjust your objectives as you progress. View any deviations from your timeline as learning opportunities. Reflect on what caused the delay and adjust your approach accordingly. Life rarely goes according to plan. It’s our resilience and perspective that define our journey. My advice centers on maintaining an unwavering focus on the ultimate goal, or in simpler terms, keeping your eyes on the prize. Adopt a long-term vision and resist getting derailed by temporary setbacks. Today’s hurdles might seem insurmountable, but a time will come, I assure you, when you’ll reflect on these moments with a chuckle, realizing the concerns that once loomed large were, in fact, stepping stones you’ve since crossed.

Don’t believe me? Then consider this anecdote: during my high school years, a friend’s sister, then a university student, visited our school. She overheard us complaining about the rigorous demands of high school, our feelings of being overwhelmed, and the seemingly insurmountable tasks before us. I vividly recall her turning to us, a wistful expression in her eyes, and remarking, “I wish I were back in your shoes. This is as easy as it gets, so enjoy it while it lasts.” At the time, we were, understandably, a touch irked. It felt as though our struggles were being dismissed. Yet, with the wisdom of hindsight, I can confirm, without a shadow of a doubt that she was right. High school, through the lens of the present, was indeed a simpler era. It didn’t feel so then, but compared to the complexities of now, it certainly was.

So, as you embark on your own path, laden with its unique challenges and triumphs, remember that the magnitude of today’s difficulties will diminish over time. So as you venture through the obstacles of your thesis journey, continually remind yourself of the moment when you will finally click ‘submit’ on your manuscript, a moment filled with a profound sense of relief and triumph. Envision yourself at your graduation, surrounded by friends and family, collectively reflecting on the trials and late-night study sessions that were integral to earning your degree. This forward-looking mindset isn’t just about anticipation; it’s about fueling your journey with the promise of achievement that awaits. After all, the journey is as much about growth and perspective as it is about reaching the destination.

Crafting a Practical Timeline

  • Understanding the Thesis Lifecycle: Familiarize yourself with the stages of thesis development — from topic selection to final defence. Each stage has its own set of tasks and challenges, which should be reflected in your timeline.
  • Backward Planning: I would suggest that you start from your final deadline and work backward. Allocate time for each stage of your thesis, including buffer periods for exam seasons or unexpected delays. Remember to include time for revisions and feedback.
  • Regular Reviews & Adjustments: Set regular intervals to review your progress and adjust your timeline as needed. This helps you stay on track and makes the process less overwhelming. Moreover, regularly consult with your supervisor and peers to ensure your goals and timeline are realistic. They can provide valuable insights from their experience.

The Psychological Impact of Goal Setting and Timelines

  • Motivation and Momentum: Achievable goals and clear timelines provide a roadmap that keeps you motivated. Each small victory builds momentum, pushing you closer to your ultimate objective.
  • Stress and Anxiety Management: Unrealistic goals and disorganized timelines are recipes for stress. Conversely, knowing exactly what you need to do and when you can do it mitigates anxiety and fosters a healthier research environment.
  • The Satisfaction of Progress: There’s immense satisfaction in ticking off tasks within the expected time frame. This not only boosts your morale but also reinforces your confidence in managing complex projects.

The main takeaway here is that setting realistic goals and a well-considered timeline isn’t just about ensuring the timely completion of your thesis; it’s about creating a journey that’s intellectually fulfilling and personally sustainable. By respecting your capacities, understanding the nature of research, and planning with foresight, you pave a path that’s conducive to success and personal well-being. As you embark on this significant academic endeavour, remember that the quality of your journey is as important as the destination. Your thesis isn’t just a product; it’s a testament to your growth as a scholar and a professional.


Creating an Environment for Goal Setters and Achievers

In this next little section, I will introduce you to a practice passed down to me by one of my research supervisors that I found to be extremely helpful in fostering a productive working environment ideal for achieving my research goals.


An interactive H5P element has been excluded from this version of the text. You can view it online here:
https://ecampusontario.pressbooks.pub/craftingresearchnarratives/?p=139#h5p-2


2

Navigating the Supervisor Relationship

Navigating the Busy World of Your Supervisor
Your supervisor is a key figure in your academic journey, but they are also juggling a multitude of tasks and responsibilities. Here’s what you need to understand:

  • Multi-Tasking Wizards: Recognize that your supervisor is handling teaching, departmental duties, multiple research projects, other supervisory roles, grant applications, and more, alongside supervising you.
  • Limited Time: Understand that their time is precious, and they have personal commitments too.
  • Value of Initiative: Learn why taking the initiative in your relationship can lead to a more fruitful academic experience. This approach isn’t just a chance to refine your time management capabilities; it also provides practical experience in leading and directing a project. Such skills are immensely valuable and sought after in both the professional world and academic circles. Moreover, a well-organized and enthusiastic student leaves a lasting impression on supervisors, something they’re likely to recall when the time comes to write a reference letter for you.
  • Acknowledge individuality in supervisory style: When embarking on your thesis journey, it’s crucial to recognize and adapt to the individual supervisory style of your mentor. Supervisors are as diverse in their approaches as they are in their academic interests. Understanding and acknowledging this individuality can significantly enhance your working relationship and overall thesis experience.
    • Variety in Styles: Supervisors might range from being highly structured, expecting regular and formal updates, to more laissez-faire, where they provide freedom for you to explore and only step in when needed.
      Communication Preferences: Some may prefer face-to-face meetings, while others might lean towards emails or virtual check-ins.
      Feedback Approach: The frequency, detail, and mode of feedback can vary significantly. Some supervisors provide detailed notes, others offer broad directional guidance.
    • Pay attention to how your supervisor operates. How do they communicate? What are their expectations for meetings and updates? What kind of feedback do they provide? If you’re unsure about their style or expectations, ask. Early clarification can prevent misunderstandings and align your working styles. Be prepared to adapt your working and communication style to suit theirs. This flexibility can lead to a more productive and less stressful experience. While adapting to their style, also communicate your own needs and preferences. If you require more structured guidance, express this early in your relationship. Regardless of style differences, mutual respect is foundational. Recognize their expertise and experience, and appreciate the guidance they provide. Take charge of your learning and progress. Be proactive in seeking advice, feedback, and support.
    • Lastly, it is important to acknowledge that every supervisor is unique, and there’s no one-size-fits-all approach to working with them. By acknowledging and adapting to their supervisory style, you can foster a more effective and enjoyable working relationship. Remember, communication is key. Openly discussing expectations, preferences, and boundaries will help ensure that both you and your supervisor have a rewarding and productive thesis experience.

Proactive Communication & Planning
Taking charge of your communication and planning is vital in maximizing your learning and productivity.

  • Initiate Contact: Don’t wait for your supervisor to reach out. Be the one to schedule meetings and provide updates. It’s important to agree upon a regular meeting time (weekly or biweekly), in-person, virtually, or perhaps a mix of both. It is also important to establish a preferred form of communication, which will likely take place via email, or you may opt to use other communication platforms such as Microsoft Teams, Slack, and more.
  • Regular Updates: Keep them informed of your progress, challenges, and next steps. Communication is key. Inquire about their preferred schedule for routine check-ins. While these might typically take place at the start of regular meetings, your supervisor reserves the right to opt for separate updates, possibly in a written format. Note that these updates might not be a direct request from your supervisor but a departmental requirement. If that’s the case, expect the department to inform you of these expectations. However, if there’s any uncertainty, don’t hesitate to contact the departmental authority responsible for thesis projects to clarify any requirements and deadlines. It’s important not to assume your supervisor knows these details or to expect them to investigate. They generally anticipate that you will stay informed about these issues, as they can change every year. Furthermore, if you anticipate busier periods, like exam weeks, communicate this upfront. It’s okay to inform them that your focus may temporarily shift, and you might request to postpone a regular meeting but assure them of your return to thesis work thereafter. Far from being a negative, this demonstrates your ability to manage and prioritize effectively.
  • Meeting Preparation: Make the most of your meetings by being prepared with questions, progress reports, and suggestions for moving forward. I would even recommend sending a reminder to your supervisor the day before your regularly scheduled meeting with a brief agenda of the main topics of discussion during the meeting (e.g., discussing an assigned reading, or reviewing the results of the recent analyses). Here’s a little insider secret: your supervisor is probably getting ready for your meeting, the night before or the day of. If you made an audible gasp, I wouldn’t blame you, I did the first time I found out, but as an expert, it takes them very little time to read a paper or prepare a polished presentation. When I was an undergrad, it took me anywhere from 3 to 5 hours to read a single research paper thoroughly enough to discuss it confidently. However, my supervisor would often just briefly look at the paper in a 30-minute slot they found between meetings, yet lead the discussion as if they were an author. Now, as a Ph.D. student with more reading experience and expertise, I can typically understand papers in 30 to 90 minutes, depending on complexity and length. It’s worth noting that giving your supervisor a reminder and update about the meeting agenda will probably be helpful for them to prepare their part in this partnership.

Establishing a Productive Working Framework
A structured approach is essential to navigate your thesis journey effectively. Part of that structure may stem from this guide, and working through the weekly tasks and goals. However, there may be other tasks and expectations for you to meet outside of the ones laid out in our weekly modules. It’s important to use this as a self-guide to complement requirements set out by your supervisor and the department. Thesis work is graded work, therefore it’s important to be aware of what the expectations are for you to ensure that the grade you receive from your supervisor reflects a fair assessment of your work.

  • Setting Expectations: Discuss and agree upon expectations with your supervisor. It is important to communicate expectations early on. Ask your supervisor the level of commitment and contribution they expect of their thesis students.
    • Typically, undergraduate students become part of an existing lab project led by a graduate student, who might also serve as an unofficial co-supervisor. They might join your regular meetings, and offer feedback on your work, and their assessments might even influence your final thesis grade. The graduate students you work with may take more of a passive role, focusing on tasks like coding experiments and analyzing data. In this case, your communication with them will be minimal. In either case, graduate students are most likely involved in training you on the technical lab skills required for data collection. As an undergraduate, you may also expected to conduct literature reviews, lead discussions, attend lab meetings, write a formal thesis report, and communicate your work at a conference in the form of a presentation or research poster. However, your role doesn’t have to be restricted to these tasks. Depending on your interests and how much time you can commit, you might want to delve deeper. For instance, you could take part in data analysis or, if the project contributes to a paper being written for publication, express your interest in being credited as an author or contributor. If you’re keen on this, it’s crucial to discuss it with your supervisor early on. Ask if they’re open to the idea and, if so, understand what they expect from you to earn that acknowledgment. This proactive approach ensures you and your supervisor have a clear understanding of your role and contributions from the start. In terms of being listed as a writer or author, the expectations are generally higher. You may need to:
        • Demonstrate Significant Contribution: This typically means being involved in a substantial aspect of the research, such as hypothesis formulation, data collection, data analysis, or writing a significant portion of the manuscript.
        • Show Consistent Involvement: Regularly participate in the project and meetings to demonstrate your ongoing commitment and understanding of the research.
        • Exhibit Writing Proficiency: Have the skills to contribute effectively to the manuscript, whether it’s through drafting sections, revising content, or ensuring the work adheres to academic standards.
        • Understand Publication Ethics: Be aware of the ethical considerations in publishing, including authorship criteria, conflict of interest, and data integrity. Remember, the exact expectations can vary between disciplines and supervisors, so having a detailed discussion about your role, contributions, and the criteria for authorship is crucial. This will help set clear goals and pathways for your involvement and recognition in the project.
    • As a graduate student, you’re expected to devise and lead your research project. While your supervisor might steer you towards certain topics or an existing lab project, you’re generally expected to determine the subsequent steps and experiments independently. This involves designing experiments under your supervisor’s guidance, collecting data, analyzing data, and composing a formal thesis to fulfill your degree requirements. Moreover, it’s advisable to aim for an additional version of your thesis suitable for publication in an academic journal. If you’re interested in pursuing a career in academia, having publications early on in your graduate journey is an asset, especially when applying for grants, scholarships, and jobs in academic institutions. it shows that you are an independent, capable, and active researcher. However, you should prioritize the version of your thesis that you submit for your degree which must meet specific institutional criteria, but journals have their own set of standards and formats. If you’re considering publication, discuss this early with your supervisor, since there is always the chance that the work you completed meets your degree requirements, but is not necessarily enough for a publishable paper. Therefore, further work may be required and they can then navigate you through this process.
  • Feedback and Revisions: Understand the importance of timely and constructive feedback and how to incorporate it. An effective strategy is to establish personal deadlines and share them with your supervisor early on. Considering your department’s internal thesis submission deadlines, it’s wise to plan well in advance. Take into account your supervisor’s expectations and busy schedule when setting your deadlines for completing the initial draft of your thesis paper. Allotting sufficient time for your supervisor to review and offer valuable feedback is crucial. A practical approach, as outlined in this module, is to segment the thesis paper into its primary sections and complete each one by one. For instance, you might start with the methods and procedures section, which you can often write concurrently with data collection.


Week 1 Wrap-Up: Laying the Foundation for a Successful Thesis Journey

As we wrap up Week 1 of this module, you’ve taken your first crucial steps toward a successful thesis journey. Recognizing your supervisor’s multifaceted role and mastering proactive communication will form the backbone of this productive and harmonious partnership. This week has been about laying the groundwork: understanding the busy world of your supervisor, learning the value of taking the initiative, and preparing to navigate the complexities of academic research and writing.

Remember, your relationship with your supervisor is central to your thesis journey. They’re not just a resource but an expert guide, and how you engage with them will significantly shape your learning and success. From establishing regular updates to preparing for meetings and understanding their time constraints, every strategy you’ve learned this week is aimed at fostering a strong, collaborative relationship.

In addition to these interpersonal skills, you’ve also begun to consider the structural and practical aspects of your project. Whether you’re an undergraduate joining a lab project or a graduate student leading your own research, understanding your role, contributions, and the expectations for authorship are essential. As you plan, remember to align your personal deadlines with your department’s requirements and give your supervisor ample time to provide feedback.

Looking forward, we’ve outlined specific tasks and goals for this week to help you transition smoothly into the next stages of your research and writing. By breaking down your thesis into manageable sections and setting clear, achievable deadlines, you’re not just planning for success; you’re actively building the skills and habits that will carry you through your academic journey and beyond.

So, as you move into the next phase of this module, carry with you the lessons of this first week: the importance of initiative, communication, and careful planning. Your journey is just beginning, and the skills you’re developing now will be invaluable every step of the way. Let’s continue this journey together, with clarity, purpose, and anticipation for the discoveries and achievements that lie ahead.

3

Week 1 Exercises

An interactive H5P element has been excluded from this version of the text. You can view it online here:
https://ecampusontario.pressbooks.pub/craftingresearchnarratives/?p=49#h5p-1


An interactive H5P element has been excluded from this version of the text. You can view it online here:
https://ecampusontario.pressbooks.pub/craftingresearchnarratives/?p=49#h5p-6

II

Week 2: Topic Selection and Thesis Proposal

Welcome to Week 2 of your thesis journey. This chapter is designed to guide you through two of the most critical steps in your research process: selecting a compelling thesis topic and writing a compelling proposal. 

Grasping the Significance of Your Thesis Topic

Your thesis topic is not merely a subject to study; it is the cornerstone of your entire research endeavour. It informs the questions you ask, the methods you employ, and the analytical lens you apply. Recognizing that a carefully selected topic can greatly enhance the enjoyment and success of your research journey is crucial.

For novices embarking on their first research project, it’s wise to consider a topic that’s familiar and accessible. Engage in a project that’s currently active in your lab or one where your supervisor has established expertise. Recognizing your initial boundaries is key. Opting for a guided project allows you to acquire the necessary technical skills and knowledge incrementally. This hands-on experience sets a solid foundation, empowering you to eventually spearhead your research into uncharted territories — perhaps a ‘passion project’ in a new area where your supervisor might not be as knowledgeable, where you can become the expert. However, remember the constraints of your degree requirements and other academic responsibilities. For beginners, playing it safe with a guided project often proves more prudent.

For those more advanced, with some research experience, the challenge is to juggle multiple tasks effectively. Don’t hastily discard ongoing projects even if they seem monotonous. Perseverance is key in research; continue to progress these projects while also considering starting a side project on a new, exciting topic. This approach not only enriches your research experience but also hones your multitasking skills, a highly valued trait in any professional context.

Schedule a meeting with your professor. Inquire about ongoing projects and seek their advice. They likely have several options in mind that could suit your interests and skill level. If you’re already nurturing a specific topic, research thoroughly and discuss it with your supervisor. They might not share your enthusiasm for the subject, but they can potentially direct you to a colleague who does. This could lead you to a new lab and perhaps even a co-supervisor!

In your research journey, flexibility, guidance, and a well-considered topic choice are your allies. Whether you’re just starting out or are looking to expand your horizons, the path you choose now will significantly influence your research experience and outcomes.

Strategies for Topic Selection

  • Interest & Passion
    • Why It Matters: Your interest and passion are vital because they fuel persistence, especially when the research becomes challenging. Choose a topic that fascinates you to maintain motivation throughout your thesis journey.
    • How to Explore: Reflect on courses, lectures, or readings that particularly engaged you. Identify the themes or questions that excited you the most. These areas are potential gold mines for your research topic.
  • Consultation with Supervisor
    • Why It Matters: Your supervisor is a valuable resource. They have experience and can foresee potential pitfalls or highlight exciting areas of research you might not have considered.
    • How to Approach: Prepare a list of broad areas you’re interested in before the meeting. Your supervisor likely has a project in mind for you, so to be prepared, you might want to survey your supervisor’s lab websites for descriptions of projects. You can also look up some of the recently published work or speak to other members of the lab about their projects. Be open to suggestions and feedback. Your supervisor’s insights can help refine your ideas into a workable thesis topic.
  • Literature Review
    • Why It Matters: A literature review helps you understand the current state of research in your field. It’s crucial to identify gaps in knowledge that your thesis could address.
    • How to Conduct: Make use of academic databases to explore the most recent scholarly publications relevant to your areas of interest. Your institution’s library likely provides access to various journals and articles through search platforms available to students and faculty. You can access these valuable resources for free by logging in through your school’s library portal. Visit your school’s library website, or for a more personalized approach, consult a librarian directly for assistance in navigating these tools. Starting with recently published review articles is especially advantageous. These pieces offer a thorough summary of the current literature on a specific topic, making them an excellent initial point for recognizing key studies in the field and comprehending both well-established findings and topics needing further exploration. As you review these articles, focus intently on recurring themes, methodologies employed, and the conclusions reached. Look for unexplored areas or aspects where your distinct perspective could add new and valuable insights.
  • Feasibility & Resources
    • Why It Matters: A feasible topic is one that can be reasonably completed with the resources and time you have. It’s essential to ensure your ambitious project doesn’t become an impossible one.
    • Considerations: Assess the availability of necessary data, equipment, and funding by consulting with your supervisor. Consider if you can complete the project within your program’s timeline and whether you’ll need special permissions or access to particular archives, laboratories, or field sites.
  • Academic & Career Goals
    • Why It Matters: Your thesis can be a stepping stone in your academic and career journey. Choosing a topic aligned with your future goals can provide a valuable head start.
    • Long-term Planning: Think about where you want your career or further studies to go. Choose a topic that will help you acquire the knowledge and skills valuable for your future path. If you haven’t done so already I would suggest reading one of the introductory chapters of this module titled: “Mastering Your Future: How Thesis Engagement Advances Academic and Career Prospects” to gain a better understanding of this particular point. 
  • Originality & Relevance
    • Why It Matters: Original research contributes to your field’s body of knowledge. It’s also more likely to be published and can set your work apart.
    • Balancing Act: Strive for a topic that’s original but not so niche that it becomes irrelevant. Consider the practical applications of your research and how it can impact society or the field.
  • Scope & Scale
    • Why It Matters: A well-defined scope ensures your project is manageable and allows for a deeper analysis of a specific issue.
    • Setting Boundaries: Clearly define what your research will and will not cover. Avoid being too broad or too narrow. Aim for a topic that’s complex enough to be interesting but not so vast that it’s unmanageable.
  • Methodological Considerations
    • Why It Matters: Your methodology is how you’ll gather and analyze data. It’s crucial to choose a topic that matches your skills or one you’re willing to learn new methods for.
    • Skill Assessment: Honestly assess your current skills and willingness to learn new methodologies. Consider courses or workshops to upskill if needed.
  • Seek Feedback
    • Why It Matters: Feedback can provide new perspectives and help refine your topic into a robust research question.
    • Broadening Your Circle: In addition to your supervisor, discuss your ideas with peers, other faculty members, and professionals in the field. They can offer valuable insights and suggestions.
  • Flexibility
    • Why It Matters: Research is unpredictable. Being flexible allows you to adapt your topic based on findings or unforeseen challenges.
    • Adaptive Strategy: Be prepared to narrow or slightly shift your focus as you delve deeper into your research. Stay open-minded and ready to refine your topic.
  • Ethical Considerations
    • Why It Matters: Ethical research is foundational. Ensuring your topic meets ethical standards is crucial for its validity and acceptance.
    • Ethical Planning: Consider the ethical implications of your research early on. Plan how you’ll address potential ethical issues, and understand the approval process for your study.
  • Future Impact
    • Why It Matters: Considering the future impact of your research can guide you toward a topic that’s not only relevant today but will be valuable for years to come.
    • Visionary Thinking: Imagine the future applications of your research. Consider how it might influence future studies, policies, or practices in your field.

By thoroughly considering each of these strategies, you’ll be better equipped to choose a thesis topic that’s not only interesting and feasible but also impactful and aligned with your long-term goals. Your chosen topic will guide your research journey, so invest the time and thought necessary to make it a meaningful one.

Finalizing Your Topic

Engage in a detailed discussion with your supervisor to finalize your topic. Understand the importance of flexibility and be open to refining your topic as you become more immersed in the literature.


Key Takeaways

Grasping the Significance of Your Thesis Topic

  • Understand that your thesis topic sets the stage for your entire research journey, influencing the questions, methods, and analytical approaches you’ll employ.
  • For beginners, recognize the benefits of choosing a topic closely aligned with ongoing lab projects or your supervisor’s expertise, which offers a solid learning ground and support structure.
  • For those with some experience, consider the value of diversifying your research interests and the skills gained from managing multiple projects simultaneously.

Strategies for Topic Selection

  • Appreciate the importance of aligning your topic with personal interests and passions to maintain motivation throughout your research.
  • Recognize the role of your supervisor as a key resource in guiding your topic selection and avoiding potential research pitfalls.
    Understand the critical role of a thorough literature review in identifying gaps, shaping your topic, and setting the foundation for original contributions to your field.
  • Assess the feasibility of your topic in terms of resources, time, and scope to ensure a successful and manageable research process.
  • Consider how your thesis aligns with your long-term academic and career goals, and how it can serve as a stepping stone for future opportunities.

Finalizing Your Topic

  • Understand the importance of flexibility and openness to refining your topic as you engage in deeper discussions with your supervisor and immerse yourself in the literature.
  • Embrace the iterative nature of finalizing your topic, recognizing that it may evolve as new insights and understandings emerge from your ongoing research and feedback.

4

Navigating Search Engines & Databases

When searching for academic articles, it’s beneficial to use a variety of search engines and databases to get a comprehensive view of the literature. Each platform has its strengths and specific focus areas. Here are several widely used and respected search engines and databases for academic research:

 SEARCH ENGINES

DESCRIPTION

STRENGTHS

WEAKNESSES

BEST FOR

1. Google Scholar A freely accessible search engine that indexes the full text of scholarly articles across an array of publishing formats and disciplines. Broad coverage, citation tracking, and links to related articles. Can include fewer scholarly sources, making it necessary to carefully assess the credibility of each result. The broad scope may also lead to an overwhelming number of results. All disciplines. 
2. PubMed A free search engine accessing primarily the MEDLINE database of references and abstracts on life sciences and biomedical topics. Ideal for medical, health, and biological sciences. Primarily focuses on life sciences and may not provide comprehensive coverage of related fields like social aspects of medicine. Medical sciences, health, and biology.
3. Web of Science A comprehensive research platform that provides access to multiple databases of scholarly works. Wide disciplinary coverage, citation tracking, and robust search capabilities. Limited access without a subscription, and some users find the interface less intuitive compared to other databases. A wide range of fields including sciences, social sciences, arts, and humanities.
4. Scopus One of the largest abstract and citation databases of peer-reviewed literature: scientific journals, books, and conference proceedings. Broad coverage, citation analysis tools, and author profiles. Subscription-based access and some critiques about its coverage and citation analysis accuracy. Multidisciplinary research, particularly strong in scientific, technical, medical, and social sciences.
5. JSTOR
A digital library for scholars, researchers, and students, providing access to thousands of academic journals, books, and primary sources. Strong in the humanities, social sciences, and historical archives. Typically does not include the most recent publications due to moving wall restrictions, limiting access to the latest research. Humanities and social sciences.
6. ScienceDirect
A website operated by the Dutch publisher Elsevier. It includes a large collection of scientific and technical research. Strong in scientific, technical, and medical research. Access is primarily through subscription, and some have critiqued it for high costs and publisher control. Scientific, technical, and medical research.
7. Microsoft Academic
A free public web search engine for academic publications and literature. Semantic search capabilities, and visualization tools.
Has been considered less comprehensive compared to Google Scholar and others. Also, Microsoft announced it would be discontinuing the service.
Multidisciplinary, with a strong focus on computer science, physics, and engineering.
8. SSRN
An open-access repository that provides early distribution of research in the social sciences and humanities.
Ideal for accessing early-stage and working papers. Mainly contains working papers and preprints, so the content hasn’t been peer-reviewed. Social sciences and humanities.
9. Academic Search Engines (ASE):
Description: A search engine specifically for academic web resources. ASE offers the ability to search a specially curated database of scholarly articles.
Focuses on academic and scholarly websites. Varying coverage depending on the field, and sometimes includes non-scholarly sources.
A broad range of academic web resources, suitable for all disciplines.
10. arXiv
A repository of electronic preprints (e-prints) approved for posting after moderation but not full peer review. It’s focused on physics, mathematics, computer science, quantitative biology, quantitative finance, and statistics.
Access to the latest research, often before it’s formally published. As a repository of preprints, the studies haven’t been peer-reviewed, which can sometimes question their reliability.
Physics, mathematics, computer science, quantitative biology, quantitative finance, and statistics.


Considering Google Scholar’s widespread popularity as a search engine across various academic fields, here is a straightforward guide offering several tips and tricks to enhance and refine your search experience.


An interactive H5P element has been excluded from this version of the text. You can view it online here:
https://ecampusontario.pressbooks.pub/craftingresearchnarratives/?p=91#h5p-3

5

Writing a Compelling Thesis Proposal - The Problem, Gap, Hook, Solution Method

Once you’ve finalized your topic with your supervisor, it’s time to put your thoughts onto paper. Like many, including myself during my undergraduate thesis, you may be required to submit a detailed proposal to your department. However, academic protocols can vary significantly between institutions and even departments, so it’s crucial to confirm whether this applies to your situation.

If a proposal submission is indeed mandatory, ensure you’re fully aware of any specific guidelines or requirements, such as formatting standards or word count limits. Even in scenarios where a formal proposal isn’t a strict requirement, crafting one is still immensely valuable. A thesis proposal is more than a mere formality; it’s a blueprint for your research and a pitch that must convince readers of the worthiness and necessity of your study. The Problem, Gap, Hook, Solution method provides a powerful structure for crafting a compelling narrative around your research. Let’s delve deeper into each of these components to understand how they collectively create a persuasive and coherent proposal.

The Problem

  • Defining the Issue: Start by explicitly stating the problem your research addresses. This is the starting point of your narrative — the reason your thesis matters. What is the issue at hand? Why is it a matter of concern? Be specific and clear.
  • Contextualizing the Problem: Situate the problem within the existing body of knowledge. How is it related to the wider field of study? This not only demonstrates your understanding but also sets the stage for highlighting the gap.

Identifying the Gap

  • Pinpointing the Void: After establishing the problem, demonstrate the gap in existing knowledge or practice. What questions remain unanswered? What aspects have been overlooked or inadequately explored?
  • Critique of Current Knowledge: Provide a critical review of the literature. Discuss what previous studies have accomplished and where they fall short. This isn’t about dismissing other work; it’s about identifying opportunities for further research.

The Hook

  • Captivating Your Audience: The hook is your chance to grab the reader’s interest. It should be directly related to the problem and the gap you’ve identified.
  • Relevance of the Gap: Explain why filling your gap matters. How will understanding this missing piece contribute to the field? What potential implications does it have?
  • Establishing Significance: Explain why your problem matters. Connect it to broader societal, academic, or practical concerns. Use data, statistics, or real-world examples to underscore its importance.

Proposing the Solution

  • Presenting Your Research: Now, introduce your study as the bridge across the identified gap. What is your research question or hypothesis? How does it address the specific void you’ve highlighted?
  • Methodology Overview: Briefly outline the methods you’ll use to conduct your research. Why are these the best approaches to tackle the problem and fill the gap?
  • Anticipated Contributions: Discuss the potential outcomes of your research. How will it advance knowledge in the field? What broader impacts might it have?
Your thesis proposal is a narrative that convinces readers of the necessity, viability, and significance of your research. Each part of the Problem, Gap, Hook, and Solution method plays a crucial role in this narrative. The problem sets the stage, the gap justifies the need for your study, the hook ensures the reader is fully engaged, and the solution outlines what you’re going to do and why it matters. By meticulously researching, thoughtfully planning, and strategically presenting your proposal, you lay the groundwork for a thesis that is not only academically rigorous but also compelling and impactful.

6

Week 2 Exercises

An interactive H5P element has been excluded from this version of the text. You can view it online here:
https://ecampusontario.pressbooks.pub/craftingresearchnarratives/?p=173#h5p-5


Crafting a Compelling Thesis Proposal Worksheet: The Problem, Gap, Hook, Solution Method Results Edit


An interactive H5P element has been excluded from this version of the text. You can view it online here:
https://ecampusontario.pressbooks.pub/craftingresearchnarratives/?p=173#h5p-7

III

Week 3: Conducting a Literature Review

Welcome to Week 3. As you delve into this crucial phase, you are transitioning from the preliminary stages of understanding and planning to actively engaging with the academic community’s body of knowledge. This week is dedicated to mastering the art of conducting a comprehensive literature review, a fundamental component of any scholarly research.

A literature review is an integral component of a thesis project, serving as both a foundation and a framework for the research. It does more than just summarize existing research; it provides a critical analysis of the literature relevant to your specific topic. It helps you establish a theoretical framework for your study, identify gaps in current research, and avoid duplication of efforts. This section will provide a detailed overview of the purpose, process, and structure of a literature review in a thesis project.
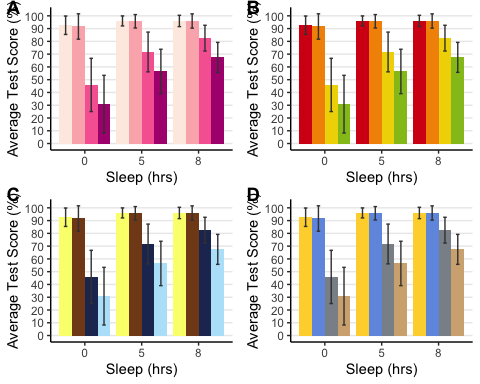
The Foundations and Functions of a Literature Review

As a thesis student, one of the most critical components you’ll encounter in your research journey is the literature review. It’s not merely a summary of what others have said about your topic; it’s a scholarly conversation in which you actively participate. This chapter will explore the foundational elements and key functions of a literature review in a thesis project, providing you with the knowledge to execute it effectively.

At its core, a literature review is a comprehensive survey of scholarly sources on a specific topic. It provides an overview of current knowledge, allowing you to identify relevant theories, methods, and gaps in the existing research. This isn’t a mere inventory of articles; it’s an analytical framework that contextualizes your research within the broader academic discourse. The literature review sets the stage for your inquiry, offering a lens through which your unique contribution can be viewed.

Foundations of a Strong Review

A compelling literature review is anchored on a well-defined scope and focus. It should encapsulate a broad enough spectrum to offer a comprehensive understanding yet remain narrowly tailored to echo the specifics of your research question. It’s a balancing act of breadth and depth. Critical analysis is the soul of the review. This means engaging with the literature not as a passive recipient but as an active critic, appraising methodologies, arguments, and conclusions. By weaving together various studies, you’re not just reporting existing knowledge but also creating a scholarly narrative that shows trends, gaps, and the next potential leap in understanding.

Purpose of a Literature Review

  • Establishing Context: It situates your research within the broader academic conversation, showing how your work links to, complements, or challenges existing knowledge.
  • Identifying Gaps: By exploring what has been previously studied, a literature review helps identify gaps or unanswered questions that your research aims to address. Carefully document these identified gaps, as they are essential to include in your introduction. Highlighting these aspects will help build a compelling narrative that underscores the necessity and relevance of your research.
  • Theoretical Framework: It provides the theoretical underpinnings for your study, grounding your research questions and methodology in established theories and models. This aspect becomes particularly crucial when crafting the Introduction and Discussion sections of your thesis. A thorough understanding of existing theories not only guides the formulation of hypotheses or predictions in your Introduction, should you decide to align yourself with a specific theoretical perspective, but also enriches the Discussion. In this section, you must contextualize your findings within the broader theoretical landscape, examining how your results either support or challenge existing theoretical frameworks. Engaging in this level of theoretical discourse is essential, as it demonstrates the depth of your understanding and the broader implications of your research within your field of study.
  • Methodological Insight: Reviewing past research is not just about understanding what has been studied; it’s a gateway to acquiring profound insights into effective methodologies, data collection strategies, and analytical techniques. In the spirit of open science, many researchers opt to share their datasets, experimental materials like scripts, and analysis tools on public platforms such as OSF (Open Science Framework) or Mendeley. This transparency not only fosters collaboration but also serves as a valuable resource for others in the field. If specific materials or data are not readily available, consider reaching out to the study’s corresponding author. Many are open to sharing their resources or providing guidance, especially if you intend to replicate a study for further exploration or wish to build upon their work. Such interactions can also be instrumental in acquiring practical tools and resources for your own research endeavours, enhancing your understanding of applied methodologies and contributing to the depth of your thesis project.

Conducting an Effective Literature Review

Embarking on a literature review is a journey of discovery. A comprehensive and strategic search across multiple databases and sources is crucial to ensure no significant study is overlooked. As you gather this wealth of information, organizing it in a logical and structured manner is essential. This could be thematically, chronologically, or methodologically, depending on what best suits your research.

Beyond summarizing sources, critically evaluate and interpret the literature. Discuss the strengths and weaknesses of different approaches and the overall contributions to the field. Clarity in writing is paramount. The ability to break down complex ideas into clear, understandable prose is invaluable. Scientific literature has earned the reputation of being challenging to comprehend; you have the opportunity to alter that perception. Think of yourself as a storyteller, where the narrative is your research—articulating its essence, its significance, and the lessons it imparts. The impact of your work extends beyond the mere content; it’s profoundly influenced by the manner of your expression. It’s not just about what you say but how you say it. Crafting a compelling narrative necessitates a thorough understanding of the existing body of work. By delving into what has already been accomplished, you lay the groundwork for your unique contribution, setting the stage for your research to shine.


To get you started on your literature review, you need to first generate a reading list, a topic that we will dive into in the following chapter. 

7

Creating Your Reading List

The Role of Literature in Your Thesis

A comprehensive reading list serves as the bedrock of any scholarly research, playing a crucial role in informing and shaping the entire thesis process. First and foremost, it deepens your understanding of the subject, ensuring that you’re not reinventing the wheel but rather building upon or challenging established knowledge. By immersing yourself in a wide range of perspectives and findings, you gain a nuanced understanding of the topic, which allows you to formulate a more informed and robust argument. Furthermore, a well-curated reading list demonstrates your scholarly rigour and engagement with the field. It lends credibility to your work by showing that you’re conversant with the key texts and debates surrounding your research question. In essence, the more comprehensive your reading list, the more grounded and persuasive your thesis will be, reflecting a thorough engagement with your topic and positioning your work within the broader academic conversation.

When looking for articles, don’t limit yourself to just one source. Use various academic databases like Google Scholar, PubMed, JSTOR, and others relevant to your field. If you need a refresher on the various search engines visit the relevant content from last week titled “Navigating Search Engines & Databases” for a list of the most popular sources, their strengths and weaknesses along with the exercise on optimizing your search in Google Scholar. Here we will also discuss some strategies to help you refine your search.

Prioritize Your Reading

Identify and start with the seminal works in your field. These are often the most cited or discussed papers and will provide you with a solid foundation. However, you shouldn’t only rely on the number of citations a paper has. Conducting research and publishing articles is a long, long, process, so older articles typically are cited more. So ensure that you’re up-to-date with the latest research.

Identify and start with the seminal works in your field. These are often the most cited or discussed papers and will provide you with a solid foundation. However, while citation count can be a strong indicator of a work’s influence and relevance, it shouldn’t be your sole criterion. Keep in mind that academic publishing is a lengthy process, and consequently, older articles have had more time to accumulate citations. This can sometimes skew the perceived importance of more recent, yet potentially groundbreaking, studies. Therefore, it’s crucial to balance your focus between these foundational texts and the cutting-edge research that represents the latest developments in your field.

To stay updated on current trends and theories, actively seek out recent publications. Engage with contemporary journals, conference proceedings, and other platforms where scholars share their latest findings. This approach ensures that your research is not only grounded in the established knowledge base but is also informed by the most recent insights and innovations. By striking this balance, your work will reflect both a deep respect for the field’s history and a keen awareness of its current trajectory.

Seek Expert Recommendations

Begin by consulting with your supervisor, they are a field expert, so they can assist in creating an initial reading list for you. A good rule of thumb is to set the goal of reading at least one article per week but keep in mind that your supervisor may have different expectations. Be sure to discuss what they anticipate in terms of your reading schedule. Moreover, if possible, aim to discuss your readings with your professor. Arranging regular, weekly discussions with your professor to meticulously analyze and dissect your assigned readings can significantly enhance your understanding and perspective.

Additionally, engaging in dialogues with your peers and colleagues is invaluable. Often, the best resources come from a recommendation by someone who’s recently been deep in research. Should you encounter a peer delving into a related topic, consider forming a reading group. This collaborative approach can foster a dynamic exchange of ideas, critiques, and interpretations. Engaging with your readings in the company of motivated peers and lab members during regular sessions can yield rich, multifaceted insights, often sparking innovative ideas and approaches that solitary study might not reveal. Such interactive scholarly dialogues not only deepen your understanding but also strengthen the communal knowledge base, paving the way for collective breakthroughs and advancements.

Keep Your List Organized

Organizing your reading list may seem like a daunting task, but you will thank yourself for the effort when the time comes to write the introduction to your paper. Organizing your reading list offers a multitude of benefits that can significantly enhance your research process and overall understanding of your subject. Firstly, it brings clarity and structure to the vast array of information you encounter, helping you navigate through the literature more efficiently. By categorizing sources, you can quickly locate materials relevant to specific themes or methodologies, saving valuable time and reducing the overwhelm of handling numerous articles.

This organization also aids in identifying patterns, trends, and gaps in the literature, which are crucial for shaping your research question and methodology. Furthermore, a well-organized list encourages a deeper engagement with the material. It prompts you to think critically about how each piece fits into the larger puzzle of your research, fostering a more comprehensive and nuanced understanding of the topic. Additionally, it streamlines the writing process; with a structured reading list, you can easily access and cite sources, ensuring a smoother and more coherent development of your arguments and analysis. Ultimately, an organized reading list is not just a practical tool for managing resources but a strategic asset that enhances the quality and depth of your research. Here are a couple of strategies for categorizing your reading list:

  • By Themes
    • Look for overarching themes or topics within your research area. These could be theoretical perspectives, key issues, or common findings. Under each major theme, you might find sub-themes or more specific topics. This will help you navigate your list more efficiently when you’re looking for information on a particular aspect of your research. Moreover, creating themes can help inform and refine your search for more articles using keywords.
    • Benefit: This approach helps you see how different pieces of literature are connected and how they contribute to a broader understanding of your topic.
  • By Methodologies
    • Group your readings by the research methods they employ, such as qualitative, quantitative, mixed methods, case studies, etc. Pay attention to the results and conclusions drawn from these different methodologies. How do they compare or contrast?
    • Benefit: This organizational style is particularly useful if you’re still deciding on a research method, as it allows you to see the strengths and weaknesses of different approaches.
  • Chronological Order (Timeline of Research)
    • Arrange the literature from oldest to most recent. This helps you understand how the discourse has evolved. Pay attention to how theories, methodologies, and findings have changed. Are there any clear shifts or significant milestones?
    • Benefit: This approach gives you historical context and can help you identify seminal works that laid the groundwork for subsequent research.

Reference Management Tools

I strongly recommend using a reference management tool. These tools significantly simplify the tasks of organizing, searching, and citing literature, streamlining what can often be a complex and time-consuming process. One of the key advantages of such tools is their ability to make your reading list readily accessible across various devices. They typically offer synchronization and online backup features, ensuring that your valuable work is securely stored and effortlessly retrievable. Furthermore, these tools often support collaborative efforts, allowing you to share your library with colleagues and thus enhancing collective research endeavours. An additional, invaluable feature is their capability for note-taking. This allows you to annotate each source with personal insights and summaries, making it considerably easier to remember the relevance of specific materials to your research. Perhaps most impressively, these tools are equipped with advanced citation functionalities. They can adeptly format in-text citations and bibliographies in a multitude of styles, which not only saves you a significant amount of time but also greatly enhances the accuracy and consistency of your referencing. In essence, a reference management tool is more than just an organizational aid; it’s an integral component of efficient and effective academic research.

  Zotero Mendeley EndNote RefWorks Citavi
Strengths
  • Widely accessible without cost.
  • Known for its user-friendly interface.
  • Easily captures references directly from the web.
  • Benefits from a robust user community that offers plenty of help and add-ons.
  • Allows users to annotate PDFs directly within the application.
  • Includes a social network for academics, which can be great for collaboration and discovery.
  • Offers flexibility in how and where you access it.
  • Offers advanced features and customization options.
  • Strong integration for in-text citations and bibliography generation.
  • Excellent for organizing references for complex projects.
  • Accessible from any internet-connected device.
  • Generally easy to use and navigate.
  • Often available for free through university libraries.
  • Goes beyond reference management and allows for knowledge organization and task planning.
  • Strong support for academic writing.
Weaknesses
  • The free version has limited cloud storage.
  • May not have as many advanced features as some paid options.
  • The free version has storage limitations, which can be restrictive for heavy users.
  • Some researchers express concerns about data privacy and commercial ownership.
  • It is a paid software, which might be a barrier for some users.
  • Can be less intuitive for new users, requiring some time to master.
  • Being fully online, its performance can depend on internet connectivity.
  • Compared to EndNote, it might lack some advanced functionalities.
  • Limited platform support as it’s available only for Windows.
  • Requires time to learn and utilize its full range of features.

When choosing a reference management tool, consider factors like cost, ease of use, specific features you need, and the type of research project you’re undertaking. It’s also worth checking if your institution provides access to any paid tools. Each tool has its unique strengths and might cater to different user needs and preferences. Additionally, many institutions offer training sessions on how to use these tools effectively. Online tutorials and community forums are also great resources for tips and troubleshooting.

Expanding Your List

If your schedule allows, aim to read beyond one article weekly — the more you read, the more you’ll gain. Take the initiative to broaden your reading list in your spare time. This will involve honing your skills in navigating academic databases and journals to uncover further pertinent literature.

From personal experience, a valuable strategy is to begin your research journey with recently published review articles. These works provide a comprehensive overview of the current state of the literature, presenting the latest developments and debates in the field. They’re particularly beneficial as they translate complex research into more digestible summaries, giving you a clear and current picture of the topic. Additionally, the references in these review articles are a gold mine. They lead you directly to seminal and influential works that you might want to include in your reading list. By starting with a review article, you not only save time in understanding the broader context but also ensure you’re building your knowledge on a solid, up-to-date foundation.

Regularly Evaluate and Adapt

Keep your list dynamic and expect it to evolve as you dive deeper into your research and reading. The important thing is to get started with an initial list this week to get you reading. Regularly review and update your categories as your understanding of the topic deepens and your focus shifts. Understand that these academic publications form the foundation of your research. By actively and critically engaging with these works, you’ll be better equipped to craft a compelling narrative for your study, which will prove invaluable when you begin to write your introduction.


In the upcoming chapter, we will delve into effective strategies for note-taking, designed to maximize the benefits you derive from your literature review. This next segment aims to equip you with practical techniques that will enhance your ability to capture, organize, and assimilate key information, thereby enriching your overall research experience. Stay tuned for insightful guidance on honing this crucial skill.

8

Effective Note-Taking

Effective Note-Taking

Effective note-taking is essential when reading academic articles, as it helps you comprehend, retain, and organize information efficiently. Here are strategies to enhance your note-taking process, focusing on capturing key findings, methodologies, and insights:

  • Prepare Before Reading:
    • Skim the Article: Before diving into in-depth note-taking, it’s beneficial to first skim through the article to grasp the overall structure, argument, and primary points. Your approach to skimming may vary; you’ll likely find a method that works best for you. Personally, I start by quickly going through the introduction. Then, I alternate between the methods and results sections. This strategy allows me to generate my own hypotheses about the expected outcomes based on the various manipulations and conditions, which I then compare with the actual results. I save the discussion or conclusion for last, preferring to contemplate the results and form my own interpretations before considering the author’s perspective.
    • Set a Purpose: Determine what you want to get out of the article. Are you looking for specific information, understanding a methodology, or seeking theoretical insights?
  • Use a Consistent Format:
    • Template: Develop or use a pre-existing template that suits your needs. Include sections for the article’s citation, abstract summary, key findings, methodologies, insights, and personal reflections. At the end of this chapter, we have included a template that you may use to take notes.
    • Headings and Subheadings: Use headings and subheadings to organize your notes, mirroring the article’s structure or your template.
  • Capture Key Findings:
    • Paraphrase: Write down the main findings in your own words. This helps ensure you understand the content and can recall it later.
    • Quotations: When a specific turn of phrase is important, jot it down with quotation marks and note the page number for easy reference.
  • Understand and Note Methodologies:
    • Describe Methods: Note the research methods used and why they’re significant. Understanding the methodology provides context for the findings and can help you assess the study’s credibility.
    • Evaluate Suitability: Briefly assess whether the methodology is appropriate for the research questions posed.
  • Reflect on Insights and Implications:
    • Implications: Consider the broader implications of the research. How does it impact the field? What doors does it open for future research?
    • Connections: Draw connections to other works you’ve read, noting similarities, and differences, and how they fit together in the broader academic conversation.
  • Use Annotations and Highlighting:
    • Digital Tools: If you’re reading digitally, use annotation tools to highlight and add notes directly on the document.
      Physical Copy: If you prefer a physical approach, use highlighters and sticky notes to mark important sections and add side notes.
  • Summarize Each Section:
    • In Your Own Words: After reading each section, write a brief summary in your own words. This helps reinforce understanding and provides a quick reference for future review.
  • Ask Questions and Critique:
    • Engage Critically: Note any questions or critiques you have about the article. Is the argument convincing? Are there gaps in the methodology or findings?
  • Keep a Glossary:
    • Technical Terms: Keep a separate section or document for new terms and concepts. Define them in your own words and refer back to this glossary as needed.

By incorporating these strategies into your note-taking process, you’ll create a valuable repository of information that enhances your understanding and retention of academic articles. Whether you prefer a digital method or a physical notebook, the key is consistency and engagement with the material. Your notes will not only aid in comprehension but also serve as a foundational resource when writing your thesis or engaging in discussions.


An interactive H5P element has been excluded from this version of the text. You can view it online here:
https://ecampusontario.pressbooks.pub/craftingresearchnarratives/?p=200#h5p-4

9

Week 3 Exercises

An interactive H5P element has been excluded from this version of the text. You can view it online here:
https://ecampusontario.pressbooks.pub/craftingresearchnarratives/?p=175#h5p-8

IV

Week 4: Introduction to Experimental Design

As we venture into the fourth phase of your thesis project, it’s important to acknowledge the inherently diverse nature of thesis methodologies. Research, by its very essence, is a field of limitless approaches, techniques, and perspectives. Therefore, this chapter will not prescribe a one-size-fits-all methodology; rather, it will offer a broad overview, aimed at illuminating the vast landscape of potential research methods. Each thesis project is unique, and methodologies that work brilliantly for one may not apply to another. Different methods can indeed produce the same level of scholarly effectiveness in various contexts. Our aim here is not to funnel your project into a predetermined methodological framework, but to open your mind to the multitude of possibilities, providing general guidance, practical tips, and adaptable strategies.

As you embark on your undergraduate thesis project, it’s important to have realistic expectations about the nature of your research involvement. Typically, undergraduate students are not expected to design their experiments from scratch. More commonly, you will have the opportunity to join an existing project, where the methodology and experimental framework have already been established by experienced researchers.

This approach is pragmatic at the undergraduate level, as it allows you to focus on learning and applying research methods, data collection, and analysis within a structured environment. The design and conceptualization of experiments are often complex processes that require a depth of knowledge and experience usually expected at the graduate level. However, this does not diminish the importance of understanding research methodology for undergraduate students. Even if you are not responsible for designing an experiment yourself, comprehending the methodology behind your project is crucial. It enables you to effectively engage with the research, understand the rationale of the study, and critically analyze the results.

Having a solid grasp of the methodology will also enhance your ability to contribute meaningfully to the project. You’ll be better equipped to understand the scope of the research, the significance of the data collected, and the implications of the findings. Furthermore, this knowledge lays a strong foundation for any future research endeavours, especially if you decide to pursue graduate studies.

In essence, while the expectation to design an experiment is generally reserved for graduate-level thesis work, the understanding and appreciation of research methodology are invaluable at all levels of academic research. Your undergraduate thesis project is an excellent opportunity to develop these skills and prepare for more advanced research roles in the future.

Learning Objectives for this Week

  • Provide a broad overview of common research methodologies.
  • Offer practical tips and tricks for selecting and implementing methodologies.
  • Advise on critical considerations while crafting your research procedure.
  • Propose goals and exercises to assist you in navigating this crucial stage of your thesis project.
  • Remember, the methodology you choose is the backbone of your thesis — it should be carefully tailored to suit your specific research question and objectives. Let this chapter serve as a starting point for a journey of exploration, discovery, and scholarly innovation.

Understanding Methodology

At the core of any research project lies its methodology — the structured plan that guides how you collect, analyze, and interpret data. This section introduces you to the fundamental concepts of research methodologies, helping you understand their significance and how they shape the trajectory of your research.

Defining an Experiment

An experiment is a pivotal research tool designed to explore and establish causal relationships. At its core, an experiment involves the deliberate manipulation of one or more variables, known as independent variables, to observe and measure their impact on other variables, termed dependent variables.

This process is central to experimental research, as it allows researchers to infer cause-and-effect relationships. By carefully altering the independent variables and observing any corresponding changes in the dependent variables, scientists can make inferences about how one aspect influences another within a controlled setting. Experiments stand as a cornerstone of empirical research, providing a structured approach to test hypotheses and unravel the complexities of various phenomena.

Qualitative vs. Quantitative Methods

Understanding the distinction between qualitative and quantitative research methods is fundamental in choosing the right approach for your thesis. Each method has unique strengths, weaknesses, and applicability, depending on the nature of your research question.


An interactive H5P element has been excluded from this version of the text. You can view it online here:
https://ecampusontario.pressbooks.pub/craftingresearchnarratives/?p=219#h5p-9


Exploring Experimental Design Methods in Research

Research methodologies often hinge on the experimental design chosen, which is critical for the validity and reliability of the results. Among various approaches, three primary types of experimental designs stand out, each characterized by different strategies for utilizing control groups and participants. Below is an expanded and scientifically nuanced explanation of these designs:

  • Independent Group Design: In this design, different participants are assigned to different experimental conditions. This approach involves dividing participants into two or more groups, each receiving distinct treatment or conditions. The assignment to these groups is typically random, ensuring that each group is comparable in all aspects except for the variable being tested.
    • Example: Consider a pharmaceutical trial testing a new drug for treating high blood pressure or hypertension. Participants are randomly divided into two groups: one receives the new drug (experimental group), while the other receives a placebo (control group). In this scenario, each participant only takes either the drug or the placebo, not both. This design helps in evaluating the drug’s effectiveness by comparing results between the two groups.
  • Repeated Measures Design: This design involves the same participants experiencing all conditions of the experiment. The key advantage is that it requires fewer participants, as each one takes part in every aspect of the study. This design also eliminates individual differences as a confounding variable, since each participant serves as their own control.
    • Example: In a cognitive psychology study investigating the impact of sleep deprivation on memory, participants undergo a memory test both after a normal night’s sleep and after a night of sleep deprivation. The same individuals participate in both conditions, and their performance under each condition is compared. This allows researchers to assess the direct impact of sleep deprivation on memory within the same group of individuals.
  • Paired Comparison Design: This design pairs participants based on certain shared characteristics or demographics, and then assigns each member of the pair to different experimental conditions. It’s particularly useful when looking to control for specific variables like age, gender, or pre-existing conditions.
    • Example: In a study examining the effects of a new dietary supplement on athletic performance, researchers first assess participants based on fitness levels, age, and diet. Each participant is then matched with another who has similar characteristics. One member of each pair is given the supplement, while the other receives a placebo. By comparing performance changes within these matched pairs, researchers can more accurately attribute any differences to the supplement, controlling for other variables.
  • Factorial Design: This design allows for the investigation of multiple independent variables and their interactions to understand their combined effect on a dependent variable. Factorial design involves two or more independent variables, each with different ‘levels’ or variations. Often denoted as ‘2×2’ (i.e., two by two design), ‘2x2x3’, etc., where the numbers represent the levels of each independent variable. For example, a 2×2 factorial design has two independent variables, each with two levels.
    • Example: Suppose researchers are studying the effect of exercise intensity (low, high) and diet type (vegetarian, non-vegetarian) on weight loss. This would be a 2×2 factorial design. Participants are divided into groups based on each combination of these variables (e.g., low-intensity-vegetarian, low-intensity-non-vegetarian, high-intensity-vegetarian, high-intensity-non-vegetarian). Data on weight loss are collected from each group. Researchers then analyze not only the main effects of exercise intensity and diet type but also whether there’s an interaction effect (e.g., whether the effect of exercise intensity on weight loss differs by diet type).
  • Crossover Design: Here participants are exposed to more than one treatment in a sequential manner. This design is particularly useful in clinical trials where the same participants are needed to evaluate multiple treatments or interventions over different periods.
    • Example: In a clinical trial for evaluating two different medications for chronic pain, participants initially receive medication A for a specific period, followed by a washout period, and then receive medication B. The same process is then reversed for another group. This design allows each participant to serve as their own control, and the effects of both medications can be compared within the same individuals.
  • Longitudinal Design: Longitudinal designs involve repeated observations of the same variables over a prolonged period. This design is used to study changes over time and is particularly useful in developmental and sociological research.
    • Example: A study monitoring the cognitive development of children from infancy to adolescence. The same group of children is assessed at different ages to observe and analyze changes and trends in their cognitive abilities over time. This design helps in understanding developmental trajectories and identifying early predictors of later outcomes.
  • Sequential Design: These designs combine elements of both cross-sectional and longitudinal designs. Researchers observe different subsets of a population over time, allowing for the analysis of age-related changes within cohorts as well as between different cohorts.
    • Example: A study examining the impact of technology use on social skills in different age groups (e.g., teenagers, young adults, middle-aged adults) over several years. By comparing different age groups at multiple time points, researchers can discern patterns of change in social skills related to technology use across both age and time.

Choosing the right experimental design is crucial in research, as each design has its unique benefits and downsides. The choice largely depends on the nature of the research question, the practicality of conducting the study, and ethical considerations. Here’s a comparative look at the benefits and downsides of the three primary experimental designs:

Designs

Benefits

Downsides

When to Use

Independent Group Design
  • Minimizes Carryover Effects: Each participant experiences only one condition, avoiding issues like practice or fatigue effects that can occur with repeated testing.
  • Reduces Time per Participant: Since each participant is involved in only one condition, the time required for each participant’s involvement is less.
  • Simplifies Logistics: Managing groups can be more straightforward as there’s no need to coordinate multiple sessions for each participant.
  • Requires More Participants: To achieve statistical power, this design often needs a larger sample size compared to repeated measures.
  • Individual Differences: Variability between participants in different groups can influence results, potentially confounding the effects of the independent variable.
Choose this design when studying effects that could be influenced by participants becoming aware of the study’s purpose or when carryover effects (like fatigue or practice) could skew results.


Repeated Measures Design
  • Controls for Individual Differences: The same participants take part in all conditions, controlling for variability between different individuals.
  • Requires Fewer Participants: More efficient in terms of sample size, as each participant contributes data in all conditions.
  • Increased Power: More likely to detect a difference or effect if one exists, due to control over individual differences.
  • Carryover Effects: Participants’ experiences in one condition can influence their behaviour in subsequent conditions.
  • Participant Fatigue or Boredom: Repeatedly participating in a task can lead to reduced performance or engagement.
  • Time-Consuming: Requires more time from each participant, as they must participate in all conditions.
Opt for this design when controlling for individual differences is crucial, and when the risk of carryover effects can be minimized (e.g., through counterbalancing).
Paired Comparison Design
  • Controls for Individual Differences: By matching participants on key characteristics, this design aims to reduce variability between groups.
  • Reduces Carryover Effects: Like independent measures, participants experience only one condition, avoiding issues of order or practice effects.
  • Flexibility in Matching Criteria: Researchers can match participants on specific characteristics relevant to the study.
Time-Intensive Participant Selection: Finding and matching participants can be time-consuming and may limit the available pool of participants.

Imperfect Matching: It’s difficult to match participants perfectly, and unmatched variables can still confound results.

Increased Complexity: The design and analysis are more complex than independent group designs due to the matching process.

This design is suitable when individual differences are a significant concern, but repeated measures are impractical or carryover effects are a significant risk.


Factorial Design
  • Tests Interactions: Can examine how different variables interact with each other.
  • Efficient: Allows testing of multiple hypotheses in one study.
  • Comprehensive Analysis: Provides a more holistic view of the phenomenon under study.


  • Complexity in Design and Analysis: More difficult to design and requires advanced statistical analysis.
  • Higher Resource Requirement: Often requires a larger sample size to detect interactions.
  • Interpretation Challenges: The interaction effects can be complicated to interpret.


Effective when the research question involves understanding how different factors interact and influence the outcome, particularly in psychological and social sciences research.
Crossover Design
  • Individual as Own Control: Since the same participants are exposed to all conditions, individual variability is reduced. This means each participant serves as their own control, enhancing the reliability of the results.
  • Efficient Use of Resources: Requires fewer participants than parallel-group designs, as all participants receive both treatments.
  • Powerful for Detecting Treatment Effects: Enhanced sensitivity in detecting the presence and magnitude of treatment effects, as inter-subject variability is minimized.
  • Carryover Effects: One of the major concerns is the potential for carryover effects, where the effect of the first treatment influences the outcome of the second treatment.
  • Washout Periods: To mitigate carryover effects, adequate washout periods are needed between treatments, which can prolong the duration of the study.
  • Dropouts and Compliance: Participant dropouts can be more problematic as they affect both treatment arms. Ensuring participant compliance over an extended period can also be challenging.


Especially effective in clinical settings where two or more treatments are being compared, and the use of each participant as their own control can provide clear insights.

Useful in studies where behavioural or psychological responses are being observed, as the crossover design can reveal how the same individual’s responses vary under different conditions.

Longitudinal Design
  • Tracks Development and Change: Ideal for studying changes over time.
  • Identifies Patterns and Predictors: Can reveal patterns and predictive factors in development or behaviour.
  • Strong Temporal Sequence: Offers clear insight into cause-and-effect over a time


  • Time and Cost Intensive: Requires long-term investment in terms of time and money.
  • Attrition Risks: Risk of participants dropping out over time.
  • Potential for Repeated Testing Effects: Participants’ responses may be influenced by repeated testing.


Best suited for developmental, sociological, and psychological research where understanding change over time is essential.
Sequential Design
  • Comprehensive Data: Sequential designs offer a broad view of how certain traits or behaviours change both within individuals over time (longitudinal component) and across different age groups at a single point in time (cross-sectional component).
  • Efficient Aging and Cohort Analysis: This design efficiently distinguishes between age effects, cohort effects (differences due to cultural/historical context in which different cohorts grew up), and period effects (impact of events at a specific time affecting all cohorts).
  • Flexibility in Data Collection: It allows researchers to adapt their studies in response to early findings or external changes, such as societal shifts or technological advancements.


  • Complexity in Execution and Analysis: Managing and interpreting interwoven longitudinal and cross-sectional data can be challenging and requires sophisticated statistical methods.
  • Resource-Intensive: Similar to longitudinal studies, sequential designs can be time-consuming and expensive due to the extended duration of data collection and the need for large sample sizes.
  • Risk of Attrition: The long-term nature of the study can lead to participant dropout, impacting the validity and continuity of data.


Ideal for developmental and sociological studies that aim to understand how certain characteristics or behaviours develop over time and across different age groups.

Useful in research where comparing different cohorts is as important as observing changes over time within the same cohort.

In summary, the choice between these designs hinges on the research question, the practical constraints of the study, and the importance of controlling for individual differences versus the risk of carryover effects. Researchers must weigh these factors against the resources available, including time, the number of participants, and the feasibility of managing different experimental setups.

Qualitative vs. Quantitative Methods

Understanding the distinction between qualitative and quantitative research methods is fundamental in choosing the right approach for your thesis. Each method has unique strengths, weaknesses, and applicability, depending on the nature of your research question.


An interactive H5P element has been excluded from this version of the text. You can view it online here:
https://ecampusontario.pressbooks.pub/craftingresearchnarratives/?p=219#h5p-9

The Importance of Counterbalancing in Research

If you are interested in using within designs involving repeated measures or crossover designs, counterbalancing is a crucial technique used to control for potential order effects. Order effects can occur when the sequence in which treatments or conditions are presented influences the outcome, rather than the treatments themselves. Counterbalancing helps ensure that these order effects do not bias the results of a study.

Counterbalancing involves systematically varying the order of conditions or treatments across participants to neutralize order effects. It ensures that each condition is tested in each order position across the participant sample. This technique is designed to mitigate the effects of confounding variables such as fatigue, practice, or boredom, which can affect participant performance and skew results. By controlling for order effects, counterbalancing enhances the internal validity of an experiment. It also allows researchers to use repeated measures designs without the risk of order effects dominating the results. Especially in crossover designs, counterbalancing maximizes the use of data from all participants, as each participant contributes to multiple conditions. Types of counterbalancing include:

  1. Full Counterbalancing: Every possible order of conditions is used. Ideal for experiments with a small number of conditions, as the number of required sequences increases rapidly with more conditions.
  2. Partial Counterbalancing: Only a subset of all possible orders is used. This approach is often employed when full counterbalancing is impractical due to a large number of conditions.

Researchers need to consider the complexity added to the study design and analysis. Counterbalancing can introduce additional variables to be accounted for in data analysis. A potential disadvantage of the technique may require larger sample sizes to ensure that all order permutations are adequately represented.

Example: In a cognitive psychology experiment testing the effects of two types of memory aids, participants are subjected to both aids but in different orders. Group A uses Memory Aid 1 followed by Memory Aid 2, while Group B experiences them in the reverse order. This counterbalancing ensures that any observed effect on memory isn’t just due to getting accustomed to the testing process (practice effect) or fatigue towards the end of the experiment.

In essence, counterbalancing is an essential technique in experimental research, particularly when using within-subjects designs. Its proper implementation can significantly enhance the reliability and validity of research findings by ensuring that the effects observed are truly due to the experimental conditions and not the order in which those conditions were presented. As such, understanding and effectively applying counterbalancing is a key skill for researchers in designing robust and credible experiments.

10

Pre-Registration and Ethical Considerations

Once the basics of your methodology are sorted out, the next crucial step is to develop a comprehensive research plan. This plan should outline each phase of your project, from the initial planning stages to the final stages of data collection. Ensuring that every aspect of your methodology is meticulously planned and implemented is key to the success of your research. In this context, consider the option of pre-registering your study.

Pre-Registration

Pre-registration involves publicly declaring your research plan, including hypotheses, methodology, and analysis strategy, on platforms like the Open Science Framework (OSF) before data collection begins. Pre-registering a study offers several key benefits:

  • Enhances Transparency and Integrity: By declaring the research plan publicly beforehand, it prevents selective reporting and post-hoc hypothesis adjustments, fostering honesty in reporting results.
  • Improves Credibility: Pre-registration signals to the scientific community and readers that the research is conducted without bias, enhancing the study’s credibility.
  • Facilitates Clear Distinction Between Exploratory and Confirmatory Analyses: It helps differentiate planned analyses from those that are exploratory, adding clarity to the research process.
  • Increases Reproducibility: By providing detailed methodological plans, pre-registration aids other researchers in replicating the study, crucial for verifying results and advancing scientific knowledge.
  • Avoids Publication Bias: It helps in reducing publication bias, as the study’s existence and its core hypotheses and methods are recorded publicly before the results are known.
  • Builds Researcher Accountability: Knowing that their plan is publicly accessible can motivate researchers to adhere more strictly to their original study protocol.
  • Structured Planning: It encourages a more structured approach to planning your study, requiring a clear outline of your research objectives, methodologies, and analyses.
  • Timeline Management: Having a pre-registered plan helps in setting a realistic timeline for your research, ensuring that each phase of the study is allocated sufficient time.
  • Focus on Objectives: Pre-registration keeps the research team focused on the original objectives and hypotheses, reducing the likelihood of veering off course.
  • Efficient Resource Allocation: Knowing the research plan in advance allows for more efficient allocation and use of resources, including time, personnel, and materials.
  • Minimizes Last-Minute Changes: With a detailed plan in place from the start, there’s less likelihood of needing significant changes mid-study, which can disrupt organization and timelines.

Ethical Considerations

Most research, especially those involving human subjects require approval from the Research Ethics Board (REB) also known as an Institutional Review Board (IRB). The REB is responsible for reviewing and evaluating the ethical implications of proposed research to ensure it aligns with established ethical standards. Researchers must apply, often through an online portal, detailing the purpose of their study,  experimental design, and how they plan to address potential ethical issues among other factors. The REB plays a crucial role in the oversight of research, particularly research involving human participants. The primary purpose of an REB is to protect the rights, well-being, and dignity of research participants. It ensures that research is conducted ethically and responsibly, adhering to established standards and guidelines. The key functions of an REB include:

  • Risk-Benefit Analysis: The board evaluates the potential risks to participants against the potential benefits of the research. The aim is to minimize harm while maximizing the value of the research to society.
  • Informed Consent: The REB ensures that researchers provide clear, comprehensive information to participants about the nature of the study, their rights, and what participation involves. Participants should give informed consent, free from coercion or undue influence.
  • Ongoing Monitoring: Once a study is approved, the REB continues to monitor its progress. This might involve reviewing amendments to the study, handling complaints from participants, and ensuring ongoing compliance with ethical standards.
  • Promoting Ethical Standards: The REB also plays a role in educating researchers about ethical principles and practices, fostering a culture of integrity and respect for human rights in research.
  • Regulatory Compliance: The board ensures that research complies with local, national, and international ethical guidelines and legal requirements related to research involving human subjects.

By fulfilling these responsibilities, the Research Ethics Board safeguards the integrity of the research process, ensuring that scientific exploration advances in a manner that respects and protects individuals who contribute to this vital pursuit. When planning your research project, it’s essential to account for the time it will take to gain approval from your institution’s REB. The review process can be intricate, often requiring revisions and careful consideration of the reviewers’ feedback and concerns. Therefore, it’s wise to allocate at least a month in your data collection timeline for obtaining this ethical clearance. This foresight ensures you have sufficient time to address any required modifications to your application and prevents any unexpected delays in commencing your data collection phase. Therefore, plan your ethics application concurrently with your experimental design. Data collection cannot commence without ethical clearance, making it integral to your research timeline. If your research involves human participants, work closely with your supervisor to prepare the necessary documentation, including consent and debriefing forms. These documents must clearly outline the nature of the research, any potential risks, and the rights of the participants, ensuring informed consent.

Your Role in Ethics Applications

  • Undergraduate Students: Typically, undergraduates are not directly responsible for creating and submitting ethics applications. However, they are often involved in the research process under the supervision of a faculty member.
  • Graduate Students: At this level, students are more likely to take an active role in preparing and submitting ethics applications. This involves detailing the research methodology, potential risks to participants, and how these risks will be mitigated.

Even if you are not directly responsible for the submission, understanding the ethics approval process is crucial. It provides valuable insights into responsible research conduct and helps prepare you for future independent research projects. Moreover, learning to navigate the ethics application process is a highly regarded skill in academic and research settings. Involvement in this process can enhance a student’s desirability as a candidate for research assistant positions or future research roles.

Power Analysis: Determining the Number of Participants

Before initiating data collection for your study, it’s highly advisable to conduct a power analysis. This statistical process is essential for determining the minimum sample size required to reliably detect your effect of interest. Conducting a power analysis early in your research planning can ensure that your study is adequately powered, meaning it has a sufficient sample size to achieve statistically significant results if there is indeed an effect to be found. This step is crucial not only for the validity of your research findings but also for the efficient use of resources and ethical considerations in research conduct.


An interactive H5P element has been excluded from this version of the text. You can view it online here:
https://ecampusontario.pressbooks.pub/craftingresearchnarratives/?p=227#h5p-13


11

Writing an Effective Methods Section

The Methods section of your thesis paper is much more than just a part of your paper; it’s the foundation that supports your entire research. This section needs to provide a crystal-clear, detailed, and replicable roadmap of your study’s process. It’s a crucial aspect that speaks to the credibility of your work and enables others in the scientific community to replicate your research, a fundamental principle of scientific inquiry.

Many believe, and I concur, that the Methods and Results sections of a paper are somewhat easier to write compared to the more nuanced Introduction and Discussion sections. However, this doesn’t imply that crafting the Methods section is a walk in the park. In reality, it can present its own set of challenges. Due to its technical and descriptive nature, important details can often be missed or misconstrued. The aim of this chapter is to revitalize the Methods section, transforming it from what could be a dry and tedious segment into a compelling and insightful part of your thesis. By doing so, we hope to not only enhance the quality of your thesis but also improve its overall readability and impact.

Bit of a historical fun fact, but the Methods section is traditionally known as the “Materials & Methods” section. The traditional name served to highlight the two crucial aspects of the Methods section.

  1. “Materials” encompasses what was examined in the study, such as human subjects, animals, or tissue samples, as well as various treatments (like drugs or gases) and instruments utilized.
  2. “Methods” dives into the procedural aspects, detailing how subjects or objects were handled to address the experimental question, the methodologies of measurement and calculation, and the techniques used for data analysis.

In writing your Methods section, balance is key. While it’s important to provide enough detail for reproducibility, avoid unnecessary elaboration on well-established procedures. Always aim for clarity, precision, and a logical flow of information. To write a methods section devoid of confusion and ambiguity, a structured approach is often recommended:

Describing the Materials

Begin by detailing the materials used in the study, providing context for the environment in which the research was conducted.

    • Assessing the external validity of research involving human subjects hinges on accurately detailing the sample population’s demographic data, including age, gender, and racial composition. This allows for a better understanding of to whom the study results can be applied. Similarly, studies involving animal subjects must specify species, weight, strain, sex, and age. The Methods section should therefore meticulously describe the selection criteria and rationale for participant enrollment, shaping the boundaries of how the results can be generalized. Such detailed reporting ensures a comprehensive understanding of the research scope and enhances the study’s applicability and relevance to wider populations.
    • Moreover, when reporting your sample size, you are encouraged to provide a detailed explanation of your power analysis. This approach not only demonstrates the statistical robustness of your study but also justifies the number of participants used. By including this in your Methods section, you provide transparency about how your sample size was sufficient to achieve reliable and valid results, and how it contributes to the study’s overall credibility. This information is key in allowing readers and reviewers to understand the methodological decisions made and ensures the replicability of your research. If the power analysis was conducted post-hoc, this should be clearly stated. Including post-hoc analysis can be insightful, especially in explaining the study’s findings within the context of the actual sample size used. This transparency is vital for readers and reviewers to understand the limitations and strengths of your study’s design and statistical approach.
      • Make sure to specify the tools and statistical packages used for your power analysis. Mention and cite specific software like G-Power or the SuperPower package in R, detailing how they were employed in your study. Additionally, describe the measures used, such as effect size, to give a complete picture of your analysis process. The objective is to provide comprehensive information that enables readers to replicate your power analysis if desired, thereby enhancing the transparency and reproducibility of your research.

Elaborating on Preparation

When detailing your study’s preparation process in the Methods section, it’s essential to provide comprehensive information on how materials were prepared or procured.

  • If your study involves human participants, you may detail the steps from the moment participants enter the lab to their departure. Key aspects to cover are the process of obtaining consent, the instructions given to participants, and how they were compensated (whether through course credit, monetary payment, or other means). Additionally, it’s important to note whether participants were aware of any manipulations in the study or if they were debriefed afterwards. This level of detail not only enhances the transparency of your research process but also underscores the ethical considerations upheld throughout the study.
  • For animal studies, a thorough description of the use of sedation, anesthesia, their administration routes, and methods for evaluating their efficacy is necessary. All preparatory steps for animal or tissue use before the research should be described in detail to allow for reproducibility or assessment of their relevance by readers.
    • Also, include a statement confirming that your study has received the necessary ethical approval from your Institutional Review Board (IRB). This approval indicates that your study’s protocol aligns with the ethical principles governing research on living subjects. Without this ethical clearance, the integrity and legitimacy of the research are significantly compromised. Not only is conducting the research without such approval ethically questionable, but it also renders the study ineligible for publication in reputable, peer-reviewed scientific journals. The IRB’s approval is a fundamental requirement, ensuring that all research involving human or animal subjects is conducted responsibly and ethically.
  • In research involving drugs, always use the generic drug name and specify the manufacturer, concentration, dose, and infusion rate. Similarly, if your study uses medical gases, detail their concentration and flow rates.
  • If you’re employing a standardized preparation procedure or one adapted from another lab or study, and it’s well-documented in a publication easily accessible to your readers, you can maintain brevity in your methods section by citing this reference. This approach directs your readers to a detailed description of the procedure, keeping your section concise. However, it’s crucial to clearly outline any modifications or deviations you made from the original method. This option is recommended primarily when the method you are following is published and you have made only minor alterations. Accurately detailing these changes is important for transparency and helps maintain the integrity of your research.
    • Conversely, if your method is particularly unique or unconventional, be as detailed as possible, and consider validating it in a separate publication before submitting the main study. This approach not only establishes credibility but also enhances the reader’s understanding of the novel methodology’s applicability and reliability in your research.

Outlining the Research Protocol

The next step in the Methods section is to expand on the step-by-step procedures, from the initiation of the study to its completion, giving readers a clear roadmap of the experimental journey. Here you should chronologically trace the exact steps of the procedures, starting with baseline conditions and measurements, followed by the alterations of the independent variable and the corresponding measurements of the dependent variable. Additionally, it’s crucial to describe any clinical management aspects during the peri-experimental period not directly controlled by the protocol.


Measurement and Calculation Procedures

Next, specify the variables measured and the methods of measurement. Detailing the measurement instruments is key, including specifics like the manufacturer, model, and any calibration procedures undertaken. Furthermore, explain the rationale behind the choice of measurements, especially when measuring variables indirectly. It’s important to explicitly state when a particular value of a variable represents a specific state or condition. For example, you might specify that “A central venous pressure of ≥ 8 mm Hg was indicative of adequate intravascular volume status.” After describing the measurements, a comprehensive listing of all calculations used in the study should follow. This approach ensures that your research is replicable and that your methodology is transparent and understandable.

Data Analysis

The final step in the Methods section involves detailing how the data will be presented in the Results section. This includes specifying whether data will be represented as means, medians, or other statistical measures. Additionally, it’s important to outline the specific statistical tests that will be used for analyzing inferential data. This section should also define the p-value threshold that will be considered to indicate a statistically significant difference. By clearly describing these aspects, readers can better understand the analytical approach and interpret the findings in the context of the statistical methodologies used.

Practical Tips and Tricks:

  • Formatting Issues: Check if your department has specific formatting requirements for theses, such as APA, MLA, or Chicago style. This information can usually be found on the department’s website or in the student thesis handbook.
    • Make note of any specific guidelines related to font type and size, margin widths, citation style, and structure of the document.
    • If departmental guidelines are not specified, arrange a meeting with your thesis supervisor to discuss their expectations regarding formatting. Ask for clarity on details like preferred citation style, headings and subheadings format, and any other specific preferences they might have.
    • Pay special attention to the requirements for formatting the methods section. This may include guidelines on presenting figures and tables, describing procedures, and citing sources. Ensure that your current draft of the methods section aligns with these formatting standards.
    • It’s significantly more efficient to apply the correct formatting from the beginning rather than revising it later. Start formatting your document as per the guidelines as you draft each section. This approach will save you time and effort and will help maintain consistency throughout your thesis. Utilize available resources such as formatting templates provided by your university or department. Consider using reference management software like EndNote or Zotero to streamline the citation process.
  • Clarify the Rationale: Begin each segment by explaining why certain methods or materials were chosen. This could range from the choice of a specific chemical compound to your criteria for choosing study samples. Aim for clarity and brevity in your rationale; extensive explanations aren’t necessary. Generally, one to two sentences should be adequate to convey the reasoning behind your procedural choices. This approach keeps your Methods section clear, concise, and focused, preventing it from becoming unnecessarily lengthy. Remember, the goal is to be as informative as possible without overwhelming the reader with excessive detail.
  • Employ Visual Aids: Diagrams, flowcharts, and tables not only break the text’s monotony but also aid in the reader’s comprehension of complex procedures.
  • Learn from Existing Literature: This handy tip could significantly streamline your process: Study the methods section in recent publications from your supervisor. These sections are not just academically approved but have also been refined through peer reviews. Use them as a template to shape the structure and tone of your own methods section. However, it’s not about copying; it’s about learning from proven approaches and then adapting them to fit your study’s specific needs. Enhancing readability and transparency should be your goal, so feel free to modify and improve upon these examples. Additionally, exploring papers that employ methods similar to yours, or any well-written methods section you’ve encountered, can offer valuable stylistic insights. Remember, these existing works are not just guides; they’re springboards for your methodological creativity and precision.
  • Reporting Multiple Experiments: When documenting multiple experiments in your paper, it’s advisable to create distinct Methods sections for each, ensuring clarity and organization. However, if the methodologies across these experiments are largely similar, you can streamline your writing by stating that subsequent experiments followed the same materials, methods, and procedures as outlined initially. In such cases, focus only on detailing any variations or changes specific to each experiment. This approach aids in maintaining the conciseness of your paper, preventing redundancy and avoiding overloading your readers with repetitive information. Remember, the goal is to provide comprehensive yet succinct descriptions, enabling readers to understand the nuances of each experiment without unnecessary repetition.
  • Subsections: Dividing your Methods section into subsections can significantly enhance its readability and organization. Here are some commonly used subsection titles:
    • Study Design: Describing the overall framework of the research.
    • Participants: Detailing the demographic and selection criteria for subjects.
    • Materials/Equipment: Listing and explaining the tools and materials used.
    • Procedure: Outlining the step-by-step process of the experiment or study.
    • Data Analysis: Describing statistical methods and analysis techniques.

Common Pitfalls to Avoid:

  • Overlooking Details: Every aspect of your methodology should be clearly explained. Don’t assume the reader knows anything about your procedures.
  • Inconsistency: Ensure that the details in your Methods section align with what is presented in the Results and Discussion sections.
  • Seek Feedback: Seeking feedback is a vital step in refining your Methods section. It’s beneficial to regularly consult with your supervisor and peers, as they can provide valuable insights and help identify areas for improvement. I also recommend taking a step back from your work periodically. When you’re deeply immersed in writing, especially after numerous revisions, you might become accustomed to the content, potentially overlooking areas that need enhancement. By revisiting your Methods section after a break, you approach it with fresh eyes, which can reveal new perspectives. Additionally, consider obtaining feedback from individuals who are less familiar with your study. If they can comprehend your methods easily, it’s a good indication of the section’s clarity and effectiveness.

12

Week 4 Exercises

An interactive H5P element has been excluded from this version of the text. You can view it online here:
https://ecampusontario.pressbooks.pub/craftingresearchnarratives/?p=277#h5p-10

V

Week 5: Data Collection

As we reach the midpoint of our 10-week workshop, you’ve made significant progress in shaping your thesis project. By now, you should have:

  1. Refined Your Topic: Narrowed down to a specific area of interest that captivates and motivates you.
  2. Formulated Your Research Question: Developed a clear, concise question that guides your thesis.
  3. Conducted Extensive Reading: Engaged with a substantial amount of literature relevant to your topic, building a solid foundation for your research and keeping good notes.
  4. Held Regular Meetings: Maintained consistent check-ins with your supervisor, gaining valuable insights and guidance.
  5. Finalized Your Methodology: Collaboratively worked with your supervisor to establish a robust methodology for your study.

At this stage, it’s crucial to channel your efforts into the Methods section of your thesis. If you haven’t already started, now is the ideal time to draft the first version. For those who have a draft in place, focus on revising and refining it. Consider seeking feedback from peers, or your supervisor to enhance its clarity and effectiveness. Revisit the content from week 4 if you need a refresher on crafting an effective Methods section.

This week marks a slight change of pace. We’re not assigning any specific exercises, allowing you some breathing room. Instead, the primary objective for this week is to begin data collection. This phase is where your planning and preparation come to fruition, as you begin gathering the data that will form the backbone of your thesis. Remember, successful data collection hinges on meticulous adherence to your established methodology. 

Take this week to ensure that all logistical aspects of your data collection are in order, from ensuring the availability of necessary materials to confirming the schedule and process for data gathering. This pause in new tasks is an opportunity to focus on the practical implementation of your research, setting the stage for the insightful discoveries and analysis that lie ahead.

13

The Rewarding Experience of Data Collection

There’s something genuinely exhilarating about being part of data collection. It’s like having a backstage pass to the world of research. You’re not just reading about experiments; you’re conducting them. I remember in my first year as an undergrad, I signed up to participate in a few studies for extra credit. Walking into a lab – a place that required special access – was awe-inspiring. I was just a participant, but I couldn’t help but admire the student experimenter running the show. It struck me then – this is where I want to be.

And sure enough, a year later, I was part of that very team as a student experimenter, collecting data in the lab. Fast forward a few more years, and after completing my master’s, I was the one overseeing the lab and conducting experiments in that same room where I was once just a participant. It’s amazing how things come full circle.

So, whether you’re just starting or you’re knee-deep in your research journey, remember that your role in data collection is more than just a task. It’s a rite of passage in your academic career. It’s where you learn, grow, and transform from a learner to a leader.

The Role of Data Collection in Undergraduate and Graduate Research

As an undergraduate student engaged in research, the extent of your involvement in data collection can vary significantly based on several factors. These include the nature of the research, your level of expertise and availability, and importantly, your supervisor’s preferences and expectations. It’s crucial to have a clear conversation with your supervisor about the degree of involvement expected of you in the data collection process. In certain scenarios, especially in labs working with expensive equipment, hazardous materials, or requiring specialized technical skills, your supervisor might not anticipate direct involvement from you in data collection. However, it’s more common for undergraduates to be actively involved in this aspect of research, albeit not typically in the design phase of the experiment. The purpose of an undergraduate thesis is to get students in a lab and collect data, to provide them with first-hand experience in conducting research.  So depending on the lab you’re in, your level of involvement in this stage will vary. Participating in data collection is a fundamental component of the learning process, offering you a window into the practical world of academic research.

For graduate students, the expectation is generally to take a more hands-on approach to data collection. You should be prepared to be actively involved in the lab, managing and conducting data collection processes. If necessary, there’s often the possibility of seeking assistance from research assistants or enlisting the help of undergraduate students for larger projects. This not only facilitates the data collection process but also provides an opportunity for mentorship and leadership within the research environment.

14

Crafting a Timeline for Data Collection: Guidance for Students

Developing a realistic timeline for data collection is pivotal. This step is not merely about scheduling; it’s about foreseeing challenges, allocating resources, and ensuring the feasibility of your research. A realistic timeline reflects a deep understanding of the research process and demonstrates a commitment to maintaining the quality and integrity of your study. It’s crucial to consider factors like the availability of resources, the timing of participant recruitment, and any institutional deadlines or academic calendar constraints. If you haven’t done so already, you should clarify expectations concerning your involvement in data collection and how many hours of the week you are expected to be in the lab, or if there is a specific number of participants or subjects you should collect data from. Moreover, it may be likely that you are sharing resources with other lab members, so take this week to figure out any restrictions to consider for your timeline. Remember, a well-planned timeline is a roadmap to successful research execution. To create a timeline that accurately reflects your project’s needs, consider these key factors:

  1. Assessing the Study’s Scope: how extensive is your data collection? Are you using surveys, interviews, or experimental methods? Each approach has its own set of time requirements. For instance, surveys might need time for distribution and response collection, while interviews require scheduling with participants. Additionally, consider the availability of resources, such as equipment or lab space, and how this availability may affect your timeline. Finally, factor in time for unforeseen delays and challenges – it’s better to have extra time than not enough.
  2. Preparing for data collection: preparation is key to effective data collection. This involves not only fine-tuning your methods and tools but also ensuring you are well-versed in using them. If you are conducting interviews or surveys, pilot tests can be invaluable. They help in refining your questions and approach, ensuring clarity and effectiveness. For experimental methods, ensure you thoroughly understand and can operate any equipment needed. Also, prepare for data storage and management – decide in advance how and where you will store collected data to ensure its security and accessibility. This preparatory phase is integral to the smooth execution of your data collection and should be incorporated into your timeline.
  3. Flexibility & adaptation: While a timeline is essential, it’s equally important to maintain flexibility. Research is often unpredictable, and you may encounter challenges that necessitate adjustments to your plan. Be prepared to modify your timeline in response to these challenges. Regularly review and adjust your schedule as needed, and maintain open communication with your supervisor. They can provide guidance and help you navigate any obstacles, ensuring that your data collection stays on track despite any unforeseen circumstances. In essence, a successful data collection timeline is one that is well-planned yet adaptable, balancing structure with the flexibility to accommodate the dynamic nature of research.


Tips & Tricks to Keep in Mind

  • Create a Work Breakdown Structure (WBS): Break your project into smaller tasks and work packages, facilitating easier accomplishment of benchmarks.
  • Consider other commitments: Identify and factor in any other commitments, such as any upcoming exam dates, and plan accordingly.
  • Identify Dependencies: Understand which tasks depend on the completion of others, and sequence your tasks accordingly.
  • Establish Milestones: Set significant points in the project, like start and end dates, to ensure progress stays on track.
  • Compile Your Timeline: Use project management tools or charts to organize and visualize your project timeline, enforcing deadlines to maintain accountability.

Creating a well-thought-out timeline for your data collection is a roadmap to successful research execution. By integrating these detailed planning strategies and project management principles, you can set a realistic and adaptable timeline that enhances the efficiency and effectiveness of your research project.

15

Week 5 Exercises

An interactive H5P element has been excluded from this version of the text. You can view it online here:
https://ecampusontario.pressbooks.pub/craftingresearchnarratives/?p=305#h5p-12

VI

Week 6: Data Analysis and Results

Welcome back!

I hope you embraced the opportunity provided by last week’s content to recenter and rejuvenate. The slower pace was designed to offer you a chance to regroup, prepare, plan, and catch up on any outstanding tasks. By this point, you should have either completed or been well into the data-collection phase of your research. It’s important to remember that each research journey is unique, with its own set of timelines and milestones. If you haven’t yet completed data collection, there’s no need for stress or anxiety. As long as you’re making steady progress and staying aligned with your personalized timeline – and your supervisor is content with the pace of your progress – you’re doing exceptionally well.

As we move forward, the pace of our workshop will begin to accelerate. This week, our focus shifts towards understanding and preparing the results section of your thesis. We’ll start by revisiting the fundamentals of what a results section entails and explore the various types of analyses you can perform on your collected data. Here’s what to expect:

  • Understanding the Results Section: We’ll delve into the essentials of crafting a results section, including how to present your findings in a clear, concise, and logical manner. We’ll cover the importance of accurately representing your data without interpretation or bias.
  • Hands-on Practice with R-Studio: R-Studio, a widely used statistical software, will be our tool for data analysis practice. Even if you’re new to R-Studio, we’ll guide you through some basic exercises to build your confidence in using this powerful tool.
  • Drafting the Results: Armed with an understanding of data analysis and practical experience from R-Studio, you’ll start drafting your results. This initial draft doesn’t have to be perfect; focus on structuring your findings logically and ensuring all relevant data is included.

Remember, the results section is where your data speaks for itself. It sets the stage for the discussion section where you’ll interpret these findings. So, let’s dive into this crucial phase with enthusiasm and a keen eye for detail, laying a solid foundation for the next steps of your thesis project.


A Guide for Writing an Effective Results Section

The results section is arguably the hardest part of a paper to read, so it’s crucial to make it as readable, concise, and straightforward as possible. The primary goal of the results section is to present your findings in an unbiased manner, allowing readers to make assumptions, interpretations, and conclusions of their own before reading yours. Therefore, report your findings as they are, without inserting your interpretations or assumptions. Your role in this section is to present data, not to explain or interpret it. Here are some tips and tricks to enhance the effectiveness of your results section:

Understand Formatting and Style Requirements

Before you start writing the first draft of your results section, it is crucial to familiarize yourself thoroughly with any formatting requirements set by your institution or supervisor. These may encompass specific program-related requirements or particular expectations set forth by your supervisor that are essential to adhere to when preparing for submission. Compliance with these formatting guidelines is not just about adhering to academic standards; it also prevents unnecessary loss of marks in this relatively simple area.

Furthermore, it’s important to delve into the specific requirements of the citation style mandated for your thesis. Each citation style, be it APA, MLA, Chicago, or others, comes with its unique set of guidelines that dictate how to format various elements of your paper. This can include specific instructions for structuring your results section, such as how to format subheadings, the correct way of reporting numerical data, and the presentation of figures and tables. Adhering to these guidelines is not only about maintaining consistency; it’s also about enhancing the readability and professional appearance of your thesis. By paying close attention to these details, you ensure that your results section is not only informative but also impeccably presented, reflecting a high level of academic rigour and attention to detail. Therefore, it is essential to be thoroughly aware of these requirements, as they may differ from or contrast with some of the other guidelines mentioned below.

Reporting Required Statistics 

Ensure to include all necessary statistical information. Consult with your supervisor on what stats you should report. This typically includes but is certainly not limited to specific test statistics such as means, standard deviations, samples sizes (per condition in between designs), correlations between dependent measures in within designs, t-values or F-values in the case of t-tests or ANOVA, respectively, p-values, effect sizes and their confidence interval.

Note that the selection of these statistics depends on the type of data analysis conducted, but you sure ensure to state statistics for each analysis and understand the relevance of each statistic to your specific analysis and research questions. Moreover, make sure to follow the norms and expectations of your academic field regarding which statistics to report as well as the format in which they should be reported. This detailed statistical reporting is not only a mark of rigorous research but also allows other researchers to fully understand the scope and significance of your results. It contributes to the transparency and reproducibility of your research, which are foundational elements of scientific integrity.

Examine Other Papers

Examining the results sections of papers within your field, particularly those authored by your supervisor, can be incredibly instructive. Pay attention to how these sections are structured, the clarity and precision of the language, and the methods used to present data. This approach offers an excellent foundation for understanding how to format and craft your own results section. Remember, a thesis is not only a piece of research work but also an academic document that will be evaluated, so it’s important to align your writing with the expectations of your grader, who is most likely your supervisor.

Understanding the style and structure preferred by your supervisor can be particularly beneficial, as it reflects their academic standards and expectations. This insight can be invaluable when it comes to ensuring your work aligns with their grading criteria. Additionally, papers published in your field have usually undergone rigorous stages of peer review, making them exemplars of high-quality academic writing and research presentations. These papers represent the ‘best of the best’ in your field and serve as valuable resources for your work.

However, while drawing inspiration from these sources is encouraged, it’s crucial to maintain a clear boundary between inspiration and plagiarism. The goal is not to replicate a results section verbatim or simply insert your data into someone else’s structure. Instead, use these examples as a guide for developing your unique approach to presenting your findings. Look for ways they effectively communicate complex data, organize their results logically, and maintain reader engagement. By doing so, you’re not just copying a format; you’re learning from established methods and applying these insights to create a results section that is both academically rigorous and original in its presentation.

Be Clear and Concise

In writing the results section of your research paper, clarity and conciseness are key. Long, complex sentences can make it difficult for readers to grasp the main points of your findings. Remember, the goal is to communicate your research effectively, not to impress with sophisticated vocabulary or convoluted sentence structures. A research paper, particularly the results section, can already be challenging to navigate; your writing should aim to simplify the reader’s journey, not complicate it. Here are some tips for achieving clarity and brevity in your writing:

  • Simplicity is Strength: Use simple, straightforward language. Avoid jargon and complex words where simpler ones will do. The easier it is to read your results, the more effectively your research will be communicated. You should practice this in all aspects of your paper not just the results.

  • Short Sentences: Break down long sentences into shorter, more digestible ones. This helps in maintaining the reader’s attention and ensuring that your points are conveyed clearly.

  • Avoid Overuse of Technical Terms: While technical terms are sometimes necessary, overuse can alienate readers unfamiliar with the terminology. Aim for a balance between technical accuracy and accessibility.

  • Define Technical Terms: When you do use technical terms, make sure to define them. This practice ensures that your paper is inclusive, allowing readers from diverse backgrounds to understand your results.

  • No Ambiguity: Your results should be presented in a way that leaves no room for interpretation. Be specific and direct in your descriptions to avoid any potential confusion.

  • Use Footnotes for Additional Explanations: If you need to include technical terms or additional information but want to keep the main text concise, consider using footnotes. This way, readers interested in more detailed explanations can refer to them without interrupting the flow of your main text.

Present Data Logically

When organizing your results, it’s essential to arrange them in a sequence that mirrors the methodology you followed in your research. This organization can take various forms, such as a chronological order, which follows the timeline of your experiments or studies; a thematic arrangement, grouping results by specific themes or topics; or an order of importance, highlighting the most significant findings first. The key is to choose a structure that best suits the nature of your research and makes it easy for your reader to follow your thought process.

Be strategic and thoughtful in how you present your data. The progression of your results should feel natural and intuitive to the reader. When dealing with related analyses or follow-up experiments, it’s helpful to present them consecutively. This approach aids in maintaining coherence and allows readers to easily track the development of your research.

If your thesis involves multiple related experiments, consider using a consistent format for presenting your analyses. This consistency can be particularly beneficial when you want your readers to compare results across different experiments. For instance, you might decide that in the first paragraph of each section, you will discuss a specific analysis that was conducted across all experiments. This uniform structure guides your readers, enabling them to make comparisons more efficiently and grasp the full scope of your research.

Highlight Key Findings

While you should avoid interpretation, it’s important to indicate the key findings. This helps readers to understand the most significant results. The strategic choice of words in your results section can play a crucial role in guiding your reader through the complexities of your data. While maintaining impartiality and avoiding bias is essential, it’s equally important to help your reader understand the significance of your findings. To a researcher deeply involved in their work, the results might seem straightforward, but to an external reader, they can be challenging to decipher. This is particularly true when it comes to identifying which analysis or effect is most critical or most directly addresses your research question. To navigate this delicate balance, consider using specific words that subtly highlight the importance of certain analyses or effects without leading the reader to a biased conclusion. Here are some suggestions:

Notably It can be used to draw attention to a result that is particularly significant or surprising.
Noteworthy Similar to “notably”, this word suggests that a piece of information deserves special attention.
Significantly When used in the context of statistical results, this indicates that a finding is statistically significant and thus likely to be of interest.
Particularly Can be employed to emphasize a specific aspect of your results that is especially relevant to your research questions.
Crucially Use this word to signify that the information being presented is vital to understanding the overall context of your research.
Predominantly This helps highlight results that are most common or have a dominant effect on your data.
Importantly This term is useful when introducing a result or observation that is vital to the core of your research. It subtly tells the reader, “Pay attention, this is a critical piece of the puzzle.”
More important/importantly This phrase is often used to distinguish between findings of varying levels of relevance. It helps to prioritize information, suggesting that while all the presented results are valuable, some are particularly pivotal to the research aims or hypotheses.
Interestingly This can be used to introduce a result that is unexpected or provides a new perspective.

It’s important to use these words and phrases with discretion. Overuse or inappropriate use can detract from the objective tone that is expected in a scientific results section. The goal is to use these strategic words to guide your reader’s attention to the most critical parts of your data, enhancing their understanding of how your results tie into your overall research question. By doing so, you ensure that your results section is not only informative but also engaging and accessible to your audience.

Use Visual Aids Effectively

Effective visual aids, such as graphs, charts, and tables, play a vital role in enhancing the comprehension and impact of your results section. These aids should be designed with utmost clarity and precision to ensure they effectively communicate your data. Here are some general guidelines for creating and integrating visual aids into your results section:

  • Clarity and Precision: Your visual aids should be clear and precise. Ensure that graphs and charts are not overcrowded with data and that tables are neatly organized. The aim is to present information in a way that is easy to understand at a glance.
  • Proper Labeling: Every visual aid in your research paper must be properly labelled, with titles, axis labels, legends, and any essential explanatory notes. The goal is to craft each figure or table to be self-sufficient and comprehensively informative. This means that a reader should be able to understand the visual aid independently, without the need to constantly cross-reference the accompanying text in the results section. To achieve this level of clarity and autonomy in your visuals:
    • Clear Titles: Assign a clear and descriptive title to each visual aid, summarizing what it represents. This gives the reader a quick understanding of the content at a glance.
    • Detailed Axis Labels: Ensure that the axes of graphs are clearly labelled, including units of measurement where applicable. This provides context to the data being presented.
    • Informative Legends: Use legends effectively to explain symbols, colours, or patterns used in your visual aid. Legends should be concise yet comprehensive enough to make the visual aid understandable on its own.
    • Explanatory Notes: Where necessary, include brief notes or explanations within the visual aid as a figure caption to clarify any unusual or complex data presentations.
    • Considerate Layout: Arrange the elements within each visual aid in a logical, easy-to-follow manner. This includes the thoughtful placement of labels, legends, and notes to enhance readability.
  • Quality of Your Visual Aids: Ensuring the high quality of figures and tables in your research paper is crucial for effective communication of your data. This involves paying attention to several key aspects to ensure that the visuals are clear, legible, and aesthetically pleasing. Here are some points to consider:
    • High Resolution: Ensure that the resolution and quality of your visual aids are high enough for clear viewing, both in digital and printed formats. Blurry or pixelated visuals can make it hard for readers to discern details, leading to misunderstanding or misinterpretation of the data. They can also detract from the professionalism of your work.
    • Legible Text Size: The text in your tables, including numbers, titles, axis labels, and legends, should be of a size that’s easy to read. Avoid using font sizes that are too small, as this can make your tables difficult to decipher.
    • Clear and Readable Fonts: Use clear, professional fonts for all text in your visual aids. Avoid overly stylized fonts that might compromise readability.
    • Appropriate Scaling: Ensure that your figures and tables are appropriately scaled. This means avoiding overstretching or compressing images, as this can distort the data presentation.
    • Eye-friendly Colors & Accessibility: Choose colour schemes that are easy on the eyes. Avoid overly bright or clashing colours that can make the figures hard to look at and understand. Consider accessibility too; for instance, use colorblind-friendly palettes where necessary. Adding descriptive captions can also make your visuals more inclusive.
    • Adequate Spacing: In tables, ensure there is adequate spacing between columns and rows. Cramped tables can be challenging to read and may lead to data being overlooked or misread.
    • Contrast and Clarity: Ensure there is sufficient contrast between text and background colours. Low contrast can make text difficult to read, especially in graphs or charts.
    • Test Print: If your paper will be printed, test how your figures and tables look in print form. Sometimes, colours and details that are clear on a screen may not translate well to print.
    • Professional Software: Use professional-grade software for creating your visual aids. These tools offer greater control over the quality and formatting of your visuals.
  • Direct Relevance: Each visual aid in your paper must directly relate to and support the text. It should either illustrate or elaborate on the specific points you’re discussing in your narrative. Refrain from incorporating visuals that do not have a direct connection to your results, as irrelevant images can detract from the coherence of your work. Visual aids should also complement, not duplicate, the information in your text. They should provide an additional layer of understanding or a different perspective on the data, rather than simply repeating what has already been said. Additionally, if you’re using figures or images from external sources, it’s imperative to acknowledge these sources correctly. Proper citation not only respects intellectual property but also maintains the credibility and integrity of your research.
  • Referencing and Integration: When introducing a visual aid, refer to it explicitly in your text (e.g., “as shown in Figure 1”). This guides readers to the visual aid and emphasizes its importance in understanding your results. Moreover, position your visual aids close to the relevant text where they are discussed. This proximity helps readers to easily correlate the visual data with the written explanation.
  • Effective Data Presentation: Choose the right type of visual aid for your data. Effective data presentation is about selecting the most appropriate type of visual aid to communicate your data clearly and accurately. The choice of visual aid depends on the nature of the data you’re presenting and the message you wish to convey. Below is a brief guide on how to choose the right visual aid. Consider this information carefully and, if feasible, draft preliminary versions of various figures for comparison. Seek feedback from your peers, and more importantly, present these drafts to your supervisor. It’s crucial to finalize the type of visual aid you use in consultation with your supervisor to ensure it aligns with your research objectives and expectations.
TYPE USAGE ADVANTAGES DISADVANTAGES
Bar Charts It can be used to draw attention to a result that is particularly significant or surprising. Easy to understand, effective for comparing quantities across different groups. Not suitable for showing trends over time; can become cluttered if too many categories are included.
Line Graphs Best suited for displaying data trends over time. Use line graphs when your data points are connected continuously over intervals, such as months, years, or decades. They’re excellent for showing trends, increases or decreases, and patterns over time. Ideal for displaying trends over time, changes and developments. Can be misleading if the scale is not consistent; not effective for categorical comparisons.
Area Charts Similar to line graphs but with the area below the line filled in, they are useful for showing cumulative totals over time, especially when you want to compare several quantities. Simple and visually appealing for showing proportions in a dataset. Can be difficult to interpret accurately, especially with many small segments.
Pie Charts Effective for showing proportions and percentages within a whole. Use pie charts when you want to illustrate how different parts make up a whole, especially when you have a limited number of categories that add up to 100%. Useful for showing cumulative totals and comparing multiple quantities over time. Can be difficult to read if many layers are overlapped; less precise than line or bar charts.
Histograms Used for showing the distribution of a dataset. They are particularly useful when you want to demonstrate how frequently different values occur within a set range. Great for showing the distribution of data, easy to see common ranges or outliers. Can be confusing if bins are not chosen appropriately; may require statistical understanding to interpret.
Scatter Plots Ideal for showing relationships or correlations between two variables. Use scatter plots when you want to investigate whether a change in one variable might be associated with a change in another. Effective for showing the relationship between two variables; can identify correlations. Can be difficult to interpret with large data sets or outliers; correlation does not imply causation.
Maps Geographical maps are essential when location data is a key part of your research. They can be used to show spatial distributions, geographical trends, or location-specific data. This can include various types such as heat maps, choropleth maps, and others. Ideal for presenting geographical data, spatial distributions, or location-specific trends. Geographic biases or distortions can occur; this requires accurate data for effectiveness.
Tables Best for presenting raw data or when precise values are important. Tables are most effective when you need to present a large amount of detail in a small space. Can display large amounts of detailed data in a compact form; precise and straightforward. Can be overwhelming or boring to read; lacks the visual impact of charts and graphs.
Flow Charts Use flow charts to represent a process or a sequence of steps. They are particularly useful in explaining methodologies or sequential data. Excellent for mapping out processes or steps in a procedure; clarifies sequence and decision points. Can become complex and hard to follow with too many steps or branches.
Infographics Combine various types of data visualization (like charts, graphs, icons, and text) to present an overview of a topic. They are great for summarizing complex data or telling a data-driven story. Engaging and visually appealing; can summarize complex information quickly. May oversimplify data; requires good design skills to be effective.
Use Supplementary Material

Utilizing supplementary material, such as appendices or online supplements, is an effective strategy when you have an extensive amount of data that is important but too voluminous to include directly in the main results section of your paper. This approach helps maintain the clarity and focus of your results while still providing all necessary data for interested readers. Here’s how and why to use supplementary material effectively:

  • Preventing Clutter: Including too much data in the main body of your paper can overwhelm readers and detract from the key findings. By relocating detailed tables, extensive raw data, lengthy mathematical proofs, or additional figures to appendices or online supplements, you keep the main text focused and readable.
  • Enhancing Accessibility: Supplementary material makes your research more accessible and comprehensive. Readers interested in delving deeper can access the detailed data, while those seeking an overview can stick to the main results.
  • Improving Navigation: By placing less critical or more detailed data in appendices, you improve the navigational flow of your paper. This organization allows readers to easily find and understand the main results without getting lost in a sea of data.
  • Providing Additional Context: Supplementary material can include pilot data, additional experiments, extended methodologies, or datasets that provide context to your research, which might be of interest to specialists or other researchers in your field.
  • Referencing in the Main Text: Ensure that any supplementary material is appropriately referenced in the main text. Direct your readers to the specific appendix or online resource where they can find additional information.
  • Formatting and Organization: Just as with your main paper, any supplementary material should be meticulously organized and formatted to facilitate easy understanding. It’s crucial to include clear headings, labels, and explicit instructions for interpreting the data. Therefore, the same guidelines you apply to your main results section should extend to your appendices. Unfortunately, this section is often overlooked, which is a significant oversight. Remember, those who are most invested in and intrigued by your research are likely to delve into these supplementary materials, so it’s imperative to make a positive impression. Moreover, it’s essential to remember – and I’ll keep emphasizing this – that your thesis is a graded piece of work. Therefore, it’s vital to maintain the same level of professionalism and attention to detail in your supplementary materials as you do in your results section.
  • Online Supplements: This particular point may not necessarily apply to your thesis project, but if one of your goals is to submit your thesis manuscript for publication (i.e., you’re completing a sandwich thesis) then this might be a benefit worth considering. In the digital age, many journals allow or encourage the submission of online supplementary materials. These can include interactive data sets, extended multimedia content like videos or audio files, and additional resources that enhance the reader’s understanding. Moreover, if you’re submitting your paper to a journal, make sure to adhere to its guidelines regarding supplementary materials. Some journals have specific rules about what can be included and how it should be formatted.

In summary, supplementary materials are an excellent way to present comprehensive data without compromising the readability and coherence of your main results section. They allow for a depth of exploration and understanding while keeping your paper streamlined and focused on the key messages.

Proofread and Seek Feedback

Before finalizing your thesis, it is critical to meticulously review your results for both data accuracy and clarity in presentation. Reporting intricate details, especially numerical data, is prone to small errors, which can significantly impact the credibility of your research. Even minor inaccuracies can undermine the trustworthiness of your findings and affect the overall integrity of your work.

Furthermore, obtaining feedback from your supervisor and peers is an essential step in the refinement process. As an expert deeply involved in your research, you might find that your results section and visual aids appear completely logical and comprehensive. However, this perspective can be influenced by your familiarity with the subject matter. Your supervisor, with their experience and knowledge, can offer invaluable insights and advice, helping you to ensure that your research is communicated effectively. They are likely to have a keen eye for nuances that make your results both accessible and scientifically rigorous.

Equally important is feedback from your peers, particularly those who are not as familiar with your research. Their fresh perspective can be instrumental in identifying aspects of your presentation that might be confusing or unclear. They can point out areas where more explanation is needed or where the flow of information could be improved. This type of feedback is crucial because it helps you gauge how well your research can be understood by a broader audience, beyond experts in your field.

In summary, a thorough double-check of your data and presentation, coupled with feedback from both your supervisor and peers, is indispensable. This process not only enhances the accuracy and clarity of your results but also ensures that your research is communicated in a manner that is comprehensible and meaningful to a diverse audience. By embracing this collaborative approach, you can significantly elevate the quality and impact of your research paper.


Concluding Remarks

Crafting a results section is, in many ways, an art form. It requires a balance between clarity, organization, and the strategic presentation of data. Being a good researcher is as much about effective communication as it is about conducting quality research. Your responsibility extends beyond discovering new knowledge; it includes making sure that others can understand and build upon your findings. Ensuring that your results are accessible and comprehensible is a crucial part of this process.When crafting your results section, your goal should be to lead your readers through your research journey in a way that is logical, coherent, and easy to understand. By carefully structuring your results section, you not only convey your findings effectively but also enhance the overall impact and credibility of your research. Remember, the results section is where you present the ‘what’ of your research. Save the ‘why’ and ‘how’ for the discussion section. By following these guidelines, your results section will effectively convey your findings in a clear, concise, and unbiased manner, setting a strong foundation for your discussion and conclusions.

I strongly recommend engaging in a detailed discussion with your supervisor regarding the appropriate measures of effect size to report in your research. I've included an optional, yet highly beneficial reading that offers in-depth insights into various effect size measures, their objectives, calculation methods, and the most opportune scenarios for their inclusion. This paper promotes a standardized approach for reporting effect size measures across diverse disciplines. Such standardization is pivotal for advancing cumulative scientific knowledge and enhancing both reproducibility and transparency in research. For the interested reader the paper is cited here: Lakens D. Calculating and reporting effect sizes to facilitate cumulative science: a practical primer for t-tests and ANOVAs. Front Psychol. 2013;4:863. Published 2013 Nov 26. doi:10.3389/fpsyg.2013.00863

16

Thesis Success with R-Studio: A Step-by-Step Tutorial and Practical Analysis Examples

This comprehensive tutorial is designed specifically for thesis students such as yourself, eager to harness the power of R programming to elevate your thesis project. Whether you’re new to coding or looking to enhance your skills, this guide will walk you through the fundamentals of R, empowering you to confidently tackle basic analyses and create impactful visualizations. From data manipulation to insightful graphs, you’ll gain the essential tools needed to enhance the depth and rigour of your research. Join us on this exciting learning adventure as we equip you with the skills to navigate R’s landscape, unravel complex datasets, and transform your thesis into a compelling narrative backed by robust data analysis. Let’s dive in and unlock the full potential of R for your academic success!

This document can act as a stand-alone guide that you read through at your own pace.

Preparing Your Work Space

Let’s begin by downloading and loading all the required libraries!

R packages or libraries enhance R’s capabilities. You can think of them as a tool box that carries a specific set of tools or in this case code functions for specific jobs. Here I’ve listed some basic ones that will suffice for the scope of this exercise.

You can install a package with:

install.packages("package_name")

You can load and use the package with:

library(package_name)

This grants you access to its functions However, instead of running these two functions over and over again for each library, I use the code included below. I find it to be especially useful when I share my code with others. This code checks to see if any of the packages specified in the list “my_packages” is downloaded or not, and if a package is not installed, then proceeds to download it.

# List your required packages
my_packages <- c("tidyverse", "rstatix", "readxl", "xlsx", "effectsize", "emmeans", "kableExtra", "grid", "gridExtra", "ggpubr", "ggplot2", "ggsci", "cowplot", "devtools")

# Extract packages from the list that are not already installed
not_installed <- my_packages[!(my_packages %in% installed.packages()[ , "Package"])] 

# Install packages that are not already installed
if(length(not_installed)) install.packages(not_installed)

# Load the required libraries
library(tidyverse)    # for data manipulation 
library(rstatix)      # for statistical analyses
library(readxl)       # to read excel files
library(xlsx)         # to create excel files
library(effectsize)   # to calculate measures of effect size
library(kableExtra)   # formatting printable html ANOVA tables 
library(ggpubr)       # for making plots & figures
library(ggplot2)      # for making plots & figures
library(grid)         # for organizing multiple plots 
library(ggsci)        # for Scientific Journal and Sci-Fi Themed Color Palettes for ggplot2
library(gridExtra)    # to arrange multiple grid-based plots on a page
library(cowplot)      # for making plots and figures; an add-on to ggplot

Writing and Running R Code: Writing code in RStudio is simple. You can do so in the console, by typing the code then hitting the “return’ button. Or here in the source. To run one line of code, place your cursor on it and press Ctrl + Enter (Windows/Linux) or Command + return (macOS). You can also run multiple lines together by highlighting the lines and hitting the keys. There’s also the run option at the top which tells you which shortcut keys correspond to the command. Nevertheless, if you forget the keys, you can use the run option above. To run an entire Chunk of code and see the output, hit the little green arrow beside it.

Tips (Basic R Syntax):

  • You can assign values to variables using the <- operator.
  • Use the # symbol to create a single-line comment.
  • Anything following the # symbol on the same line is considered a comment and is not executed by R.

Setting Up Your Working Directory

With our libraries secured and loaded, we need to set up our working directory and load our dataset. Please download the required dataset for these R exercises by clicking on this link.

On your computer create a folder where you will store all of the datasets for this exercise. Save your current R session to this folder as well.

Next, we must set the working directory of our current R studio session to this folder. This is also the folder where we would want the results of our analyses exported. You may set up your working directory with code using the function “setwd()”, which requires you to input the full directory address, which is hard to find, especially on an Apple device. But we can pair it with another function, “setwd(file.choose())” which allows us to pick from our desktop the folder we wish to set as our working directory. The output of this function will be the full file path, that you can use in the “setwd()” function to avoid picking your file in future runs of the same code.

You can also set your working directory through RStudio’s menu. At the top of the screen click on the “Session” tab, then among the options hover over “Set Working Directory” then pick “Choose Directory” and simply choose your designated file with the datasets.

Once you do this, in the Console, the output you see will be the path to your file which you can copy and paste into the “setwd()” code so you can avoid the manual work the next time you run through your code.

Tip: When naming files, use underlines “_” instead of empty spaces. This makes it easier to load data by name. 

17

RStudio Workshop: T-Tests

T-tests in R are one of the most common tests in statistics and are used to figure out if there’s a real difference between the averages of two groups. There are two types: one for comparing two separate groups and one for comparing two related groups. To use a t-test correctly, there are assumptions to keep in mind which I have listed below, along with the appropriate tests and corresponding codes you can use to check for them. However I will not be diving too much into them, they’re here for you to read through on your own. But you should speak with your supervisor regarding these assumptions and check for them if you are concerned with your data violating them. Remember, while it’s good to follow these rules, sometimes you can still get useful results even if you don’t follow them exactly. Just be careful and think about what your numbers mean before you start comparing them.

  • Normality: The group data you collect should be spread out in a certain way that makes sense, and should follow a roughly normal distribution which is shaped like a bell curve. This is more important when you have only a small number of data points (less than 30).
  • You can visually inspect the normality of your data using histograms, density plots, or Q-Q plots. For a more formal test, you can use the “Shapiro-Wilk test shapiro.test()” function or the “Anderson-Darling test ad.test()” function from the “nortest” package.

Shapiro-Wilk test for normality shapiro.test(data_vector)

Anderson-Darling test for normality (install and load "nortest" package) ad.test(data_vector)

  • Homogeneity of Variance (Equal Variances): If you’re comparing two different things, the numbers you collect should be similar in terms of how much they spread out. This assumption is essential for the validity of the independent samples t-test. Some variations of the t-test allow for unequal variances.
  • To test the homogeneity of variances between two groups, you can use Levene’s test leveneTest() function from the “car” package or Bartlett’s test bartlett.test() function from the base R. Levene’s test for homogeneity of variances ç) leveneTest(data_vector ~ group_variable)
  • Bartlett’s test for homogeneity of variances

bartlett.test(data_vector ~ group_variable)

Remember to replace “data_vector” with your actual data and “group_variable” with the variable, or column name in the data file that defines your groups. It’s important to note that these tests can be sensitive to sample size and may not always provide conclusive results. It’s a good practice to complement formal tests with visual assessments of your data, such as plots, to make informed judgments about the assumptions. Additionally, if your data violates the assumptions, you might consider using robust alternatives or non-parametric tests that are less sensitive to these assumptions.


ONE-SAMPLE T-TEST

Used to compare the mean of one sample to a known standard (or theoretical/hypothetical) mean (μ). It allows you to answer the following research questions:

  1. Whether the mean of the sample is equal to the known mean?
  2. Whether the mean of the sample is less than the known mean?
  3. Whether the mean of the sample is greater than the known mean?

For example: let’s say we wanted to test whether the annual revenue for a branch of Starbucks was less than the usual amount (mu or μ = 900 K).

Using a function from the “readxl” library, we will load the excel file “OneSampleT_Test.xlsx” in R under the data_vector name “starbucks_rev”.

Tip: You can import and work with various data file formats (e.g., CSV, Excel, JSON) directly in RStudio using functions like read.csv() or read_excel().

starbucks_rev <- read_excel(file.choose())
# or
starbucks_rev <-read_excel("OneSampleT_Test.xlsx")

Computing Summary Statistics

Let’s first compute some summary statistics of our data!

# Statistical summaries of monthly revenue
summary(starbucks_rev$monthly_rev)

## Min. 1st Qu. Median Mean 3rd Qu. Max.
## 644201 666112 679089 680923 700306 723093

Here:

  • Min.= the minimum value in the column
  • 1st Qu. = the first quartile. 25% of values are lower than this.
  • Median = the median value. Half the values are lower; half are higher.
  • 3rd Qu. = the third quartile. 75% of values are higher than this.
  • Max.= the maximum value

Visualization

Now that we have summarized our data, let’s make some plots.

Before doing so, this next code here is a little plot aesthetics cheat sheet I like to use when generating my plots. I copy and paste this code into all of my R scripts, it just makes the process of designing plots easier.

For a more comprehensive overview of all ~600 colours go to: Colours in R

# No margin around chart
par(mar=c(0,0,0,0))

# Empty chart
plot(0, 0, type = "n", xlim =c(0, 1), ylim =c(0, 1), axes = FALSE, xlab = "", ylab = "")

# Settings
line <- 25
col <- 5

# Add color background
rect(
rep((0:(col -1)/col),line) ,
sort(rep((0:(line -1)/line),col),decreasing=T),
rep((1:col/col),line) ,
sort(rep((1:line/line),col),decreasing=T),
border = "white" ,
col=colours()[seq(1,line*col)])

# Color names
text(
rep((0:(col -1)/col),line)+0.1 ,
sort(rep((0:(line -1)/line),col),decreasing=T)+0.015 ,
colors()[seq(1,line*col)] ,
cex=1)

image

# This code will generate the chart of shape types
df_shapes <-data.frame(shape = 0:24)
ggplot(df_shapes, aes(0, 0, shape = shape)) +
geom_point(aes(shape = shape), size = 5, fill = 'red') +
scale_shape_identity() +
facet_wrap(~shape) +
theme_void()

image

# This code will generate the chart of line types
par(mar=c(0,0,0,0))

# Set up the plotting area
plot(NA, xlim=c(0,1), ylim=c(6.5, -0.5),
xaxt="n", yaxt="n",
xlab=NA, ylab=NA )

# Draw the lines
for (i in0:6) {
points(c(0.25,1), c(i,i), lty=i, lwd=2, type="l")
}
# Add labels
text(0, 0, "0. 'blank'" , adj=c(0,.5))
text(0, 1, "1. 'solid'" , adj=c(0,.5))
text(0, 2, "2. 'dashed'" , adj=c(0,.5))
text(0, 3, "3. 'dotted'" , adj=c(0,.5))
text(0, 4, "4. 'dotdash'" , adj=c(0,.5))
text(0, 5, "5. 'longdash'", adj=c(0,.5))
text(0, 6, "6. 'twodash'" , adj=c(0,.5))

image

ggplot(starbucks_rev, aes(x=Month, y=monthly_rev, group = 1)) +
geom_line(color='saddlebrown', linewidth=1, linetype='dashed') +
# here we are designing what the lines look like, consult the cheat sheet
# above for line options
theme_pubr() +#changes overall look of the plot there are many theme options
geom_point(shape=9, color='seagreen3', size=5) +#here we are designing how
# we want each points on the plot to look like. Consult the cheat sheet in the
#code chunk above for different point shapes.
labs(x = "Month Number", y = "Gross Monthly Revenue (CADs)",
title = "Starbucks Branch #4312 Annual Sale")

image

If you are interested in the design aspect of ggplots such as the different themes or other customization options I recommend the following guide ggplot2 themes and background colours

# Bar plot
ggplot(starbucks_rev, aes(x=Month, y=monthly_rev, fill=as.factor(Month)) ) +
geom_bar(stat = "identity") +
theme_pubr() +
theme(legend.position="none") +
labs(x = "Month Number", y = "Gross Monthly Revenue (CADs)",
title = "Starbucks Branch #4312 Annual Sale")

image

ggboxplot(starbucks_rev$monthly_rev,
ylab = "Monthly Revenue (CADs)", xlab = "Months",
ggtheme =theme_pubr())

image

Computing a One Sample T-Test

# Lets compute the t-test
t.test(starbucks_rev$monthly_rev, #a numeric vector containing our data values
mu = 900000, #the theoretical mean. Default is 0 but you can change it.
#For our example, in 2022 the average annual revenue for a single store was 900K so we will set
#that up.
alternative = "less") #the alternative hypothesis. Allowed value is one ## One Sample t-test

## data: starbucks_rev$monthly_rev
## t = -33.013, df = 11, p-value = 1.176e-12
## alternative hypothesis: true mean is less than 9e+05
## 95 percent confidence interval:
## -Inf 692840.8
## sample estimates:
## mean of x
## 680923

# of “two.sided”(default), “greater” or “less”.

Interpreting Results The result of the t.test() function is a list containing the following components:

  • statistic = the value of the t-test statistics
  • parameter = the degrees of freedom for the t-test statistics
  • p.value = the p-value for the test
  • conf.int = a confidence interval for the mean appropriate to the specified alternative hypothesis.
  • estimate = the means of the two groups being compared (in the case of independent t-test) or difference in means (in the case of paired t-test).

Reporting The p-value of the test is 1.176e-12, which is less than the significance level alpha = 0.05. Therefore, we can conclude that the annual income of the Starbucks branch is significantly less than the typical amount ($900K) with a p-value = 1.18 10^{-12}.


UNPAIRED TWO-SAMPLE T-TEST

What if you wanted to compare two sample means?

For example, suppose that we have asked 100 individuals: 50 Adolescents (13-18 years) and 50 Adults (18+ years in age) to keep track and report the number of times they’ve visited Starbucks in a given month. We want to know if the mean number of visits for adolescents is significantly different from that of Adults.

An unpaired sample t-test allows you to investigate the same type of research questions as you did with a one sample t-test, however, instead of having a known mean, you are comparing the mean of two sample groups you’ve likely gathered data from.

# Importing data set
t2data <-read_excel("TwoSampleT_Test.xlsx")
# If .txt tab file, use this read.delim()
# Or, if .csv file, use this read.csv()

# Lets check our data
head(t2data) #looking at the first 6 rows of data

## # A tibble: 6 × 2
## Group StarbucksRun
## <chr> <dbl>
## 1 Adolescents 26
## 2 Adolescents 16
## 3 Adolescents 16
## 4 Adolescents 23
## 5 Adolescents 24
## 6 Adolescents 20

# Or print all data
print(t2data)

## # A tibble: 100 × 2
## Group StarbucksRun
## <chr> <dbl>
## 1 Adolescents 26
## 2 Adolescents 16
## 3 Adolescents 16
## 4 Adolescents 23
## 5 Adolescents 24
## 6 Adolescents 20
## 7 Adolescents 23
## 8 Adolescents 23
## 9 Adolescents 22
## 10 Adolescents 19
## # ℹ 90 more rows

# Compute summary statistics by groups:
group_by(t2data, Group) %>%
summarise(
count =n(),
mean =mean(StarbucksRun, na.rm = TRUE),
sd =sd(StarbucksRun, na.rm = TRUE) )

## # A tibble: 2 × 4
## Group count mean sd
## <chr> <int> <dbl> <dbl>
## 1 Adolescents 50 21.8 5.14
## 2 Adults 50 17.5 9.03

Visualization

# Bar plot
ggplot(t2data, aes(x=Group, y=StarbucksRun, fill=as.factor(Group)) ) +
geom_bar(stat = "identity") +
theme_pubr() +
theme(legend.position="none") +
labs(x = "Group", y = "Number of Starbucks Runs in a Month")

image

ggboxplot(t2data, x = "Group", y = "StarbucksRun",
color = "Group", palette =c("lightblue3", "pink2"),
ylab = "Number of Starbucks Runs in a Month", xlab = "Group")

image

# Compute t-test
t.test.2 <-t.test(StarbucksRun ~ Group, data = t2data,
alternative ="two.sided", #the alternative hypothesis.
#Allowed value is one of “two.sided” (default), “greater” or
# “less”. You may choose one depending on the type of
# research question you are posing.
var.equal = TRUE) #a logical variable indicating whether to
# treat the two variances as being equal. If TRUE then the pooled variance is
# used to estimate the variance otherwise the Welch test is used.

t.test.2

##
## Two Sample t-test
##
## data: StarbucksRun by Group
## t = 2.9139, df = 98, p-value = 0.004422
## alternative hypothesis: true difference in means between group Adolescents and group Adults is not equal to 0
## 95 percent confidence interval:
## 1.365205 7.194795
## sample estimates:
## mean in group Adolescents mean in group Adults
## 21.76 17.48

The p-value of the test is 0.004422, which is less than the significance level alpha = 0.05. We can conclude that an Adolescent’s average visit to Starbucks is significantly different from that of an Adult with a p-value = 0.004.

Note that here we used a t-test to determine whether the means of the two samples are different, which are called two-tailed tests. The following are examples of one-tailed t-tests:

  • If we wanted to test whether the average Adolescent’s Starbucks run is less than that of an Adult’s we can use the following code:

t.test(StarbucksRun ~ Group, data = t2data, var.equal = TRUE, alternative = "less")

  • If we wanted to test whether the average Adolescent’s Starbucks run is greater than that of an Adult’s we can use the following code:

t.test(StarbucksRun ~ Group, data = t2data, var.equal = TRUE, alternative = "greater")


18

RStudio Workshop: Analysis of Variance (ANOVA)

ANOVA stands for Analysis of Variance, and it is a statistical technique used to compare the means of three or more groups to determine if there are statistically significant differences between them. ANOVA helps you understand whether the observed differences in means are likely due to genuine effects or if they could have occurred by chance.

The fundamental concept of ANOVA involves splitting the overall variation seen in the data into two parts: one related to differences between groups and the other reflecting differences within groups. When the variation between groups is notably greater than the variation within groups, it indicates notable distinctions among the means of the groups.

There are different types of ANOVA, including one-way ANOVA (comparing means of one factor across multiple groups) and two-way ANOVA (examining the influence of two factors on a response variable). ANOVA helps you understand the variability in data and whether it is significantly influenced by different groupings or factors.

The assumptions of an ANOVA are similar to those of a t-test, but they apply to multiple groups. The main assumptions are:

  • Independence: Observations within each group are independent of each other. Independence assumption is typically based on the experimental design and isn’t directly tested statistically so consult with your supervisor if you’re worried about violating this assumption
  • Normality: The residuals (differences between observed and predicted values) are approximately normally distributed within each group.
    • Visual Inspection: Create histograms or Q-Q plots of the residuals for each group. If they look like bell curves, normality is likely met.
    • Use “shapiro.test()” to perform a Shapiro-Wilk normality test on residuals for each group.

#Shapiro-Wilk normality test for Group 1

shapiro.test(residuals_group1)

#Shapiro-Wilk normality test for Group 2

shapiro.test(residuals_group2)

#Repeat for other groups

  • Homogeneity of Variance (Equal Variances): The variances of the residuals are roughly equal across all groups.

Use leveneTest() from the “car” package to perform Levene’s test for homogeneity of variances.

# Levene's test for homogeneity of variances (install and load "car" package)

leveneTest(residuals ~ group_variable)

Remember to replace residuals with your calculated residuals and group_variable with the variable that defines your groups. If the assumptions are not met, consider using alternatives like Welch’s ANOVA (for unequal variances) or non-parametric tests. Always assess the assumptions carefully, as violations can affect the validity of your ANOVA results. Again consult with your supervisor on these assumptions and the tests.

19

RStudio Workshop: One-Way ANOVA

Between-Subjects One-Way ANOVA

In our first hypothetical experiment, participants attended a lecture and were asked to come back the next day to take a test on the lecture material after having received either 0, 5, or 8 hours of sleep. Therefore, sleep is manipulated between participants. Here we are interested in the effect of hours slept on test scores, we can do this by conducting a one-way analysis of variance (ANOVA).

A one-way ANOVA is an extension of an independent two-sample t-test. Here, the data is organized into several groups of participants (e.g., 3 groups) based on a single grouping variable, also called a factor variable (e.g., sleep). You can think of a factor as an independent variable with more than 2 levels of manipulation. In our case, we have three different levels of manipulation to sleep.

Therefore, in a one-factor ANOVA, we are comparing means in a situation where there are more than two levels to a single factor. The aim of this tutorial is to describe the basic principle of the one-way ANOVA test and provide practical ANOVA test examples in R software.

NOTE: if you have only two groups, an F-test and a t-test are the same.

In an ANOVA we are testing two hypotheses: 1. Null hypothesis: there is no difference between the means of the different groups 2. Alternative hypothesis: there is a difference in means between at least two groups.

Now, we aim to reject the null hypothesis in favour of the alternative, by showing that there is a significant difference between at least 2 groups of participants.

The first step in doing so is to import our data set, then inspect our file.

# Now when it comes to importing your data frame I prefer to do so using the following code which allows me to click on my data frame, but you can also load your data frame by calling on the document's name.
mydata1 <- read_excel(file.choose())
# If your data frame is in csv format use read.csv(file.choose())
# or
# if you already know the name of your data file and have set the working
# directory, you can import you data file by name
mydata1 =read_excel("OneWay_Sample_DataFile.xlsx") # or read.csv("OneWay_Sample_DataFile.csv")

# Let's inspect our data frame
print(mydata1) # look at the entire data frame

## # A tibble: 258 × 5
## ID Gender Age Sleep TestScore
## <chr> <chr> <dbl> <chr> <dbl>
## 1 259 F 27 0 53.3
## 2 260 F 22 0 66.0
## 3 261 F 19 0 56.3
## 4 262 F 25 0 68.7
## 5 263 Non-Binary 23 0 77.4
## 6 264 F 27 0 19.3
## 7 265 F 30 0 31.1
## 8 266 Non-Binary 27 0 64.5
## 9 267 F 18 0 42.4
## 10 268 M 28 0 32.9
## # ℹ 248 more rows

# or you can use
head(mydata1) #look at the first 6 rows

Note that in R studio, once you load your data file, you will notice it pop up under the name you saved it as, which in this case is “mydata1” at the top right corner of your screen, which is your global environment. Here you will see all your stored work, values, and files. You can click on the data file under data to open it as a separate tab beside your script, to look through, or you can do this exact action by code using view(). I tend to use this function when my global environment gets super packed, and it is no longer feasible to scan through the multitude of data for a specific one I want to take a look at.

view(mydata1) # to open the entire data file in a separate tab in R studio

Now in this data file, ID distinguishes between individual participants.

We also have some basic demographic info, including “Age” and “Gender”, which we typically summarize and report when describing our sample size in our Methods section. These demographic info may differ depending on your test subjects, but these are the typical ones we report with human subjects.

In this data file, our numerical dependent variable is in percentage form out of 100% (“TestScore”).

Our factor is in the column “Sleep”. Let’s check out to see if the factor is set up correctly by looking at the structure of our data frame.

str(mydata1) # looking at the structure of the data frame

## tibble [258 × 5] (S3: tbl_df/tbl/data.frame)
## $ ID : chr [1:258] "259" "260" "261" "262" ...
## $ Gender : chr [1:258] "F" "F" "F" "F" ...
## $ Age : num [1:258] 27 22 19 25 23 27 30 27 18 28 ...
## $ Sleep : chr [1:258] "0" "0" "0" "0" ...
## $ TestScore: num [1:258] 53.3 66 56.3 68.7 77.4 ...

We can see that our dependent measure “TestScore” is set up correctly as numerical. If not, then we need to fix it by using the following code:

mydata1$TestScore <- sapply(mydata1$TestScore, as.numeric)

Note that by using “$” beside our data frame name, we are calling upon a column name, as you start typing you will notice that a list of all the column names comes up as a short-cut.

We can also see that ID and Sleep are not set-up as factors. Let’s fix that.

# Lets set up our factor
mydata1 <- mydata1 %>%
convert_as_factor(ID, Sleep)


# Lets double-check to make sure that our factor is set-up correctly.
levels(mydata1$Sleep)

## [1] "0" "5" "8"

Summary Statistics

Next, let’s compute some summary statistics for each group across the different levels of Sleep.

ANOVA1.summary.statistics <-data.frame (mydata1 %>%
group_by(Sleep) %>%# enter factor(s)
get_summary_stats(TestScore, type = "full") )

ANOVA1.summary.statistics

## Sleep variable n min max median q1 q3 iqr mad mean
## 1 0 TestScore 86 6.860 93.301 45.687 29.348 59.249 29.901 23.390 45.873
## 2 5 TestScore 86 34.117 93.301 74.726 62.563 83.734 21.171 16.138 71.696
## 3 8 TestScore 86 47.587 93.301 85.748 77.358 90.314 12.956 7.858 82.526
## sd se ci
## 1 20.850 2.248 4.470
## 2 15.570 1.679 3.338
## 3 10.092 1.088 2.164

Here I am looking for group means along with the standard error of the mean values, which I will later use for my error bars when making figures. Some other measures that you can use are listed under the info card for the get_summary_stats function and include: type = c(“mean_sd”, “mean_se”, “mean_ci”, “median_iqr”, “median_mad”, “quantile”, “mean”, “median”, “min”, “max”)

For example, you may be interested in using mean standard deviation values for your error bars, in which case you can use “mean_sd”. You may also use “full” as your type to get all the measures!

Pro Tip: You can explore what each function offers with examples by putting a ? right before the empty function, as shown below. It will open up the information sheet for the function on the Help tab to your bottom right on R studio. Try it!

?get_summary_stats()

Making Publishable Tables

Now, while this is a nice table if you want to include these summary statistics in your final thesis paper. We can do the following steps to generate nice printable summary tables!

# First let's maintain our unedited copy with the full values, which
# we will call on when making our plots & figures and a separate copy that
# we will edit to make the publishable table.
ANOVA1.summarystat.publishable <- ANOVA1.summary.statistics


# We will begin by rounding numerical values in each column to 3 significant
# figures, but you may choose to change this depending on your own preference
ANOVA1.summarystat.publishable$mean <-signif(ANOVA1.summarystat.publishable$mean,3)
ANOVA1.summarystat.publishable$se <-signif(ANOVA1.summarystat.publishable$se,3)


# Selecting columns by name that we want to include in our final table by name
ANOVA1.summarystat.publishable <-subset(ANOVA1.summarystat.publishable,
select =c(Sleep, n,
mean, se))

# Next we will change column names to make them nicer
#colnames(T2.summary.statistics) # to print all column names in data frame if you don't remember
colnames(ANOVA1.summarystat.publishable)[colnames(ANOVA1.summarystat.publishable)
=="n"] ="N"
colnames(ANOVA1.summarystat.publishable)[colnames(ANOVA1.summarystat.publishable)
=="mean"] ="Mean"
colnames(ANOVA1.summarystat.publishable)[colnames(ANOVA1.summarystat.publishable)
=="se"] ="Standard Error"

# Generating the Printable Summary Stat Table
ANOVA1.summarystat.publishable %>%
kbl(caption = "Summary Statistics") %>% # Title of the table
kable_classic(full_width = F, html_font = "Cambria", font_size = 10) %>% add_header_above(c(" " = 2, "Test Score (%)" = 2)) # adding header to columns in table by position.
# E.g., for the first 2 columns we do not want a header so we leave empty space.
# Over the last two column we specified the header name.

Reporting Demographic Info As I mentioned before, one of the first things we have to do when writing up our Methods is to report some basic information about our sample size. Let’s do that now!

# Computing average age by group
mydata1 %>%group_by(Sleep) %>%
get_summary_stats(Age, type = "mean")

## # A tibble: 3 × 4
## Sleep variable n mean
## <fct> <fct> <dbl> <dbl>
## 1 0 Age 86 23.7
## 2 5 Age 86 24.0
## 3 8 Age 86 24.0

Note that n represents the number of participants per group, meaning that in total, we have data from 258 participants. More importantly, we can see that the number of observations per condition is equal, therefore, this is a balanced design. If you have an unequal sample size, I recommend that you refer to the following link for more information on conducting an unbalanced ANOVA:

How to perform one-way anova with unequal sample sizes in R?

However, I would still recommend reading through this guide to become familiar with R-studio. You will be doing the same steps when doing an unbalanced ANOVA, with some adjustments to the code.

# Looking at the distribution of "Gender" across the three groups
table(mydata1$Gender, mydata1$Sleep) %>%#each cell represents the number of subjects in this category
addmargins() ## we can add margins to the table to make it clearer

##
## 0 5 8 Sum
## F 37 36 45 118
## M 39 40 33 112
## Non-Binary 10 10 8 28
## Sum 86 86 86 258

Reporting Participants

Here is an example of how you might report information about your sample size in your Methods section based on the above summary tables.

Example: We recruited 258 participants from the introductory psychology undergraduate participant pool at McMaster University in exchange for partial course credit. Participants were randomly assigned to either the no sleep condition (39 males and 10 non-binary; Mean age = 23.7 years), 5 hour sleep condition (n=86; 40 males and 10 non-binary; Mage = 24.0 years), or the 8 hour sleep condition (n=86; 33 males and 8 non-binary; Mage = 24.0 years)

Visualization: Generating Plots & Figures

With our summary statistics in hand. Let’s generate some nice summary plots to visualize our data!=

LINE PLOT

The first one we will create is a line plot. So here we want to specify which factor we want on our x-axis, as well as which summary measure of our dependent variable we want on our y-axis. In this case, we want the Sleep factor (with 3 levels) on the x-axis, and mean Test Scores on the y-axis

Tip: One thing to keep in mind is that you should design your plots such that if a reader is colour-blind or chooses to print your results in black-white, they can still easily distinguish between the different factors in your plot. Hence, we will also use the shape of our points to also specify “BLOCK_TYPE”

anova1.lineplot <-ggline(mydata1, x = "Sleep", y = "TestScore",
add =c("mean_se", "jitter"), #adding standard error bars and jitter
# points representing each individual participant in each group.
order =c("0", "5", "8"), #organizing order of levels
ylab = "Mean Test Score (%)", xlab = "Hours Slept", #adding x- and y-axis title
color = "black", #colour of line
linetype = "dashed",
font.label =list(size = 20, color = "black"),
size = 1,
point.color = "Sleep", #point color differs for each level of the Sleep factor
palette =c("cyan4", "darkgoldenrod1", "deeppink2"),
shapes = 1, #point shapes
point.size = 2,
ggtheme =theme_gray(),
ylim=c(0,100) #adjusting the min and max value of y-aixs
)

# For more options run the ?ggline() code

# Change the appearance of titles and labels
anova1.lineplot +
font("xlab", size = 14, color = "black", face = "bold")+
font("ylab", size = 14, color = "black", face = "bold")+
font("xy.text", size = 12, color = "black", face = "bold")

image


BOX PLOT

anova1.boxplot <-ggboxplot(mydata1, x = "Sleep", y = "TestScore",
color = "Sleep",
palette =c("cyan4", "darkgoldenrod1", "deeppink2"),
order =c("0", "5", "8"),
ylab = "Mean Test Score (%)", xlab = "Hours Slept",
add = ("median_iqr"), #adding median and inner quartile range
font.label =list(size = 20, color = "black"),
size = 1,
ggtheme =theme_gray(),
ylim=c(0,100) #adjusting the min and max value of y-aixs  )

# Change the appearance of titles and labels
anova1.boxplot +
font("xlab", size = 14, color = "black", face = "bold")+
font("ylab", size = 14, color = "black", face = "bold")+
font("xy.text", size = 12, color = "black", face = "bold")

# For more options run the ?ggboxplot() code

image

BAR PLOT

If you are interested in exploring your options when it comes to bar plots, I recommend the following resources:

The following link will show you all the different colour palettes that you can use for designing plots.

# Notice that I am using the summary statistic table with the full range of
# summary data not the printable one we made.
anova1.barplot <-ggplot(ANOVA1.summary.statistics,
aes(x =factor(Sleep), y = mean, fill = Sleep) ) +
geom_bar(stat = "identity", position = "dodge") +
geom_errorbar(aes(ymax = mean + sd, ymin = mean - sd), #adding standard error bars
position =position_dodge(0.9), width = 0.25, color = "Gray25") +
xlab("Hours Slept") +
ylab("Average Test Score (%)") +
scale_fill_brewer(palette = "RdPu") +
theme_classic() +
theme(axis.line=element_line(linewidth=1.5), #thickness of x-axis line
axis.text =element_text(size = 14, colour = "black"),
axis.title =element_text(size = 16, colour = "black"),
panel.grid.major.y =element_line() ) +# adding horizontal grid lines
scale_y_continuous(breaks=seq(0, 100, 10)) # Ticks on y-axis from 0-100,
# jumps by 10

anova1.barplot

image

Computing a One-Way ANOVA

# Computing the one-way ANOVA
one.aov <-aov(TestScore ~ Sleep, data = mydata1)

# Summary of the analysis
summary(one.aov)

## Df Sum Sq Mean Sq F value Pr(>F)
## Sleep 2 60991 30496 117.4 <2e-16 ***
## Residuals 255 66212 260
## ---
## Signif. codes: 0 '***' 0.001 '**' 0.01 '*' 0.05 '.' 0.1 ' ' 1

Interpreting & Reporting

We can see that the p-value (Pr(>F)) is significantly less than the significance level of 0.05, as highlighted by the “asterisk” symbols in the summary table. Therefore we can reject the null hypothesis that there were no differences between groups. When reporting these data, we typically have to report the degrees of freedom, the F value, p-value, and a measure of effect size). Next we are going to calculate effect sizes, in specific, we will be reporting partial eta squared here. You should consult with your principal investigator on which measure of effect size they deem appropriate.

For a more comprehensive review of the effect size measure options please go to the following resource: Effect Sizes for ANOVAs

options(es.use_symbols = TRUE) # get nice symbols when printing! (On Windows, requires R >= 4.2.0)

eta_squared(one.aov, partial = TRUE)

## For one-way between-subjects designs, partial eta squared is equivalent to eta squared. Returning eta squared.

## # Effect Size for ANOVA
##
## Parameter | η² | 95% CI
## -------------------------------
## Sleep | 0.48 | [0.41, 1.00]
##
## - One-sided CIs: upper bound fixed at [1.00].

Pair-Wise Comparisons

Next, while our one-way ANOVA showed that there is a significant difference between groups, we don’t know which pairs of groups are different. Using multiple pairwise comparisons, we can probe where this difference lies between pairs of groups.

In R, there are multiple functions for conducting the same analyses. My personal favourite for this next step is the function TukeyHD(), which takes our fitted one-way ANOVA as an argument.

TukeyHSD(one.aov,
conf.level = 0.95#you may change this, default is 0.95)

## Tukey multiple comparisons of means
## 95% family-wise confidence level
##
## Fit: aov(formula = TestScore ~ Sleep, data = mydata1)
##
## $Sleep
## diff lwr upr p adj
## 5-0 25.82300 20.029891 31.61610 0.00e+00
## 8-0 36.65349 30.860383 42.44659 0.00e+00
## 8-5 10.83049 5.037386 16.62360 4.58e-05

When interpreting this output:

  • diff: the difference between the means of the two groups
  • lwr and upr correspond to the lower and the upper-end point of the confidence interval at 95%.
  • p adj: p-value after adjustment for the multiple comparisons

It can be seen from the output that there is a significant difference between all combinations of the groups! However, the biggest benefit in performance occurs when participants receive 8 hours of sleep compared to no sleep.

Together with our ANOVA summary table, we now have everything we need to report our results.

Reporting Results:

The test score was statistically significantly different at the different amounts of sleep [F(2, 255) = 117.4, p < 0.001, pη² = 0.48]. Post-hoc analyses with a Bonferroni adjustment revealed that all the pairwise differences, between sleep levels, were statistically significantly different (p < 0.001).


Repeated Measures One-Way ANOVA

In the first experiment, we computed a one-way ANOVA for a factor that was manipulated between subjects, Meaning that we compared different groups to one another. Let’s compute a within-participants ANOVA.

In this hypothetical experiment, a group of participants are tested at three different time points, and most importantly, they all experience different sleep manipulations.

mydata1within <- read_excel("OneWayWithin_Sample_DataFile.xlsx")

# Set-up factor
mydata1within <- mydata1within %>%
convert_as_factor(ID, Sleep)

str(mydata1within) #checking data structure and how factor is set-up

## tibble [258 × 5] (S3: tbl_df/tbl/data.frame)
## $ ID : Factor w/ 86 levels "29057","32239",..: 20 48 84 61 22 23 25 29 72 69 ...
## $ Gender : chr [1:258] "F" "M" "F" "F" ...
## $ Age : num [1:258] 23 22 23 23 22 22 22 22 22 22 ...
## $ Sleep : Factor w/ 3 levels "0","5","8": 1 1 1 1 1 1 1 1 1 1 ...
## $ TestScore: num [1:258] 45.77 17.56 16.6 49.59 8.51 ...

Summary Statistics

mydata1within %>%
group_by(Sleep) %>%
get_summary_stats(TestScore, type = "mean_se")

## # A tibble: 3 × 5
## Sleep variable n mean se
## <fct> <fct> <dbl> <dbl> <dbl>
## 1 0 TestScore 86 30.8 2.43
## 2 5 TestScore 86 56.4 1.88
## 3 8 TestScore 86 67.5 1.26

I will be skipping over some of the steps, such as summarizing demographic info and visualizing the data. But you can use the same codes as those for the between-one-way ANOVA for this one. The main difference lies in computing the actual ANOVA, where we will be using a different function.

Computing Repeated Measures One-Way ANOVA

one.aov.within <-
anova_test(data = mydata1within, #data frame
dv = TestScore, #(numeric) dependent variable name
wid = ID, #subjects identifier; must be unique per participant
within = Sleep, # within-subjects factor variables
effect.size = "pes", #default is generalized eta square "ges" but here we specify that we want partial eta squared
detailed = TRUE, #If TRUE, returns extra information (such as sums of squares columns, intercept row, etc.) in the ANOVA table
)
# Run ?anova_test() to explore more options for this function.

get_anova_table(one.aov.within, correction = "auto") #automatically apply GG correction to only within-subjects factors violating the sphericity assumption

## ANOVA Table (type III tests)
##
## Effect DFn DFd SSn SSd F p p<.05 pes
## 1 (Intercept) 1.00 85.00 686279.36 59317.41 983.417 1.71e-48 * 0.92
## 2 Sleep 1.37 116.22 60840.19 21389.16 241.777 2.37e-35 * 0.74

From the ANOVA table, we can see that there was a significant effect of sleep on test scores. Next we want to see where the differences in scores lies.

Post-Hoc Analyses

one.anova.within.pwc <- mydata1within %>%
pairwise_t_test(
TestScore ~ Sleep, paired = TRUE,
p.adjust.method = "bonferroni"
)
one.anova.within.pwc

## # A tibble: 3 × 10
## .y. group1 group2 n1 n2 statistic df p p.adj p.adj.signif
## * <chr> <chr> <chr> <int> <int> <dbl> <dbl> <dbl> <dbl> <chr>
## 1 Test… 0 5 86 86 -14.7 85 5.39e-25 1.62e-24 ****
## 2 Test… 0 8 86 86 -17.1 85 2.69e-29 8.07e-29 ****
## 3 Test… 5 8 86 86 -10.3 85 1.15e-16 3.45e-16 ****


20

RStudio Workshop: Two-Way ANOVA

Within-Participants Two-Way ANOVA

We can use the same function that was used to compute a one-way within-subjects ANOVA for a two-way ANOVA. I highly encourage you to attempt to conduct the analyses on your own before progressing further into this guide.

For this exercise, we will be looking at the data file named “Practice_2WayANOVA_Within.xlsx” 

  • Measured Variable: TestScore
  • 2 x 3 Repeated-Measures Design
  • Factors: “Beverage” and “Sleep”

In this hypothetical experiment, participants attended 6 lectures across different time points. After a lecture, they were asked to sleep for 0 hours, 5 hours, or 8 hours before coming back the next day to be quizzed on the lecture content. At the time of test, they were given either coffee or a placebo (decaffeinated hot beverage).
We are interested in whether Test Scores suffer when participants don’t receive enough sleep, and whether consuming coffee alleviates that performance decrement.

mydata2w <-read_excel("Practice_2WayANOVA_Within.xlsx") #importing our data file

mydata2w <- mydata2w %>%
convert_as_factor(ID, Gender, Beverage, Sleep) #setting up factors

str(mydata2w) #checking factors

## tibble [516 × 6] (S3: tbl_df/tbl/data.frame)
## $ ID : Factor w/ 86 levels "29057","32239",..: 20 48 84 61 22 23 25 29 72 69 ...
## $ Gender : Factor w/ 3 levels "F","M","Non-Binary": 1 2 1 1 1 1 1 2 1 1 ...
## $ Age : num [1:516] 25 22 22 20 22 20 21 20 19 21 ...
## $ Beverage : Factor w/ 2 levels "Coffee","Placebo": 1 1 1 1 1 1 1 1 1 1 ...
## $ Sleep : Factor w/ 3 levels "0","5","8": 1 1 1 1 1 1 1 1 1 1 ...
## $ TestScore: num [1:516] 99 64.3 93.3 94.8 89.1 ...

# Summary Statistics Table
mydata2w.summarystat <- mydata2w %>%
group_by(Beverage, Sleep) %>%
get_summary_stats(TestScore, type = "full")


# Selecting rows of data only if ID value is unique
mydata2w.unique <- mydata2w %>%
distinct(mydata2w$ID, .keep_all=TRUE)
# Looking at the distribution of "Gender" in our sample size
table(mydata2w.unique$Gender)

##
## F M Non-Binary
## 60 21 5


# Mean Age of Sample Size
mydata2w.unique %>%
get_summary_stats(Age, type ="mean")

## # A tibble: 1 × 3
## variable n mean
## <fct> <dbl> <dbl>
## 1 Age 86 21.5


mydata2w.summarystat

## # A tibble: 6 × 15
## Beverage Sleep variable n min max median q1 q3 iqr mad mean
## <fct> <fct> <fct> <dbl> <dbl> <dbl> <dbl> <dbl> <dbl> <dbl> <dbl> <dbl>
## 1 Coffee 0 TestSco… 86 51.2 99.0 96.1 90.6 97.6 7.01 4.27 91.7
## 2 Coffee 5 TestSco… 86 64.3 99.0 97.6 94.8 99.0 4.22 2.09 95.7
## 3 Coffee 8 TestSco… 86 64.3 99.0 97.6 94.8 99.0 4.17 2.06 96.0
## 4 Placebo 0 TestSco… 86 -6.95 74.8 23.2 14.2 40.4 26.2 18.8 28.2
## 5 Placebo 5 TestSco… 86 -1.67 79.1 62.2 45.1 70.0 24.8 14.8 56.4
## 6 Placebo 8 TestSco… 86 30.0 79.1 71.6 64.9 74.9 10.1 6.82 67.5
## # ℹ 3 more variables: sd <dbl>, se <dbl>, ci <dbl>

Visualization

# Line plots with multiple groups
anova2w.lineplot <-ggline(mydata2w, x = "Sleep", y = "TestScore", color = "Beverage",
add =c("mean_se"), #adding standard error bars
palette =c("tan4", "pink1"),
order =c("0", "5", "8"), #organizing order of levels
ylab = "Mean Test Score (%)", xlab = "Hours Slept (hrs)", #x- and y-axis title
linetype = "solid",
font.label =list(size = 20, color = "black"),
size = 1,
ggtheme =theme_gray(),
ylim=c(0,100) #adjusting the min and max value of y-aixs   )


# Change the appearance of titles and labels
anova2w.lineplot +
font("xlab", size = 14, color = "black", face = "bold")+
font("ylab", size = 14, color = "black", face = "bold")+
font("xy.text", size = 12, color = "black", face = "bold")

image

# Box plot with two factor variables
anova2w.boxplot <-ggboxplot(mydata2w, x = "Sleep", y = "TestScore",
color = "Beverage",
palette =c("tan", "black"),
ylab = "Mean Test Score (%)", xlab = "Hours Slept",
add = ("mean_ci"), #adding 95% confidence intervals
font.label =list(size = 20, color = "black"),
size = 1,
ggtheme =theme_gray()
)
# Change the appearance of titles and labels
anova2w.boxplot +
font("xlab", size = 14, color = "black", face = "bold")+
font("ylab", size = 14, color = "black", face = "bold")+
font("xy.text", size = 12, color = "black", face = "bold")

image

# Bar plot with two-factor variables
anova2w.barplot <-ggplot(mydata2w.summarystat,
aes(x =factor(Sleep), y = mean, fill = Beverage) ) +
geom_bar(stat = "identity", position = "dodge") +
geom_errorbar(aes(ymax = mean + sd, ymin = mean - sd), #adding standard error bars
position =position_dodge(0.9), width = 0.25, color = "Gray25") +
xlab("Hours Slept") +
ylab("Average Test Score (%)") +
scale_fill_brewer(palette = "RdPu") +
theme_classic2() +
theme(axis.line=element_line(linewidth=1.5), #thickness of x-axis line
axis.text =element_text(size = 14, colour = "black"),
axis.title =element_text(size = 16, colour = "black"),
panel.grid.major.y =element_line() ) +# adding horizontal grid lines
scale_y_continuous(breaks=seq(0, 100, 10)) # Ticks on y-axis from 0-100,
# jumps by 10

anova2w.barplot

image

Computing the Repeated Measures Two-Way ANOVA

mydata2w.2anova <-anova_test(
data = mydata2w,
dv = TestScore,
wid = ID,
within =c(Beverage, Sleep), #for more than 2 factors to count you must use c()
#it combines 2+ values into a vector/list
detailed = TRUE,
effect.size = "ges"#we get the generalized eta squared, enter pes to get
) # partial eta squared
# Apply the Greenhouse Geisser correction on an as-needed-basis
mydata2w.2anova <-get_anova_table(mydata2w.2anova, correction = "auto")


# We can calculate partial eta square and add it as a new column named "pes"
mydata2w.2anova$pes = mydata2w.2anova$SSn/(mydata2w.2anova$SSn + mydata2w.2anova$SSd)


# Calculate the mean sum of error and add it as a new column named "MSE"
mydata2w.2anova$MSE = mydata2w.2anova$SSd/mydata2w.2anova$DFd

# Convert tables to data frames
mydata2w.2anova <-data.frame(mydata2w.2anova)

# Deleting intercept info (first row)
mydata2w.2anova <- mydata2w.2anova[-1, ]


# Rename columns
colnames(mydata2w.2anova)[colnames(mydata2w.2anova) =="pes"] ="η2P"
colnames(mydata2w.2anova)[colnames(mydata2w.2anova) =="ges"] ="η2G"
colnames(mydata2w.2anova)[colnames(mydata2w.2anova) =="p..05"] ="sig"

mydata2w.2anova

## Effect                     DFn    DFd        SSn               SSd               F                  p             sig   η2G      η2P      MSE
## 2 Beverage             1.00      85.00      246966.79    18527.547    1133.025     6.47e-51 *     0.752  0.930     217.9711
## 3 Sleep                   1.34      113.78    44095.24      12457.452     300.872      8.82e-39  *    0.351  0.779     109.4872
## 4 Beverage:Sleep   1.60     136.23     27663.08      9544.342       246.362      2.23e-41  *    0.254. 0.743     70.0605


Any significant two-way interactions in this analysis must be followed up by further analyses looking at the effect of the other factor while keeping the level of another constant.

In these analyses, a significant two-way interaction indicates that the impact that one factor (e.g., Beverage) has on the outcome variable (e.g., test score) depends on the level of the other factor (e.g., Sleep) (and vice versa). So, you can decompose a significant two-way interaction by treating factor A to a one-factor ANOVA at each level of factor B.

Procedure for a significant two-way interaction:

Simple main effect: run a one-way model of one factor by keeping the level of the other constant. As in, run two one-way ANOVAs for one factor at each level of the other factor.

Simple pairwise comparisons: if the result of either of the one-way analyses is significant as in if the simple main effect is significant, then you will run multiple pairwise comparisons to determine which groups are different as we did previously for the one-way ANOVA tutorial.

# Simple Main Effect
# Looking at the effect of Sleep separately for each level of Beverage
mydata2w.one.way <- mydata2w %>%
group_by(Beverage) %>%
anova_test(dv = TestScore, wid = ID, within = Sleep) %>%
get_anova_table() %>%
adjust_pvalue(method = "bonferroni")
mydata2w.one.way

## # A tibble: 2 × 9
## Beverage    Effect    DFn    DFd    F        p         `p<.05`      ges      p.adj
## <fct> <chr> <dbl> <dbl> <dbl> <dbl> <chr> <dbl> <dbl>
## 1 Coffee     Sleep     1.17    99.4   22.4    2.11e- 6 *              0.07   4.22e- 6
## 2 Placebo   Sleep     1.51    128.   331     1.76e-45 *             0.51   3.52e-45


There was a significant effect of sleep for both levels of the Beverage factor. We must now conduct pair-wise comparisons to determine where the difference in levels of sleep lies separately at both levels of beverage.

# Pairwise comparisons between Sleep levels
mydata2w.pwc <- mydata2w %>%
group_by(Sleep) %>%
pairwise_t_test(
TestScore ~ Beverage, paired = TRUE,
p.adjust.method = "bonferroni"
)
mydata2w.pwc

## # A tibble: 3 × 11
##     Sleep .y.             group1  group2   n1   n2    statistic   df p    p.adj           p.adj.signif
## *  <fct><chr><chr><chr> <int><int><dbl><dbl><dbl> <dbl><chr>
## 1  0      TestScore   Coffee  Placebo   86   86     35.1       85      2.32e-52     2.32e-52
## 2  5      TestScore   Coffee  Placebo   86   86     22.0      85       6.52e-37     6.52e-37
## 3  8      TestScore   Coffee  Placebo   86   86     25.7      85       8.84e-42      8.84e-42


Interpreting & Analyzing Results

The two-way repeated measures ANOVA revealed a significant main effect of beverage [F(1,85)= 1133.0, MSE = 218.0, partial eta squared = 0.930], and sleep [F(1.3,113.8)= 300.9, MSE = 109.5, partial eta squared = 0.780], qualified by a two-way interaction [F(1.6,136.2)= 300.9, MSE = 70.1, partial eta squared = 0.743]. Considering the Bonferroni adjusted p-value (p.adj), it can be seen that the simple main effect of sleep was significant at both levels of Beverage [Coffee, p<0.001; Placebo, p<0.001]. Pairwise comparisons show that the mean test score was significantly different between coffee and placebo conditions at 0 hours (p < 0.0001) and 5 hours (p < 0.0001) and 8 hours (p < 0.0001) of overnight sleep.

Note that instead of decomposing the sleep x beverage two-way interaction into the simple main effect of beverage, you could have chosen sleep. As in performing the same analysis for the sleep variable at each level of beverage, You don’t necessarily need to do this analysis. You simply have to interchange when the factors Sleep and Beverage are plugged into the codes for the post hoc analyses.

What if: Non-Significant Two-Way Interaction

Importantly, if the two-way interaction was not significant in the overall ANOVA, but there were still significant main effects (e.g., the main effect of Sleep and the main effect of Beverage), then you need to interpret the main effects for each of the two variables by conducting pairwise paired t-test comparisons.

# Comparisons for Beverage variable

mydata2w %>% pairwise_t_test( TestScore ~ Beverage, paired = TRUE, p.adjust.method = "bonferroni" )

# Comparisons for Sleep variable

mydata2w %>% pairwise_t_test( TestScore ~ Sleep, paired = TRUE, p.adjust.method = "bonferroni" )


Mixed Two-Way ANOVA

For practice, I encourage you to compute a mixed two-way ANOVA for the data file named “Practice_2WayANOVA_Mixed.xlsx” with the following elements:

  • Measured Variable: TestScore
  • 2 x 3 Mixed Design
  • Between-Participants: “Exercise”
  • Within-Participants: “Sleep”

In this hypothetical experiment, participants attended 3 lectures across different time points. One group of participants was asked to attend yoga classes three times a week for three months before the lecture series and attended yoga classes during the experiment. After one lecture session, they were asked to sleep for either 0 hours, 5 hours, or 8 hours before coming back the next day to be tested on the lecture. Another group of participants experienced a nearly identical experimental design, except that instead of yoga, they were asked to engage in mindfulness exercises.

We are interested in how sleep affects learning; in particular, whether test scores suffer when participants don’t receive enough sleep. Moreover, we are also interested in whether those who engage in yoga are more resilient to this sleep-induced performance decrement. To the best of your ability visualize the data and compute the appropriate summary tables and figures to compare before going through the answers below. 

# Data Prep & Summary Statistics
mydata2m <- read_excel("Practice_2WayANOVA_Mixed.xlsx")

mydata2m <- mydata2m %>% convert_as_factor(ID, Gender, Exercise, Sleep)

str(mydata2m)

## tibble [516 × 7] (S3: tbl_df/tbl/data.frame)
## $ ...1 : chr [1:516] "259" "260" "261" "262" ...
## $ ID : Factor w/ 172 levels "23936","25440",..: 10 71 6 70 147 129 74 62 21 38 ...
## $ Gender : Factor w/ 3 levels "F","M","Non-Binary": 1 1 1 1 1 1 1 3 1 2 ...
## $ Age : num [1:516] 22 22 23 22 22 24 22 22 23 22 ...
## $ Exercise : Factor w/ 2 levels "Mindfulness",..: 1 1 1 1 1 1 1 1 1 1 ...
## $ Sleep : Factor w/ 3 levels "0","5","8": 1 1 1 1 1 1 1 1 1 1 ...
## $ TestScore: num [1:516] 32 43 44 46 31 45 21 48 40 32 ...


mydata2m.summarystat <- mydata2m %>%
group_by(Exercise, Sleep) %>%
get_summary_stats(TestScore, type = "full")

# Selecting rows of data only if ID value is unique
mydata2m.unique <- mydata2m %>%
distinct(mydata2m$ID, .keep_all=TRUE)
# Looking at the distribution of "Gender" per group
table(mydata2m.unique$Gender, mydata2m.unique$Exercise)

##                      Mindfulness Yoga
## F                   40                  60
## M                  39                  21
## Non-Binary  7                    5


# Mean Age Per Group

mydata2m %>% group_by(Exercise) %>%
get_summary_stats(Age, type ="mean")

## # A tibble: 2 × 4
##      Exercise          variable  n       mean
## <fct> <fct> <dbl> <dbl>
## 1   Mindfulness    Age       258    22.6
## 2    Yoga              Age        258    22.2


mydata2m.summarystat

## # A tibble: 6 × 15
##    Exercise   Sleep   variable    n   min   max    median   q1     q3       iqr     mad    mean sd se  ci
## <fct> <fct> <fct> <dbl> <dbl> <dbl> <dbl> <dbl> <dbl> <dbl> <dbl> <dbl> <dbl> <dbl> <dbl>
## 1 Mindful… 0        TestSco… 86  15     48      32          23.2    41.8  18.5    13.3   32.3
## 2 Mindful… 5        TestSco… 86  38     80.8   48          43       53     10       7.41   48.7
## 3 Mindful… 8        TestSco… 86  55     66      59          57       63     6         4.45   60.1
## 4 Yoga          0        TestSco… 86  35     55      44.5       40.2    51     10.8    8.15   45.5
## 5 Yoga          5        TestSco… 86  66     80      72.5       68       76      8        6.67   72.7
## 6 Yoga          8        TestSco… 86  74     100    85.5       79       93.8   14.8   11.1   86.6


I will be skipping over the visualization step here since you can use the same codes as those for the within-subjects 2-way ANOVA here. I encourage you to practice making some summary plots on your own.

Computing the Two-Way ANOVA

mydata2m.2anova <- anova_test(
data = mydata2m,
dv = TestScore,
wid = ID,
between = Exercise, #between-participants factor
within = Sleep,
detailed = TRUE,
effect.size = "ges"
)
# Apply the Greenhouse Geisser correction on an as-needed-basis
mydata2m.2anova <- get_anova_table(mydata2m.2anova, correction = "auto")

# Calculate partial eta square and add it as a new column named "pes"
mydata2m.2anova$pes = mydata2m.2anova$SSn/(mydata2m.2anova$SSn + mydata2m.2anova$SSd)

# Calculate the mean sum of error and add it as a new column named "MSE"
mydata2m.2anova$MSE = mydata2m.2anova$SSd/mydata2m.2anova$DFd

# Convert tables to data frames
mydata2m.2anova <- data.frame(mydata2m.2anova)

# Deleting intercept info (first row)
mydata2m.2anova <- mydata2m.2anova[-1, ]

# Rename columns
colnames(mydata2m.2anova)[colnames(mydata2m.2anova) == "pes"] ="η2P"
colnames(mydata2m.2anova)[colnames(mydata2m.2anova) == "ges"] ="η2G"
colnames(mydata2m.2anova)[colnames(mydata2m.2anova) == "p..05"] ="sig"

mydata2m.2anova

##    Effect               DFn DFd     SSn                SSd               F                  p              sig    η2G      η2P               MSE
## 2 Exercise           1.00 170.0   57969.259      7475.35        1318.303     5.27e-82   *      0.699   0.8857759     43.97265 
## 3 Sleep                1.89 321.9   104622.988    17468.35      1018.179     9.08e-137 *      0.807   0.8569239     54.26638
## 4 Exercise:Sleep 1.89 321.9   4365.807        17468.35      42.488         2.05e-16   *      0.149   0.1999531     54.26638


Procedure for a significant two-way interaction:

# Simple main effect of Exercise at each level of the Sleep factor
anova2m.one.way <- mydata2m %>%
group_by(Sleep) %>%
anova_test(dv = TestScore, wid = ID, between = Exercise) %>%
get_anova_table() %>%
adjust_pvalue(method = "bonferroni")
anova2m.one.way

## # A tibble: 3 × 9
##    Sleep Effect      DFn DFd    F        p           `p<.05` ges       p.adj
## <fct> <chr> <dbl> <dbl> <dbl> <dbl> <chr> <dbl> <dbl>
## 1 0        Exercise  1     170      109   4.39e-20 *          0.392    1.32e-19
## 2 5        Exercise  1     170      642  1.34e-59  *          0.791    4.02e-59
## 3 8        Exercise  1     170      742   6.34e-64 *          0.814    1.90e-63


OR you may opt to decompose the Exercise x Sleep interaction into the simple main effect of sleep for each exercise group (code included below); however since we are aware that test scores suffer when participants don’t get enough sleep, this may not be sensible. Here we are more interested in whether yoga alleviates these sleep-induced performance decrements, therefore, we want to compare average test scores across the two groups when equating the amount of sleep. Therefore, you should give some thought to how you want to define your two-way interaction so that it addresses your research question.

# Simple main effect of Sleep for each Exercise Group
# anova2m.one.way.alt <- mydata2m %>%
# group_by(Exercise) %>%
# anova_test(dv = TestScore, wid = ID, within = Sleep) %>%
# get_anova_table() %>%
# adjust_pvalue(method = "bonferroni")
#anova2m.one.way.alt

Since the simple main effect of Exercise was significant, we must now run multiple pairwise comparisons to determine which groups are different.

# Pairwise comparisons between Exercise levels
anova2m.pwc <- mydata2m %>%
group_by(Sleep) %>%
pairwise_t_test(TestScore ~ Exercise, p.adjust.method = "bonferroni")
anova2m.pwc

## # A tibble: 3 × 10
## Sleep .y. group1 group2 n1 n2 p p.signif p.adj p.adj.signif
## * <fct> <chr> <chr> <chr> <int> <int> <dbl> <chr> <dbl> <chr>
## 1 0 TestS… Mindf… Yoga 86 86 4.39e-20 **** 4.39e-20 ****
## 2 5 TestS… Mindf… Yoga 86 86 1.34e-59 **** 1.34e-59 ****
## 3 8 TestS… Mindf… Yoga 86 86 6.34e-64 **** 6.34e-64 ****


# If you computed the simple main effect of sleep the pairwise comparisons would be as such:
#anova2m.pwc.alt <- mydata2m %>%
# group_by(Exercise) %>%
# pairwise_t_test(TestScore ~ Sleep, p.adjust.method = "bonferroni")
#anova2m.pwc.alt

Interpreting & Reporting

EXAMPLE: The mixed two-way ANOVA revealed a significant main effect of exercise [F(1,170)= 1318.3, MSE = 44.0, partial eta squared = 0.886], and sleep [F(1.9,322)= 1018.2, MSE = 54.3, partial eta squared = 0.857], qualified by a two-way interaction [F(1.9,322)= 42.5, MSE = 54.3, partial eta squared = 0.120]. Considering the Bonferroni adjusted p-value (p.adj), it can be seen that the simple main effect of exercise was significant for all levels of the sleep factor [p<0.001].

Pairwise comparisons show that mean test score was significantly different between the two exercise groups across all levels of sleep, such that the yoga group scored higher on the test than the mindfulness group when participants slept for 0 hours (13.1%, p <0.0001), 5 hours (24.%, p <0.0001), or 8 hours (26.5%, p <0.0001) the night before the test (see Figure 1).

Note that here I am pointing my reader to a Figure (bar plot), so they can see that the Yoga group outperformed the mindfulness group. I’ve generated a bar plot for my Figure 1 here. I highly encourage you to recreate this plot (with standard error bars) or any other type of plot that summarizes the data well. Moreover, using the summary statistic table I’ve calculated the difference in average test scores for the appropriate comparisons.

image

21

RStudio Workshop: Mixed Three-Way ANOVA

Now let’s put all of our training thus far together and run through a complex experimental design (2x2x3).

  • Dependent variable: TestScore
  • Between-participant factor: Exercise (Mindfulness x Yoga)
  • Within-participant factors: Beverage (Coffee x Placebo) and Sleep (0/5/8 hrs)

In this hypothetical experiment, two groups of participants are placed into a 3-month long exercise program. One group attends 3 yoga sessions a week, the other is asked to complete mindfulness practices three times a week at home for an hour.

After a month of engaging in exercise, participants are asked to attend 6 lectures administered at different time points. After a lecture, they are asked to come back the next day to be quizzed on the lecture content after having slept for either 0, 5, or 8 hours. At the time of the test, they are either given coffee or a placebo (decaffeinated hot beverage). Therefore, across the two exercise groups, all participants experience different levels of sleep and beverage manipulation.

Here we are interested in whether test scores suffer from a lack of sleep. We are also interested in whether those who engage in yoga practices are more resilient to the negative effect of sleep on learning. Moreover, we are interested in whether coffee can alleviate the effect of sleeplessness on test performance.

# Data Prep
mydata3 <-read_excel("3way_mixed_Sample_DataFile.xlsx") #importing data file

# Set-up factors
mydata3 <- mydata3 %>%convert_as_factor(ID, Gender, Exercise, Beverage, Sleep)

str(mydata3) #checking factors/levels

## tibble [1,032 × 7] (S3: tbl_df/tbl/data.frame)
## $ ID : Factor w/ 172 levels “23936”,”25440″,..: 10 71 6 70 147 129 74 62 21 38 …
## $ Gender : Factor w/ 3 levels “F”,”M”,”Non-Binary”: 1 1 1 1 1 1 1 3 1 2 …
## $ Age : num [1:1032] 22 22 23 22 22 24 22 22 23 22 …
## $ Exercise : Factor w/ 2 levels “Mindfulness”,..: 1 1 1 1 1 1 1 1 1 1 …
## $ Beverage : Factor w/ 2 levels “Coffee”,”Placebo”: 1 1 1 1 1 1 1 1 1 1 …
## $ Sleep : Factor w/ 3 levels “0”,”5″,”8″: 1 1 1 1 1 1 1 1 1 1 …
## $ TestScore: num [1:1032] 89.3 91.6 88.1 92.1 99 …

Let’s check to make sure that we have a balanced design. As in we have an equal number of participants/observations at every combination of our three variables.

# Generating frequency tables to check balance of design
table(mydata3$Beverage, mydata3$Sleep, mydata3$Exercise)

# we are organizing the number of observations per every combination of the within-subjects factors at either level of the between-subjects variable

## , , = Mindfulness
##
##
##                0     5    8
## Coffee   86   86   86
## Placebo 86   86   86
##
## , , = Yoga
##
##
##                0     5    8
## Coffee   86   86   86
## Placebo 86   86   86

We can see that we have an equal number of observations (n=86) across all levels of our three factors (i.e., per cell), compared to an unbalanced design, which has an unequal number of observations. In this case, the numbers in your frequency table will not all be equal.

If your experiment has an unbalanced design, I would recommend the following resource. However, once you are comfortable with the codes here you should be easily able to do the same analyses with your unbalanced design with some tweaks/adjustments.

Unbalanced ANOVA resource: https://www.r-bloggers.com/2011/02/r-tutorial-series-two-way-anova-with-unequal-sample-sizes/

Summary statistics

Now let’s compute some basic summary statistics.

# Computing a summary Statistics table for each independent variable
anova3.summary.statistics <-data.frame (mydata3 %>%
group_by(Exercise, Beverage, Sleep) %>%
get_summary_stats(TestScore, type = "full") )

Here I am looking for average performance along with standard error of the mean values, which I will later use for my error bars when making figures. Some other measures that you can use are listed under the info card for the get_summary_stats function and include: type = c(“mean_sd”, “mean_se”, “mean_ci”, “median_iqr”, “median_mad”, “quantile”, “mean”, “median”, “min”, “max”)

For example, you may be interested in using mean standard deviation values for your error bars, in which case you can use “mean_sd”. You may also use “full” as your type to get all the measures!

Tip: You can explore what each function offers with examples by putting a “?” right before the empty function, as shown below. It will open up the information sheet for the function on the Help tab to your bottom right on R studio. Try it!

?get_summary_stats()

Publishable Tables Now, while this is a nice table, if you want to include summary statistics in your final thesis paper, follow the next steps to generate nice printable tables!

# Create a copy and maintain the original with full summary statistics which we
# will use for plots
anova3.summary.statistics.print <- anova3.summary.statistics

# Deleting the column "variable" by name since we only have one dependent variable
anova3.summary.statistics.print <-subset(anova3.summary.statistics.print,
select =-c(variable))

# Selecting columns by name that we want to include in our final table
#colnames(anova3.summary.statistics) #print column names to see options
anova3.summary.statistics.print <-subset(anova3.summary.statistics.print,
select =c(Exercise, Beverage, Sleep, n, mean, se))
# Let's round our numerical values in select columns to 3 significant figures,
# but you may choose to change this depending on your own preference
anova3.summary.statistics.print$mean <-signif(anova3.summary.statistics.print$mean,3)
anova3.summary.statistics.print$se <-signif(anova3.summary.statistics.print$se,3)

# Next we will change column names to make them nicer
#colnames(T2.summary.statistics) # print all column names in data frame
colnames(anova3.summary.statistics.print)[colnames(anova3.summary.statistics.print)
=="n"] ="N"
colnames(anova3.summary.statistics.print)[colnames(anova3.summary.statistics.print)
=="mean"] ="Mean"
colnames(anova3.summary.statistics.print)[colnames(anova3.summary.statistics.print)
=="se"] ="SEM"
colnames(anova3.summary.statistics.print)[colnames(anova3.summary.statistics.print)
=="Sleep"] ="Sleep (hrs)"

# Generating the Printable Summary Stat Table
# Make sure to remove the comments sign "#" from the code below when running to create and view the publishable table
#anova3.summary.statistics.print %>%
# kbl(caption = "Summary Statistics") %>% # Title of the table
# kable_classic(full_width = F, html_font = "Cambria", font_size = 10) %>%
# add_header_above(c(" " = 4, "Test Score (%)" = 2)) # adding header to columns
#in table by position. E.g.,
# for the first 5 columns we do not want a header so we leave empty space.
# Over the last two columns we specified the header name.

Summarizing Demographic Info

# Selecting rows of data only if ID value is unique
mydata3unique <- mydata3 %>%
distinct(mydata3$ID, .keep_all=TRUE)
# Looking at the distribution of "Gender" per group
table(mydata3unique$Gender, mydata3unique$Exercise)

##
## Mindfulness Yoga
## F 40 60
## M 39 21
## Non-Binary 7 5

nrow(mydata3unique) # total number of participants

# Mean Age Per Group
mydata3unique %>%group_by(Exercise) %>%
get_summary_stats(Age, type ="mean")

## # A tibble: 2 × 4
## Exercise variable n mean
## <fct> <fct> <dbl> <dbl>
## 1 Mindfulness Age 86 22.6
## 2 Yoga Age 86 22.2

Reporting Sample Size We recruited 172 participants from the introductory psychology undergraduate participant pool at McMaster University in exchange for partial course credit. Participants were randomly assigned to either the mindfulness condition (n=86; 39 males and 7 non-binary; Mage = 22.6 years) or the yoga condition (n=86; 21 males and 5 non-binary; Mage = 22.2 years).

Visualization

You will notice that the code I will be using for plotting the data for this data set is different than the ones previously used.

The first one we will create is a line plot. So here we want to specify which factor we want on our x-axis, as well as which summary measure of our dependent variable we want on our y-axis. In this case, we want the Sleep factor (with 3 levels) on the x-axis, and mean TestScore on the y-axis Next we want to choose some other identifiable feature of the graph to represent our other two independent variables. In this case, we differentiated the two levels of the Exercise variable by the colour of the lines and line type or shape to represent the different beverages consumed. You may choose any of the ones in the cheat sheet and more!

Tip: One thing to keep in mind is that you should design your plots such that if a reader is colour-blind or chooses to print your results in black-white, they can still easily distinguish between the different factors in your plot. Hence, we will also use the shape of our points to specify BLOCK_TYPE

LINE PLOT

# Notice that I am using the summary stat table with the full range of data not the printable one
anova3.lineplot <-ggplot(anova3.summary.statistics, aes(x=Sleep, y=mean, color=Exercise, group=interaction(Exercise, Beverage))) +
geom_point(data=filter(anova3.summary.statistics, Exercise =="Yoga"),
shape=19, size=4.5) +#assigning point type 19 from cheat sheet to one level of factor
geom_point(data=filter(anova3.summary.statistics, Exercise =="Mindfulness"),
shape=1, size=4.5) +#assigning point type 1 from cheat sheet to other level of factor
geom_line(data=filter(anova3.summary.statistics, Beverage =="Coffee"),
linetype="dashed", linewidth=1.2) +#assigning line type to one level of factor
geom_line(data=filter(anova3.summary.statistics, Beverage =="Placebo"),
linetype="solid", linewidth=1.2) +#assigning line type to other level of factor
scale_color_manual(values =c("skyblue1", "darkred") ) +
xlab("Sleep (hrs)") +#add title to x-axis
ylab("Average Test Score (%)") +#add title to y-axis
theme_classic() +#this theme has no background, no bounding box.
theme(axis.line=element_line(linewidth=1.5), #thickness of x-axis line
axis.text =element_text(size = 14, colour = "black"),
axis.title =element_text(size = 16, colour = "black"),
panel.grid.major.y =element_line(), # adding horizontal grid lines
legend.position = "none") +
coord_cartesian(ylim=c(0, 100)) +
scale_y_continuous(breaks=seq(00, 100, 10)) +# Ticks on y-axis from 0-100, jumps by 10
geom_errorbar(aes(ymin=mean+se, ymax=mean-se), width = 0.12, size = 1) #adding error bars

## Warning: Using `size` aesthetic for lines was deprecated in ggplot2 3.4.0.
## ℹ Please use `linewidth` instead.
## This warning is displayed once every 8 hours.
## Call `lifecycle::last_lifecycle_warnings()` to see where this warning was
## generated.

anova3.lineplot

image

In the following code, we can make a custom legend for any figure. Feel free to play around with this code. I prefer to create my legend separate from the function I use to plot my data, just because the internal code for making the plots are a bit restrictive aesthetics-wise, especially if we are plotting more than 2 factors.

plot.new()
legend("center", # location on screen (center, upper right, etc)
title=" Exercise Beverage ", # bit of a hack here but I put lots of space to align with legend levels
legend=c("Yoga","Mindfulness","Placebo","Coffee"),
col=c("skyblue1", "darkred",'black','black'),
pch=c(1,19,NA,NA), # assigning point shapes
pt.cex = 2, # setting point size
lty =c(0,0,1,2), lwd =c(NA,NA,2,2), # assigning line type
bty="o", # border around legend box
box.lwd = 2, # thickness of border line
border=T, # border around legend box
horiz = T, # title is horizontal
title.font = 2.5,
cex = 0.765# size of the legend box
)


image

I recommend this link for more options with editing the boxplots

BOX PLOT

anova3.bxp <-ggboxplot(
mydata3, x = "Sleep", y = "TestScore",
color = "Exercise", palette = "grey",
facet.by = "Beverage", #specifying grouping variables for faceting the plot
# into multiple panels
bxp.errorbar = TRUE, bxp.errorbar.width = 1,
xlab = "Sleep (hrs)", ylab = "Judgement of Learning (JOL; %)"
) +
theme(axis.line=element_line(linewidth=1.5), #thickness of x-axis line
axis.text =element_text(size = 14, colour = "black"),
axis.title =element_text(size = 16, colour = "black"),
panel.grid.major.y =element_line() ) +# adding horizontal grid lines
scale_y_continuous(breaks=seq(0, 100, 10)) # Ticks on y-axis from 0-100,
# jumps by 10

anova3.bxp

image

Now, I used the “grey” colour palette, which is boring if you ask me. While there are many options when it comes to customizing the colour palette of your plot, here is a super cool and useful library for Scientific Journal and Sci-Fi Themed Color Palettes for ggplot2. Go to the following link to see all the available options and different ways of implementing them into your plots.

anova3.bxp.tron <-
anova3.bxp +
theme_dark() +#changing theme of plot
theme (panel.background =element_rect(fill = "#2D2D2D") )+#changing plot
# background color
scale_color_tron()

## Scale for colour is already present.
## Adding another scale for colour, which will replace the existing scale.

#This palette is inspired by the colours used in Tron Legacy. It is suitable for
#displaying data when using a dark theme

anova3.bxp.tron

image

BAR PLOT

anova3.barplot <-ggplot(anova3.summary.statistics, aes(x =factor(Sleep),
y = mean, fill =
Beverage:Exercise)) +
geom_bar(stat = "identity", position = "dodge") +
geom_errorbar(aes(ymax = mean + sd, ymin = mean - sd), #standard error bars
position =position_dodge(0.9), width = 0.25, color = "Gray25") +
xlab("Sleep (hrs)") +
ylab("Average Test Score (%)") +
scale_fill_brewer(palette = "RdPu") +
theme_classic() +
theme(legend.position = "none", # no legend
panel.grid.major.y =element_line() ) +# adding horizontal grid lines
scale_y_continuous(breaks=seq(0, 100, 10)) # Ticks on y-axis from 0-100, jumps by 10


# Let's do some exploring with these different colour palettes
#This palette is inspired by the colours used in the TV show The Simpsons
anova3.barplot.springfield <- anova3.barplot +scale_fill_simpsons()

## Scale for fill is already present.
## Adding another scale for fill, which will replace the existing scale.

#This palette is inspired by the colours used in the TV show Rick and Morty
anova3.barplot.schwifty <- anova3.barplot +scale_fill_rickandmorty()

## Scale for fill is already present.
## Adding another scale for fill, which will replace the existing scale.

#This colour palette is inspired by Frontiers:
anova3.barplot.default <- anova3.barplot +scale_fill_frontiers()

## Scale for fill is already present.
## Adding another scale for fill, which will replace the existing scale.

Now, what if we wanted to publish all these different variations of the bar plot on the same page? Using the following function, we can organize two or more plots into the same page for printing. By specifying the number of columns, you are organizing the plots horizontally, each occupying a column. By specifying the number of rows you can organize the plots vertically. We can also adjust the size of this figure with all three plots. Depending on how similar the plots are, you can also request to have a common legend by entering “T” for “common.legend”, wherein R will automatically generate a legend for you. However, I prefer to create my own legend, which we will do in the next chunk of code.

barplots <-arrangeGrob(anova3.barplot, anova3.barplot.default,
anova3.barplot.schwifty, anova3.barplot.springfield,
nrow = 2, ncol = 2)

# Add labels to the arranged plots
barplots.gg <-as_ggplot(barplots) +#transform to a ggplot
draw_plot_label(label =c("A", "B", "C", "D"), size = 14, #add labels
x =c(0, 0.5, 0, 0.5), #specifying location of labels horizontally
y =c(1.017, 1.017, 0.53, 0.53)) #specifying location of labels
#vertically
# You can play around with the vertical and horizontal coordinates
# (corresponding to the label in the order they are listed).

barplots.gg

image

Computing Three-Way ANOVA

There are a bunch of options when it comes to conducting a three-way ANOVA. The afex library in particular provides three functions for calculating ANOVAs. These functions produce the same output but differ in the way how to specify the ANOVA.

  1. aov_car()
  2. aov_ez()
  3. aov_4()

I will continue using the same function that we used for our two-way ANOVAs. However, I would encourage you to look into these other functions on your own time to find the one that you are most comfortable using, or if the options may be more useful to you. Here are the following resources to get you started on the afex library:

# Three-Way Mixed ANOVA (2 BLOCK_TYPE x 2 TRIAL-TYPE x 3 SOA)
anova3.aov <-anova_test(
data = mydata3,
dv = TestScore,
wid = ID, #factor containing individuals/subjects identifier. Should be unique
# per individual.
between = Exercise, #(optional) between-subject factor variable(s)
within =c(Beverage, Sleep), #(optional) within-subjects factor variables
detailed = TRUE, #If TRUE, returns extra information (sums of squares columns,
#intercept row, etc.)
effect.size = "ges"#generalized eta squared or "pes" (partial eta squared),
#the option "both" is bugged and currently doesn't work
)

# Applies the Greenhouse Geisser correction to effects only when sphericity is violated
anova3.aov <-get_anova_table(anova3.aov, correction = "auto")
# ?get_anova_table() to see other viable correction options

Now, I prefer to report two measures of effect size, both partial and generalized eta square values. So to add pes I decided to calculate it by hand. I also report the standard error of the mean value by hand included below:

# Calculate partial eta square and add it as a new column named "pes"
# Codes for MSE and pes retrieved from
# https://sherif.io/2014/12/10/ANOVA_in_R.html
anova3.aov$pes = anova3.aov$SSn/(anova3.aov$SSn + anova3.aov$SSd)

# Calculate mean sum of error and add it as a new column named "MSE"
anova3.aov$MSE = anova3.aov$SSd/anova3.aov$DFd

#store ANOVA tables as a dataframe
anova3.aov <-data.frame(anova3.aov)

# Deleting intercept info (first row)
anova3.aov <- anova3.aov[-1, ] #removing first row

# Okay, let's make some beautiful printable ANOVA tables
# Selecting which values by column name we want to report from the detailed ANOVA table
anova3.aov.printable <- anova3.aov %>%select("Effect", "DFn", "DFd",
"F", "MSE", "p", "p..05", "pes", "ges")

# Rename columns
colnames(anova3.aov.printable)[colnames(anova3.aov.printable) =="pes"] ="η2P"
colnames(anova3.aov.printable)[colnames(anova3.aov.printable) =="ges"] ="η2G"
colnames(anova3.aov.printable)[colnames(anova3.aov.printable) =="p..05"] ="sig"

#anova3.aov.printable %>%
# kbl(caption = "THREE-WAY MIXED ANOVA") %>%
# kable_classic(full_width = F, html_font = "Cambria", font_size = 10) %>%
# add_header_above(c(" " = 2, "Test Score (%)" = 8)) %>%
# add_footnote("Correction: Greenhouse Geisser")

Post Hoc Analyses

The rule of thumb is to decompose the highest-order interaction. If there was a significant three-way interaction effect, you should decompose it into: 1. Simple two-way interaction: essentially you must run two two-way interactions at each level of a third variable. If there are any significant two-way interactions, then you must further decompose it into… 2. Simple simple main effect: run one-way ANOVA at each level of a second variable. If there is a significant effect here then conduct a … 3. Simple simple pairwise comparisons: run pairwise or other post-hoc comparisons.

If you have read through the two-way and one-way ANOVA models earlier in the document, then you should have no issues with the following next few steps. As you can see, decomposing high-order interactions is very intuitive, you are simply retracing your steps to get to the bottom of where the differences lie between our groups and their levels.

If you don’t have a significant three-way interaction… which is the case in the current example, then you need to determine whether you have any statistically significant two-way interactions. In our case, we have two: 1. Beverage x sleep interaction, which is analogous to a significant interaction from a within-subjects two-way ANOVA 2. Exercise x beverage interaction, which is comparable to a significant interaction from a mixed two-way ANOVA. In this case, we will retrace our steps by conducting one-way ANOVAs looking into the effect of one factor at every level of the other factor it is interacting with (i.e., simple main effects analyses) and then pairwise comparisons if necessary.

# Decomposing the Exercise x Beverage and Beverage x Sleep Interactions
# Analyzing the simple simple main effect of Exercise at each level of Beverage:

mydata3.coffee <- anova_test(data = filter(mydata3, Beverage == “Coffee”), wid = ID, within = Sleep,  between = Exercise, 

dv= TestScore, detailed = TRUE, effect.size = “pes”)


mydata3.placebo <- anova_test(data = filter(mydata3, Beverage == “Placebo”), wid = ID, within = Sleep,
between = Exercise, dv= TestScore, detailed = TRUE, effect.size = “pes”)

#Extracting ANOVA tables as data-frames
mydata3.coffee <- data.frame (get_anova_table(mydata3.coffee, correction = “auto”) )

mydata3.placebo <- data.frame (get_anova_table(mydata3.placebo, correction = “auto”) )

# Let’s make nice printable tables; note that I skipped calculating the MSE and opted to not have generalized eta squared in my table. # That was done purely to keep this guide a bit shorter. You are well equipped with the proper codes in the previous ANOVAs to calculate # them on your own. Deleting intercept info (first row)

mydata3.coffee <- mydata3.coffee[1, ]
mydata3.placebo <- mydata3.placebo[1, ]

# colnames(mydata3.coffee) #get all column names
# Select Columns to keep by name
mydata3.coffee <- mydata3.coffee %>% select(“Effect”, “DFn”, “DFd”, “F”, “p”, “p..05”, “pes”)
mydata3.placebo <- mydata3.placebo %>% select(“Effect”, “DFn”, “DFd”, “F”, “p”, “p..05”, “pes”)

# Combining tables
mydata3.ss.results <- cbind(mydata3.coffee , mydata3.placebo)

# Rename columns
colnames(mydata3.ss.results)[colnames(mydata3.ss.results) == “pes”] =“η2P”
colnames(mydata3.ss.results)[colnames(mydata3.ss.results) == “ges”] =“η2G”
colnames(mydata3.ss.results)[colnames(mydata3.ss.results) == “p..05”] =“sig”

# Making printable ANOVA html
mydata3.ss.results %>%
kbl(caption = “Simple Simple Main Effect of Exercise at each level
of Beverage”) %>%
kable_classic(full_width = F, html_font = “Cambria”, font_size = 10) %>%
add_header_above(c(” ” = 1, “Coffee” = 7, “Placebo” = 7)) %>%
add_footnote(“Correction: Greenhouse Geisser”)

Since there are no significant two-way interactions, we will not be conducting pair-wise comparisons.

Reporting We submitted test scores to a three-way ANOVA with Beverage (Coffee vs. Placebo) and Sleep (0/5/8 hours) as within-participant variables and Exercise (yoga vs. mindfulness) as a between-participant variable. The ANOVA showed a significant main effect of exercise [F(1,170) = 33.0, MSE = 472.7, p <0.001, partial eta squared = 0.163], beverage [F(1,170) = 1222.8, MSE = 266.3, p <0.001, partial eta squared = 0.878], and sleep [F(1.3,219.3) = 525.1, MSE = 111.2, p <0.001, partial eta squared = 0.755]. There was also a significant exercise-by-beverage interaction [F(1,170) = 52.2, MSE = 266.3, p <0.001, partial eta squared = 0.235] as well as a beverage-by-sleep interaction [F(1.5,257.3) = 462.1, MSE = 68.8, p <0.001, partial eta squared = 0.731]. These interactions were decomposed by submitting test scores from the coffee and placebo conditions to separate mixed two-way ANOVAs with sleep as a within-participant factor, and Exercise as a between-participant variable.

A separate analysis of the placebo condition revealed a significant effect of exercise [F(1,170) = 45.3, p <0.001, partial eta squared = 0.210] and effect of sleep [F(1.4,238.4) = 238.4, p <0.001, partial eta squared = 0.771]. Analysis of the coffee condition revealed only a significant effect of sleep [F(1.2,206.8) = 46.9, p <0.001, partial eta squared = 0.216].


Practice

If you are interested in putting your newfound skills to the test then I have included two data sets as well as a separate script with all the answers. I highly recommend that you analyze the data on your own using the codes mentioned here and just check your answers with the script.

The first data set is named “HW1_RTut.xlsx”. In this example, we have two random samples, groups A and B. We have a certain numerical measure under the column “Value”. We are interested in whether there is a significant difference between the two groups.

The second data set is named “HW2_RTut.xlsx”. And is as such:

  1. Participants represent different individuals.
  2. WithinSubjectVar is a within-subjects variable with three levels (repeated measures).
  3. BetweenSubjectVar is a between-subjects variable with two levels (Group A and Group B). 4. Response is a continuous variable.

We are interested in the effect of the WithinSubjectVar and BetweenSubjectVar on Response

22

Week 6 Exercises

An interactive H5P element has been excluded from this version of the text. You can view it online here:
https://ecampusontario.pressbooks.pub/craftingresearchnarratives/?p=405#h5p-15

VII

WEEK 7: Crafting Your Introduction


As the pieces of our thesis puzzle start fitting together seamlessly, we find ourselves at a pivotal juncture.


With the completion of our methods and results sections, the time has come to write the introduction of our paper. This phase is the fruit of our laborious and consistent weekly engagements with scholarly articles, spirited academic discussions, and diligent note-taking. Our aim for the introduction is not merely to start the paper but to lay down a compelling narrative foundation for our research. As researchers, we must understand that our responsibilities go far beyond the discovery phase; we are entrusted with the vital task of effectively communicating our science. It’s this ability to communicate that distinguishes a proficient researcher from an exceptional one. Scientific articles should not be perceived as daunting texts reserved for experts; instead, they must strive towards inclusivity and accessibility, welcoming readers with varied backgrounds.

This week, our mission is to sculpt an introduction that does more than introduce; it should narrate. We plan to guide our readers through a meticulously thought-out journey, starting from the research problem that has captured our attention, moving through the gaps in the existing literature that our study aims to bridge, articulating why our research is significant, and finally, presenting our study as the proposed solution. This narrative arc is designed to be more than informational; it aims to connect, engaging the reader’s curiosity and intellect.

Our overarching goal is to transcend the barriers of technical jargon, making our research not just accessible but also engaging and inviting. We envision our introduction as a gateway, opening up the complexities of our study in a manner that is comprehensible and appealing to a broad audience. By achieving this, we do more than just enhance the reach and discoverability of our work; we actively invite a wider audience into the conversation around our scientific inquiry. This strategy not only broadens the impact of our research but also bridges the gap between complex scientific concepts and the public’s understanding. In doing so, we transform our research from a mere scholarly contribution into a meaningful dialogue that welcomes diverse perspectives and enriches the collective knowledge of our field. Through this approach, we aim to not only contribute to the academic discourse but also to democratize science, making it a shared venture that resonates with and benefits a wider community.


Scientific Communication: Aligning Your Manuscript with Your Audience

Having addressed the importance of inclusivity in your paper, it’s crucial to also focus on the significance of identifying and catering to your target audience. This isn’t to critique highly specialized papers that, at a glance, appear exceedingly niche and intended for a narrowly defined group. Such papers fulfill a critical role by creating a research narrative tailored to their specific audience. For example, if these papers were to dilute the complexity and specificity of their research to appeal to a broader audience, they might fail to engage or be valued by their intended readers—those experts deeply invested in nuanced findings within a particular domain. For a general audience, elaborating on various concepts and engaging in extended discussions of effects and the literature in the introduction can be highly valuable, offering a deeper understanding and appreciation of the subject. However, for experts who are likely familiar with much of the cited work, such extensive exposition might come across as redundant, making the paper tedious and less engaging. They might perceive it as an overly detailed and somewhat monotonous read. Therefore, striking a balance is crucial when considering your readership. Tailoring your introduction to include necessary context and depth for those less familiar with the topic, while also keeping it concise and directly relevant for experts, ensures that your paper resonates with a diverse audience. This balance ensures that your work remains accessible and informative to novices without sacrificing the interest and engagement of seasoned scholars in your field.

Therefore, engaging in a dialogue with your supervisor about the intended audience for your paper is essential. Most likely your paper will primarily be read and evaluated by your supervisor, who is well-versed in the subject matter. As such, they may not necessitate an extensive background introduction or explanations of terms and phenomena already familiar to them. The key is to tailor your paper to meet the expectations of such an audience, striking a balance between providing necessary information and maintaining conciseness and depth. Your aim should be to produce a paper that your supervisor finds both informative and succinct.

Crafting your paper with your target audience in mind does not mean compromising the quality or integrity of your research. Instead, it involves making strategic decisions about how to present your findings, what level of detail to include, and which aspects of your research to emphasize. By doing so, you ensure that your paper not only adheres to academic standards but also resonates with and is appreciated by those who are most invested in your work.

In summary, while striving for inclusivity, do not lose sight of the importance of specificity and relevance to your target audience. This approach ensures that your paper is both accessible to a wider audience and deeply engaging to the experts most interested in your findings. Discussing these considerations with your supervisor can provide valuable insights into how to best structure your paper, making it a compelling and impactful contribution to your field.


Adhering to Guidelines

Before you begin drafting your introduction, it’s essential to be aware of any specific requirements set by your institution or supervisors regarding the word or page count, as well as the formatting guidelines for your introduction. For instance, in my own experience with an undergraduate thesis project, my instructor set clear expectations: the introduction should be at least 5 pages but no more than 7 pages, double-spaced, and formatted according to the standard APA guidelines. He mentioned there was a little bit of flexibility, allowing for an introduction that might extend to 7.5 pages without cause for concern. However, he emphasized the importance of not falling below the 5-page minimum. These precise instructions provided a solid foundation for crafting my introduction.

For my master’s thesis, on the other hand, the introduction was significantly longer, spanning 12 double-spaced pages. It had to conform to more stringent departmental guidelines, which were detailed in an extensive document outlining specific requirements for headings, subheadings, and other formatting details. This experience highlights that, while undergraduate thesis guidelines might be somewhat flexible and largely determined by the individual supervisor, graduate-level work often adheres to more rigorous departmental standards. It’s crucial, therefore, to familiarize yourself with these guidelines early on in your thesis preparation. As a graduate student, you’ll likely encounter strict formatting and structural expectations set by your department, which are important to follow closely as you draft your introduction and other sections of your thesis.

23

The Art of Composing a Research Narrative


Writing an introduction to a thesis is very much an art form; it is an exercise in storytelling where you, as the author, are tasked with drawing the reader into a world of inquiry and exploration. The introduction is your opening chapter, a place where the broader context of your work is set against the backdrop of existing knowledge, where you introduce the major themes, the critical gaps your research seeks to bridge, and the significance of your journey. As a Ph.D. student who has traversed the path of both undergraduate and graduate research, and as a mentor to other students, I’ve delved into a multitude of introductory chapters across various theses. This unique vantage point has afforded me a deep appreciation for the art of academic storytelling, and here, I share my counsel for those on the cusp of weaving their own research tales.

Capturing Your Reader’s Interest

In the opening paragraph of your thesis, it’s important to capture the reader’s attention by introducing a broader theme that resonates with your research focus. To reinforce this introduction and lend it greater impact, incorporate research findings, data, and insightful quotations from reputable sources like international or national professional bodies, governmental organizations, or leading experts in your field. An effective strategy to underscore the relevance of your study is to contextualize your research within everyday scenarios, highlighting its practical significance. For example, if your research explores the mechanisms of selective attentional control, you could start by illustrating a scenario where selective attention is crucial—such as the need to focus on relevant stimuli while driving. This approach not only engages the reader but also vividly demonstrates the real-world applicability and importance of your research.


Offering a Guided Preview (Optional)

Incorporating a roadmap early in your introduction is a thoughtful strategy to prepare your readers for the journey they are about to embark on through your thesis. This brief paragraph acts as a guided preview, outlining the narrative structure of your introduction and setting expectations for the flow of information. For instance, you could signal to your readers that the journey will commence with a concise overview of the wider field or domain, laying the groundwork for the focal point of your study. Following this, the discourse will taper to areas directly pertinent to your research, culminating in a brief overview of the proposed study along with your research objectives.

Such a roadmap is instrumental in navigating the introductory landscape, significantly bolstering understanding by contextually anchoring your research from the get-go. It serves as a beacon, guiding the reader through the initial exploration of the general field before delving into the specifics of your research question, the rationale behind your study, and the significance of your work within the broader academic conversation. By providing this structured outline, you facilitate a smoother transition for your readers, enabling them to grasp the scope of your research and its place within the existing body of knowledge. This approach ensures that your introduction is not just a collection of paragraphs but a cohesive narrative that logically progresses from the general to the specific, effectively setting the stage for the detailed discussions that follow.

Setting the Scene

Just as a novelist meticulously constructs the setting of their story, your introduction must skillfully lay out the landscape of your research field. This section is your opportunity to showcase your mastery of your chosen topic by providing a comprehensive summary of the current literature. Here, you draw upon existing knowledge (i.e., your weekly readings) to give your reader a thorough overview of what has been explored, what is currently being investigated, and what remains to be addressed to propel the field forward. Begin with a broad sweep of the field or subject area to orient your reader and underscore the significance of your research within the wider academic conversation.

Your narrative should seamlessly transition from exploring the broader aspects of the topic to zeroing in on the specific area of your research. A useful guideline is to proceed as if the reader is unfamiliar with your topic, ensuring accessibility and inclusiveness. Yet, it is vital to strike a balance that resonates with your intended audience, such as your supervisor, tailoring the depth and detail of your discussion accordingly.

Clarification and explanation of key definitions and foundational concepts are crucial, particularly those derived from seminal research. Should you find the existing definitions inadequate or unsatisfactory upon reviewing the literature, do not hesitate to refine or introduce your own, making sure to clearly signal such contributions. This approach not only evidences your deep engagement with the topic but also enhances the academic dialogue by offering refined and clearer conceptual understandings.

From Broad to Narrow: Zeroing on Your Niche

Gradually refine your focus, honing in on the distinct area/niche your research addresses. This process involves a critical identification of the gaps in the current body of knowledge that your study seeks to bridge. The journey from a broad overview to a pinpointed research question is vital, as it underscores the importance and urgency of your investigation. To compellingly advocate for your research, you must articulate a persuasive rationale for its undertaking, highlighting its potential to significantly enrich the existing literature. Achieve this by first pinpointing a specific gap or limitation within the current literature and illustrating how your study proposes a resolution or enhancement. I hope that you can appreciate how following the narrative structure proposed here, from broad to narrow sets up a natural transition to the next section of your paper, being your methods. This strategic alignment not only justifies the need for your research but also positions it as a valuable contribution to the field, signalling its capacity to advance understanding or offer novel insights.


Articulate Your Research Question(s)

It is crucial to precisely and clearly articulate your research question(s) or hypothesis, as this will form the cornerstone of your thesis. This declaration should be concise, targeted, and a direct reflection of the identified gaps, serving as the guiding light for your narrative’s development.

You must mention three or four key research objectives that will underpin your investigation, providing a clear direction for your study. Depending on the methodological approach of your research, include corresponding research questions for qualitative studies or hypotheses for quantitative studies. These components are generally derived from your research objectives and furnish a coherent structure for your exploration.

I would like to note that your research objectives, questions, or hypotheses are designed to be flexible, allowing for refinement as your investigation progresses and new findings emerge. For example, should initial experiments yield results contrary to your expectations, it might prompt the design of follow-up experiments to explore these discrepancies further. However, should there be no immediate research to explain these outcomes, it is not advisable to alter your hypothesis retroactively. Instead, maintain the integrity of your original hypotheses in your introduction delve into potential theories or explanations for these unexpected results in your discussion section and mention the need for further research.

This adaptive approach ensures that your research remains rigorous and transparent, allowing for the exploration of unforeseen outcomes without compromising the initial premise of your study. By framing your introduction this way, you set a solid foundation for your thesis and demonstrate a commitment to a thoughtful, analytical exploration of your research question(s), adaptable to the dynamic nature of academic inquiry.


Outline Your Methodological Approach

After integrating your research into the wider academic conversation and positioning your study as a resolution to the gaps identified in existing literature, the final sections of your introduction should focus explicitly on your research. Provide a concise overview of your methodological approach. This overview serves as an essential snapshot, giving the reader a clear view of how you intend to bridge the existing knowledge gaps. It’s crucial to strike a balance here; provide enough detail to illuminate how your study directly engages with the issues highlighted earlier in your introduction, but avoid delving into the extensive specifics that belong in the methods section.

This strategic presentation allows your audience to grasp the connection between your research question(s), hypotheses, and the methodological strategies you’ve chosen. It essentially sketches the blueprint of your study, offering insights into both the direction you intend to take and the scope of your investigation. By doing so, you equip your reader with a comprehensive understanding of how your research is positioned to contribute meaningful answers to the questions at hand, setting the stage for the detailed exploration to come in the subsequent sections of your thesis.

Furthermore, mentioning any predictions based on your hypotheses at this point serves to sharpen the focus of your introduction, providing a natural segue to the methods section. Concluding your introduction with these forward-looking statements not only captivates the reader’s interest but also sets the perfect stage for delving into the methodologies you will employ. This structured approach ensures that your introduction not only contextualizes your research within the broader academic framework but also primes the reader for the detailed examination of your methodological approach, enhancing the coherence and flow of your thesis.

Let Your Passion Shine Through

Finally, let your passion shine through by infusing your introduction with the passion that drove your research. The tone of genuine engagement and curiosity not only enriches the narrative but also significantly boosts the reader’s interest and connection to your work. This element of passion is what transforms a standard introduction into an inviting and compelling prologue to your research journey.

Your introduction serves as the thesis’s initial handshake with the reader, establishing the first and most crucial impression. It is the preamble that sets the stage for the intricate dance of ideas and discoveries that follow. A well-crafted introduction, brimming with enthusiasm for the subject matter, has the power to captivate your audience right from the start, ensuring they are as invested in the journey as you are.

By embracing these principles, you can sculpt an introduction that not only adheres to the highest academic rigours but also deeply resonates with your audience. Such an introduction lays a robust and inviting foundation for the unfolding of your research narrative, promising a journey that is both enlightening and impassioned.


Don’t Leave Your Reader Hanging

A common feedback I often find myself offering to students is the observation that their thought process isn’t fully evident in their work. This issue, which I encounter even in my own writing, stems from a simple yet pervasive oversight: when articulating claims or making points, it’s crucial to thoroughly unpack your reasoning. As the writer and subject matter expert, connections between ideas might seem self-evident to you, given that you’ve conceived these ideas and understand intimately how they’re interconnected. From your perspective, your writing might appear fluid and logically coherent, leading you to believe that your conclusions are the only possible interpretations.

However, it’s essential to remember that your audience consists of deep thinkers whose backgrounds and areas of expertise may differ significantly from your own. As such, leaving any part of your discussion open to interpretation can lead to misinterpretations, with readers potentially drawing conclusions vastly different from what you intended, thereby muddling subsequent claims you make. Essentially, every writer needs to adopt the role of a devil’s advocate, revisiting their initial drafts after some time to review them with fresh eyes. This practice of self-reviewing and seeking external feedback on your drafts is invaluable, as it helps to identify and rectify any areas where your thought process may not be as transparent as you assumed.

Moreover, always make it a point to elaborate on your reasoning. Your readers should never find themselves puzzled over how or why you arrived at a particular conclusion. By explicitly detailing the steps of your thought process, you ensure that your narrative is accessible and comprehensible, paving the way for a more engaged and informed readership. Remember, clarity in your thought process not only enhances the coherence of your argument but also bolsters the overall persuasiveness of your work.

In Case of Multiple Experiments

In thesis projects that include multiple experiments, it is a standard approach to sequence the document starting with an overarching Introduction, followed by distinct sections for each experiment—each labelled accordingly (e.g., “Experiment 1,” “Experiment 2,” “Experiment 3,” etc.). These sections typically include Methods, Results, and short Discussion subsections, mirroring the structure of the thesis itself on a micro level. To enhance the reader’s comprehension, it is advisable to start each experiment with a brief, targeted introduction.

These preliminary overviews, ideally spanning 2-3 paragraphs and not exceeding a single page when double-spaced, are designed to provide a snapshot of each experiment. They should efficiently summarize the specific objectives, methodologies, and expected contributions of each experiment, situating them within the larger thesis narrative. The purpose of these introductions is to guide the reader through the unique aspects and rationale of each experiment, thereby avoiding the need for readers to revisit the general introduction to grasp the context of subsequent experiments.

By integrating these concise introductions, you not only offer a lucid roadmap through your experimental journey but also significantly elevate the reader’s understanding and engagement with your work. This technique ensures that each experiment is linked to the overall research objectives, highlighting the methodical advancement and interconnectivity of your investigative efforts. Moreover, this approach serves to streamline the reader’s experience, making the thesis not only more coherent but also more accessible. The inclusion of these concise experiment introductions is pivotal in achieving a seamless narrative flow, reinforcing the logical progression of your research and underscoring the cumulative impact of your findings.

24

Tips on Avoiding Writer's Block

While this week’s exercises may appear limited in quantity, this by no means lessens the considerable amount of work that lies ahead. Crafting an introduction is arguably the most challenging aspect of any thesis project, a sentiment I can personally attest to from my own experience. The introduction sets the tone for your entire thesis, requiring a delicate balance of breadth, depth, and engaging narrative that can indeed be daunting. To assist you in this critical task and to help stave off writer’s block, here are some general tips and strategies I’ve found to be particularly helpful.


An interactive H5P element has been excluded from this version of the text. You can view it online here:
https://ecampusontario.pressbooks.pub/craftingresearchnarratives/?p=429#h5p-16


25

Week 7 Exercises

An interactive H5P element has been excluded from this version of the text. You can view it online here:
https://ecampusontario.pressbooks.pub/craftingresearchnarratives/?p=432#h5p-18


An interactive H5P element has been excluded from this version of the text. You can view it online here:
https://ecampusontario.pressbooks.pub/craftingresearchnarratives/?p=432#h5p-17


VIII

Week 8: A Guide to Writing Your Discussion


Welcome back, scholars!

We are now approaching the final stretch, and it’s time to conclude our journey with a flourish. This week marks the culmination of our efforts, as we turn our attention to crafting the discussion section of your paper. This pivotal component is where we’ll weave together the threads of our research, interpret the findings, and contextualize them within the broader academic dialogue. It’s the last significant milestone before completing your project, so let’s engage with enthusiasm and dedication to ensure our research narrative is compelling and conclusive.

The structure of the discussion section is significantly influenced by the methodological approach of the research—be it quantitative or qualitative. In qualitative studies, common within the field of Humanities and Social Sciences, it’s typical to see a fusion of the discussion and results sections. This integrated approach allows for a consistent narrative that simultaneously presents data and explores its implications. On the other hand, research in the Sciences often adheres to a more segmented structure, with distinct sections for results and discussion, each serving its specific purpose.

Further complexity is added when considering the relationship between the discussion and conclusion sections. The discussion offers a space for a thorough analysis and interpretation of the findings, setting the stage for the conclusion, wherein we summarize the key takeaways of the research. However, it’s not uncommon for some fields to merge these sections, creating a cohesive narrative that both interprets data and highlights its significance in a single segment.

Deciding on the appropriate structure for these sections can be challenging and varies by disciplinary conventions and specific research requirements. If in doubt, seeking advice from your supervisor is invaluable, as is familiarizing yourself with the guidelines and expectations set forth by your academic institution. This guidance ensures that your thesis not only adheres to disciplinary norms but also effectively communicates the significance of your research within the academic community.

In Case of Multiple Experiments

If your thesis research comprises multiple studies, incorporating mini-discussion sections for each experiment is highly recommended. These concise discussions, ideally limited to one or two paragraphs, should effectively state the principal findings or conclusions derived from each specific study. Their primary function is to provide a brief yet comprehensive summary of the outcomes, facilitating a smooth transition between experiments by rationalizing the subsequent experiment.

These mini-discussions act as pivotal junctures within your thesis, reflecting on the implications of each study’s results and how they contribute to the overarching research narrative. They are instrumental in maintaining the flow of your thesis, ensuring that each experiment builds logically on its predecessor and seamlessly leads into the next, thereby reinforcing the cumulative nature of your research inquiry.

Furthermore, should you encounter findings that warrant a more in-depth exploration or discussion, it is prudent to indicate within these sections that a thorough examination of these particular points will be deferred to the general discussion section. This strategy not only keeps the immediate discussions focused and concise but also signals to the reader that they can anticipate a more detailed analysis of significant results. This approach ensures clarity and coherence throughout your thesis, enabling readers to follow the evolution of your research insights while preserving a sense of anticipation for a fuller exploration in the concluding discussions.

26

General Discussion: Bringing It All Together

The discussion section serves as the heart of your research paper, where the true depth, significance, and relevance of your findings are revealed. While the results section is dedicated to presenting the raw data, the discussion section delves into its interpretation, offering insights and connecting the findings to the broader academic discourse. It’s an opportunity to interpret your data in the context of existing research, highlighting how your work either aligns with or diverges from established theories and discussions. This is where you demonstrate the contribution of your research to the field, articulating the novel insights your study provides and the implications these have for future research and practice.

While the introduction of your paper expanded from broad to narrow, the discussion section inversely narrows to broad. Your general discussion starts with an in-depth analysis of the main findings, elucidating their implications and how they address the research questions. The discussion then widens to place these insights within the general context of the field of study. Additionally, this section showcases your capacity for critical thinking and the formulation of creative solutions to challenges, all derived from your findings. This approach ensures your findings are both thoroughly explored and contextualized within the wider academic and practical realms. Below is a step-by-step guide to help you craft a compelling discussion section.

Step 1

Restating the Main Research Question

By the time your readers arrive at the discussion section of your paper, they have navigated through the dense terrain of your methods and results sections, possibly becoming entangled in the intricate nuances of particular experiments. Given this, it is crucial to begin your General Discussion by clearly restating your thesis question and hypothesis that were stated in the introduction. This serves as a vital anchor, refocusing your audience’s attention on the broader objectives and central inquiries of your study. It acts as a reminder of the original motivations and goals that guided your research, setting the stage for a deeper exploration of how your findings contribute to the existing body of knowledge, addressing the gaps identified in the literature and potentially opening new avenues for future research.


Step 2

Summarizing Key Findings

Continue by providing a summary of your most critical findings to support the answer to your thesis question. Avoid merely repeating the data you’ve already presented in detail. Instead, focus on distilling a concise statement that directly tackles your main research question. This summary should be concise, aiming to capture the essence of your findings in a single, well-structured paragraph. This approach not only reinforces the key outcomes of your research but also provides a clear and focused reflection on how these outcomes address the core question driving your study, offering your readers a clear view of your research’s significant contributions.


Step 3

Interpret Key Findings

Next, detail the significance of your key findings to demonstrate precisely how they address and illuminate your research question. Remember to never leave your reader hanging. Elaborate on the thought process behind your interpretations and conclusions; don’t leave any gaps in understanding. Before stating a claim or arriving at a conclusion, meticulously walk your reader through the logical sequence and reasoning that led you there. This meticulous approach ensures that your readers are not left grappling with unexplained leaps in logic or unsupported statements. By providing a clear and detailed exposition of how you’ve synthesized the data to reach your conclusions, you not only bolster the credibility of your argument but also engage your readers in a deeper, more meaningful exploration of your research findings. This level of transparency and thoroughness in explaining your analytical process is crucial for fostering a robust and trustful academic dialogue.

The manner in which you interpret your main findings will vary depending on your research methodology. However, there are several common strategies for making sense of your data, including:

  • Highlighting Correlations and Patterns: Unveil the connections, trends, and relationships that emerge from your data, offering insights into how these elements interact within the context of your study.
    • Remember correlation does not equal causation!
  • Evaluating Expectations Versus Reality: Reflect on whether your results aligned with your initial predictions or if they diverged, providing support for your hypotheses or compelling you to reconsider your stance.
  • Addressing the Unexpected: If your study yielded surprising outcomes, assess their implications and discuss their broader significance.
  • Weighing Alternative Interpretations: While presenting your findings, also consider other potential explanations, crafting a well-reasoned argument that supports your interpretation over others.


Step 4

Implications

It’s crucial not only to present your own interpretations but also to place your key findings within the landscape of existing research and theoretical frameworks, demonstrating how your work contributes to or challenges these established paradigms. This segment of the discussion should demonstrate how your results align with, diverge from, or expand upon the existing knowledge. It’s about weaving your findings into the broader academic discourse, highlighting the novel perspectives or understanding they bring and the potential implications your findings have for theoretical frameworks or practical applications. For this step here are some points to consider:

  • Alignment with or Deviation from Established Theories: Do your findings support current theoretical models, or do they cast these models in a new light? If they affirm established theories, pinpoint the fresh nuances or dimensions your research introduces. If they seem to contradict or modify existing frameworks, explore possible reasons for these discrepancies.
  • Practical Repercussions: Contemplate the tangible impacts of your research. How might your findings influence industry practices, policy-making, or other applied fields? This reflection can underscore the real-world relevance of your study.

To be even more clear, you should aim to answer the following questions when writing this portion of your General Discussion.

  • Do other studies corroborate your findings, contributing new insights or filling gaps?
  • If your findings diverge from others, what could be the reason(s)?
  • Do your results affirm or contest established theories?
  • What practical outcomes emerge from your findings?

The overarching goal is to articulate the value of your research clearly and compellingly. Your task is to convince the reader of the significance of your work—how it enriches the academic dialogue, pushes the boundaries of knowledge, and holds potential ramifications for theory and practice alike. By meticulously addressing these aspects, you not only affirm the importance of your research within your field but also underscore why it merits attention and further exploration.

Step 5

Limitations and Future Direction

Even the most meticulously conducted research comes with its set of limitations. Openly acknowledging these limitations is not an admission of failure but a testament to the rigour and transparency of your scientific inquiry. It’s essential to understand that discussing limitations is not about cataloging your mistakes; rather, it’s about offering a clear and honest appraisal of what your study’s results can definitively conclude and what they leave unanswered.

These limitations could stem from your research design, specific choices made during the methodological process, or unexpected challenges that arose while conducting your study. Regardless of their origin, these constraints shape the scope of your conclusions and the generalizability of your findings. After acknowledging these limitations, it’s crucial to circle back to the validity of your results within the scope of your research objectives. Emphasize that, despite these limitations, your findings provide meaningful contributions to answering your central research question. Highlight how your study advances the current state of knowledge, opens new avenues for inquiry, or has practical implications despite the constraints encountered.

This balanced approach to discussing limitations—paired with a reaffirmation of your study’s value—underscores the thoughtfulness and rigour of your research process. It reinforces the notion that while no study is without its boundaries, the insights gained are nonetheless instrumental in pushing the boundaries of understanding in your field.

Moreover, offer recommendations that either suggest avenues for practical application of your findings or propose directions for future research. When suggesting areas for future inquiry, it’s important to go beyond the mere claim that additional research is needed. Propose specific, actionable research questions or methodologies that future studies could employ to explore the gaps or unanswered questions left by your research. This approach not only demonstrates a deep engagement with your topic but also lays the groundwork for future scholarly work, encouraging a continuous cycle of inquiry and discovery.

By integrating a thoughtful consideration of your study’s limitations with constructive recommendations for future research or practical implementation, you enrich the academic dialogue and contribute to the ongoing refinement and expansion of knowledge in your field.

Here are several scenarios that might necessitate a discussion of limitations and how to effectively articulate them:

  • Sample Size and Demographics: If your research relied on a small or highly specific group of participants, it’s important to discuss the implications for the generalizability of your findings. Acknowledge that while your results offer valuable insights within the context of your sample, extending these conclusions to a broader population may be constrained by the sample’s size or demographic makeup.
  • Data Collection and Analysis Challenges: Encountering hurdles in gathering or analyzing data is not uncommon. Transparently discussing these challenges helps readers understand their potential impact on your study’s outcomes. Whether it was a technical glitch in data collection tools or limitations in the analytical methods employed, explaining these issues provides a clearer picture of how they might have influenced the reliability or interpretation of your results.
  • Uncontrolled Confounding Variables: In many research scenarios, completely controlling for all potential confounding variables is challenging, if not impossible. If there were factors outside of your control that could have affected the study’s outcomes, openly acknowledging these and discussing their potential influence lends credibility to your research. It shows a comprehensive understanding of the study’s context and the complexities involved in your field of inquiry.
  • Resource and Technology Constraints: Limited access to resources or technology can also impact the breadth and depth of a study. Whether it’s a lack of funding for a larger sample size or the absence of advanced technological tools for data analysis, these constraints can affect the scope of your research. Discussing how these factors limited your study helps underscore the potential for future research under better-resourced conditions.
  • Temporal and Geographical Limitations: Studies conducted within a specific time frame or geographic location may have results that are not applicable elsewhere or at other times. Acknowledging these limitations is crucial for readers to accurately gauge the applicability of your findings beyond the study’s immediate context.

Avoiding the Usual Traps

Crafting the discussion section of your paper requires a delicate balance, focusing on the interpretation and implications of your findings without veering into uncharted territory. To ensure clarity and precision in your narrative, there are specific pitfalls you should conscientiously avoid:

  • Don’t Introduce New Results: The discussion section is not the place for surprises. Every piece of data you discuss should have been previously introduced in your results section. Introducing new findings here can confuse readers and disrupt the flow of your argument. Stick to analyzing and interpreting the data you’ve already presented, exploring its significance and how it contributes to your research question.
  • Don’t overinterpret, keep your claims grounded: While it’s tempting to draw bold conclusions from your data, restraint is key. Overinterpretation and speculative claims that extend beyond the scope of your data can undermine the integrity of your research. Ensure every claim you make is firmly rooted in your findings and backed by evidence from your study or existing literature. This approach maintains the scientific rigour of your work and preserves the trust of your readers.
  • Frame Limitations Constructively: Discussing the limitations of your study is a critical aspect of the discussion section, offering transparency and demonstrating your critical thinking skills. However, this should not deteriorate into a focus on weaknesses or perceived failures that could lead your reader to question the validity of your entire research. Instead, frame limitations in a way that underscores the reliability of your findings and opens avenues for future research. Discussing limitations constructively can enhance your credibility, showing that you have a comprehensive understanding of your study’s context and potential impact.
  • Refrain from Repetitive Content: While it’s important to refer back to your results, avoid the temptation to simply restate them in the discussion section. Focus on synthesis and interpretation, adding value and insight beyond what was already reported.
  • Beware of Biased Interpretations: Approach your data with an objective lens. Avoid letting personal biases or desired outcomes influence the interpretation of your results. The discussion should reflect a balanced and fair assessment of the findings in light of the research question.
  • Don’t Overlook Contradictory Evidence: If your findings diverge from previous studies, don’t ignore these discrepancies. Instead, explore and discuss potential reasons for these differences, contributing to a broader understanding of the issue at hand.

By avoiding these common mistakes and adhering to these guidelines, you can craft a discussion section that not only strengthens your paper but also advances the scholarly conversation in your field.

27

Leaving a Mark: Tips for a Compelling Thesis Conclusion

Following your detailed discussion, the conclusion section wraps up your thesis. It summarizes the main findings and presents your final conclusions and suggestions. The goal here is to give a clear and concise overview of your research, highlighting its main contributions and importance. When writing your conclusion, think about the key points you want the reader to remember. This section should be able to stand on its own, providing a snapshot of your thesis. Examiners often read the abstract, introduction, and conclusion first to get an overall sense of your work. Essentially, your conclusion is a summary of your thesis, but it’s usually shorter than the general discussion.

The discussion and conclusion sections are often separate chapters, but sometimes they can be combined, depending on the norms of your field. If you’re not sure which format to use, it’s a good idea to ask your supervisor and check your institution’s guidelines.

A strong conclusion leaves the reader with a clear understanding of the main point or discovery of your thesis. It reminds them why you chose your research approach, what you hoped to find, and if your results met those expectations.

It’s important to highlight the value of your research in the conclusion so that readers are engaged and might consider following up on one of your suggestions or collaborating with you in the future.

In terms of content, the conclusion usually includes:

  • A review of how your findings solve a problem and add to the knowledge in your field, referring back to your research question.
  • An explanation of how your research fills a gap in the existing literature.
  • A discussion of how your findings fit with current theories or challenge them.
  • A brief mention of the limitations of your study, focusing on the most important ones if they have already been discussed.
  • Suggestions for how your research could be used in practical ways or for future studies, emphasizing the most important recommendations if they have been mentioned before.

Finish your conclusion with something that sticks in the reader’s mind, like a thought-provoking question, a warning, or a call to action.

28

Week 8 Exercises

An interactive H5P element has been excluded from this version of the text. You can view it online here:
https://ecampusontario.pressbooks.pub/craftingresearchnarratives/?p=463#h5p-20


An interactive H5P element has been excluded from this version of the text. You can view it online here:
https://ecampusontario.pressbooks.pub/craftingresearchnarratives/?p=463#h5p-19

IX

Week 9: Finishing Touches

Fantastic work! You’ve made remarkable progress, and it’s clearly paying off. You’re on the final stretch now! The major parts of your thesis have been drafted, and by now, you should have received at least one round of feedback from your supervisor on all sections you’ve drafted so far. This week is all about those final adjustments. If you’ve received feedback and haven’t yet incorporated it, now is the perfect time to do so. If you haven’t received any feedback, make sure to reach out to your supervisor to request it.

After spending some time away from your paper, you’re in a prime position to review these sections with fresh eyes. Taking a break allows you to return to your work with a new perspective, making it easier to spot areas that need revision.

It’s also beneficial to engage in peer feedback. By exchanging drafts with your peers and offering each other constructive criticism, you can uncover gaps in your work that you might not have noticed. Remember, being deeply involved in your project can sometimes make you overlook certain details, a challenge your supervisor might also face due to their familiarity with the topic. Fresh perspectives from your peers can be incredibly valuable. Moreover, reviewing the work of others can sharpen your analytical skills and might even introduce you to new strategies or insights on structuring your thesis. In my opinion, the peer review process is a win-win with no downsides, only advantages.

Additionally, ensure that all your sources are accurately cited. Please spend some time refining your references page to ensure it adheres to the formatting standards required by your institution or supervisor. Now is also the time to organize your thesis document for submission, including creating a cover page and finalizing your thesis title. Having a comprehensive view of your project can inspire a fitting title, and your supervisor might offer useful suggestions.

Below, we’ve included a brief guide to help you brainstorm a title for your thesis project, which you might find useful.


An interactive H5P element has been excluded from this version of the text. You can view it online here:
https://ecampusontario.pressbooks.pub/craftingresearchnarratives/?p=294#h5p-21


Finally, the last piece to tackle is the abstract. In the next section, we’ll explore what the abstract entails and guide you through the process of crafting an effective one, ensuring your thesis is presented clearly and compellingly from the start.

29

Tips for Writing Your Abstract

The abstract’s purpose is to give readers a quick, clear understanding of your research’s aims, methods, results, and significance without delving into the details. They typically range from 100 to 300 words, but make sure to check the formatting requirements set by your supervisor or institution. In dissertations or theses, the abstract appears after the title page and acknowledgements but before the table of contents. Writing the abstract last ensures it accurately reflects the content of your work. Some key characteristics of an abstract include:

  • Self-contained: The abstract should stand alone, offering a complete overview without needing to refer to the paper.
  • Clear and Understandable: It should be comprehensible on its own, without any excerpts from the paper.
  • Reflective of the Work: The abstract mirrors the structure of the larger document.

Tips for Writing an Effective Abstract:

  • Read Other Abstracts: To improve your abstract writing, start by immersing yourself in a variety of abstracts from your research field. This exercise will help you grasp the prevalent style and structural norms specific to your discipline. Pay attention to how successful abstracts are organized, the type of language used, and how they manage to convey key information concisely. Analyzing abstracts from top journals or highly cited papers can offer insights into what makes an abstract effective and engaging. This practice not only familiarizes you with the style and structure of an abstract but also inspires ideas on how to articulate the essence of your own research compellingly.
  • Reverse Outline: The reverse outlining process is a strategic approach to structuring your abstract. Break down your completed work into its constituent parts, and summarize each section in a sentence or two, ensuring that all critical aspects of your research are highlighted. This method involves listing the main points or findings from each section of your paper and then using these points to draft concise sentences for your abstract.
    • An exercise has been created here for you to help structure your writing process.
  • Write Clearly and Concisely: Make every word count. Use an active voice and concise expressions. Avoid using jargon or overly complex terminology that might alienate readers unfamiliar with the specific nuances of your field. If technical terms are necessary, ensure they are either widely understood within your discipline or briefly defined in a way that doesn’t detract from the abstract’s brevity.
  • Avoid Detailed Descriptions: Detailed descriptions, extensive definitions, and in-depth background information should be avoided. Focus on what’s essential for someone to know about your research, its outcomes, and its implications, keeping the content streamlined and to the point.

An interactive H5P element has been excluded from this version of the text. You can view it online here:
https://ecampusontario.pressbooks.pub/craftingresearchnarratives/?p=468#h5p-22

Crafting a compelling abstract is about balancing brevity with comprehensiveness. By following these guidelines, you’ll be able to create an abstract that effectively communicates the essence of your research to both experts and broader audiences.

30

Appendices

The appendices section serves as a repository for supplementary information that, while not crucial to the core argument of your paper, could be beneficial for the reader. If you deem an appendix essential to your thesis, or if you’re contemplating incorporating one, the insights offered in this chapter will prove invaluable. Aimed at clarifying the role and significance of the appendices section, this guide is designed to assist you in understanding its functions and in compiling an effective appendix. Through detailed explanations and strategic advice, we strive to illuminate the process, ensuring you can enhance your thesis with well-organized and impactful supplementary material.


The Essence of Appendices

Appendices are located at the end of your academic work, designed to house information that is related to but not essential for understanding the main text. The fundamental principle here is that your paper should be coherent and complete without the need for readers to consult the appendices. This doesn’t undermine the appendices’ value; rather, it underscores their role in enriching the reader’s comprehension of your research without cluttering the main narrative.

What to Include

The appendices can encompass a wide range of content types, from tables, charts, and figures to interview transcripts and raw data. Essentially, if a piece of information is useful but not strictly necessary to the main body of your paper, it can find a home in the appendices. This includes:

  • Tables and charts that provide additional data points or analysis.
  • Extended descriptions and technical specifications that would otherwise disrupt the flow of your paper.
  • Original documentation, such as scanned letters of approval or research instruments like surveys and interview questions.

Structuring

The organization of appendices is flexible, allowing you to include as many as your research warrants. Appendices can be incorporated into academic papers formatted in APA, MLA, or Chicago style, each with its guidelines for structuring appendices. However, each appendix should be clearly labelled and titled to facilitate easy navigation for the reader. Here’s how to do it:

  • Single Appendix: Simply title it “Appendix.” Reference it in your text as needed.
  • Multiple Appendices: Label them alphabetically (Appendix A, Appendix B, etc.). Each should have a specific title describing its content.
    • Formatting: Begin each appendix on a new page, with the label and title centred and bolded. Follow the formatting style of your main text for any written content within the appendices.
  • Placement: Typically, appendices are placed after the reference list or bibliography. However, consult with your instructor or guidelines as practices may vary.

Tips for Effective Appendices

  • Relevance: Ensure all included materials in the appendices are pertinent to your research and provide added value to the reader.
  • Clarity: Label and title each appendix clearly, making it easy for readers to find the supplementary information they might be interested in.
  • Reference in Text: Mention each appendix in the main body of your paper at the relevant point to guide readers towards additional data or material. Here’s how you can seamlessly integrate such references:
    • Direct Reference: Explicitly point your readers to the appendix for more information. For instance, you might write, “For a comprehensive breakdown of the statistical analysis methods employed, refer to Appendix B.”
    • Contextual Mention: Embed appendix references naturally within the discussion. For example, “The extended list of interview questions (see Appendix C) highlights the diverse range of topics covered.”
    • Supporting Evidence: When presenting findings or conclusions that rely on additional data or resources housed in your appendices, mention this. For instance, “The raw data supporting these conclusions are fully detailed in Appendix D.”

A Note on the Appendices

It’s crucial to remember that the appendices, while often overlooked during the proofreading process, play a significant role in the overall impact of your thesis. This oversight can be a critical mistake, as the appendices are not just ancillary material; they are an integral part of your academic presentation. The most engaged and diligent readers, those with a deep interest in the nuances of your research, are likely to consult your appendices for further information. Therefore, it is essential to approach the preparation and review of these sections with the same level of care and attention to detail as the rest of your thesis.

The appendices offer a unique opportunity to substantiate your findings, present detailed data, and showcase the breadth of your research in a structured way. They reinforce the rigour and credibility of your work, providing a comprehensive perspective to readers who seek to understand your methodology, data analysis, and the foundational elements of your research more deeply. By dedicating the necessary time and attention to your appendices, you ensure they serve as a valuable asset to your thesis, reflecting the thoroughness of your research and leaving a lasting, positive impression on those most interested in your work. To ensure your appendices enhance rather than detract from your thesis, consider the following strategies:

  • Thorough Proofreading: Just as with the main body of your thesis, meticulously proofread your appendices to eliminate errors and ensure clarity. This includes checking for typographical mistakes, consistency in formatting, and the accuracy of data presented.
  • Consistent Formatting: Apply the same formatting rules to your appendices as to the rest of your document. Consistency in font size, style, and heading levels contributes to a professional and polished presentation.
  • Clear Labeling and Referencing: Make sure each appendix is clearly labelled and referred to at the relevant points in your thesis. This not only aids navigation but also underscores the interconnectedness of your appendices with the overarching narrative of your research.
  • Engagement and Accessibility: Consider the layout and presentation of your appendices to ensure they are accessible and engaging for your readers. Well-organized tables, clearly labelled figures, and succinct descriptions can make complex information more digestible.


To conclude, the appendices section is a powerful tool in academic writing, offering a space to share comprehensive datasets, detailed methodologies, and ancillary information without disrupting the narrative flow of your paper. By understanding how to curate and structure your appendices effectively, you can enhance the accessibility and depth of your research, providing readers with all the tools they need to fully appreciate the scope and significance of your work.

31

Week 9 Exercises

An interactive H5P element has been excluded from this version of the text. You can view it online here:
https://ecampusontario.pressbooks.pub/craftingresearchnarratives/?p=491#h5p-23

X

Week 10: Communicating Your Research

You’ve reached the culmination of your academic endeavour! I am immensely proud of each one of you for the steadfast dedication and resilience you’ve shown throughout this Thesis Bootcamp. It’s my sincere hope that this program has provided you with a solid framework, making the journey through your thesis a bit more manageable and less daunting. The diligence and commitment you’ve displayed are truly commendable, and your achievements reflect the tremendous effort you’ve invested.

Now, as we near the end of this journey, I’m reminded of the poignant Latin phrase “Dulcius ex asperis,” or “sweeter after difficulty.” One final effort stands between you and the sweet relief of summer, the contentment of completion, and the celebration of your impending graduation. Your exceptional work deserves recognition, and I assure you, it has been noted.

In the coming week, take the time for any additional refinements your thesis may require. Equally crucial is familiarizing yourself with the submission protocols specific to your department. Be sure to consult your department’s guidelines to ensure your thesis meets the necessary standards, particularly in formatting. This attention to detail is the final step in polishing your work and presenting a thesis that not only meets but exceeds expectations. Keep going strong—you’re almost there!

This week, our focus shifts towards the pivotal aspect of disseminating your research. For undergraduate thesis students, this often translates into the creation of a research poster and presenting your project at an undergraduate research fair. This poster presentation might not only be a requirement but could also influence a portion of your thesis grade.

Even if presenting a poster isn’t compulsory for your degree, I strongly recommend engaging with this week’s material. Understanding the value of a research poster extends beyond immediate academic requirements. It opens up avenues for broader academic communication, offering a platform to share your research insights with a wider audience. Consider the possibility of discussing with your supervisor the opportunity to showcase your findings at a conference. Participating in such academic forums can significantly enhance your professional and academic profile.

Here’s why diving into the process of creating and presenting a research poster is worthwhile:


Concise Communication

A research poster challenges you to distill complex research findings into a clear, concise, and visually appealing format. This exercise improves your ability to communicate complex ideas simply and effectively, a skill that’s invaluable in both academic and professional settings. It also helps sharpen your design skills.

Engagement and Networking

Poster sessions at fairs and conferences are networking goldmines, allowing you to connect with peers, faculty, and industry professionals who share your research interests. It fosters networking, offers the chance to receive feedback, and can lead to collaborations, future research opportunities,  postgraduate studies, or career opportunities in your field.

Confidence Building

The experience of presenting and discussing your research with others builds confidence in your knowledge and abilities, preparing you for future academic or professional presentations.

Visual Learning and Presentation Skills

Designing a poster enhances your visual communication skills, teaching you how to use visual elements to complement textual information. Additionally, presenting your poster hones your public speaking and presentation skills, as you learn to discuss your research confidently and respond to questions on the spot.

Increased Visibility

Research posters can increase the visibility of your work within the academic community. By summarizing your research in an accessible format, you reach a wider audience than might be achieved through published papers alone, especially at interdisciplinary conferences where attendees have varied backgrounds. A well-crafted poster can significantly increase the visibility of your research, drawing attention to your hard work and potentially sparking interest for future collaboration or study.

Feedback and Improvement

The interactive nature of poster sessions allows for immediate feedback from viewers. This feedback can be invaluable for identifying areas of improvement, refining your research questions, or even generating new ideas. It’s also a gentle way to introduce less experienced researchers to the peer review process. It opens the door to constructive feedback, providing fresh perspectives that can refine your understanding and approach to your topic.

Educational Value

For students, creating a research poster can be an excellent educational experience. It allows students to apply what they have learned in a practical format, deepening their understanding of their subject matter and the research process itself.

Professional Development

Participating in poster sessions at conferences and seminars can be a significant addition to your professional portfolio. It demonstrates your active participation in the research community and your commitment to disseminating knowledge, which can be beneficial for academic advancement, scholarship applications, and job searches.

Motivation for Ongoing Research

The process of preparing for a poster presentation can serve as a motivational boost. It encourages you to push forward with your research, refine your analysis, and consider your work’s implications more deeply in preparation for presenting it to others.

Accessibility

Posters make your research more accessible not only to experts in your field but also to a broader audience, including students and non-specialists. This wider accessibility can lead to increased interest in your work and opportunities for interdisciplinary collaboration.

In summary, creating and presenting a research poster is a multifaceted opportunity for professional growth, enhanced communication, and academic engagement. It’s a valuable component of the research dissemination process, offering benefits that extend well beyond the conference hall or seminar room.

32

A Semi-Brief Guide on Crafting a Research Poster

Creating a compelling research poster for your thesis project is an art that combines clear communication with visual appeal. Here’s a brief guide to crafting a poster that effectively conveys your research and captivates your audience:

Select your design tool

The process of creating a research poster begins with choosing a design tool that suits your comfort level and design needs. There are several popular options available, each offering unique features and templates to assist in crafting an effective and visually appealing poster. I have a personal preference for Canva due to its user-friendly interface, versatility, and comprehensive library of design elements. Here’s a brief overview of some commonly used design tools for creating research posters:

Pros Cons
Canva An intuitive drag-and-drop interface, a wide range of templates, an extensive library of images and icons, and easy collaboration features. Limited customization in the free version compared to the pro version. But it does offer a free trial period that you can take advantage of.
Adobe Illustrator Professional-grade software with extensive customization options, precise control over design elements, and high-quality output. Steeper learning curve and higher cost.
Microsoft PowerPoint Widely accessible and familiar to most users, straightforward design process, and suitable for basic poster designs. Limited design flexibility compared to specialized design software.
Inkscape Free and open-source vector graphics editor, offering sophisticated design capabilities similar to Illustrator. May have a learning curve for those new to vector graphics.

Formatting Requirements and Sizing

Once you’ve selected your design tool, the next critical step in creating your research poster is to determine the maximum size to which it can be printed. This dimension is typically dictated by the specifications of the poster display area at the conference or event where you’ll be presenting. It’s essential to consult the official website or guidelines provided by the organizers to ascertain the maximum allowable dimensions for posters.

Once you have identified the maximum size, you should then proceed to design your poster within these parameters. Begin by setting up your design tool to use a background that matches these dimensions. This foresight ensures that during the printing process, your poster will not only fit perfectly within the allocated display space but also maintain the highest possible quality, without the need for resizing or compromising on the design elements.

By designing at full scale, you can accurately assess how readable your text will be from a distance, allowing adjustments as necessary. You will also have a clear understanding of how graphics and images will appear in terms of size and resolution, enabling you to make more informed design choices. It will also prevent the potential loss of quality that can occur when resizing elements, ensuring crisp visuals and text. Importantly, providing the printer with a file that is already sized correctly simplifies the printing process, potentially reducing costs and preventing delays.

Remember, the clarity and impact of your poster are paramount; working within the maximum size from the outset is key to achieving a professional and effective presentation of your research. Always double-check the requirements before starting your design to ensure compliance with event guidelines, and consider reaching out to the event organizers if you have any questions regarding the poster specifications.

Tip: Based on personal experience, I’ve noticed that when conference websites list the dimensions for poster sizes, they often present them as simple numeric pairs, such as 3×4, typically specifying these measurements in feet or inches. However, what they frequently fail to clarify is which of these dimensions corresponds to the height and which to the length. A useful tip, borne out of my own encounters, is that research posters are commonly designed in a rectangular format. In the majority of instances, the bigger number represents the width (length), while the smaller number denotes the height. This understanding can be invaluable as you design your poster, ensuring you align its orientation correctly from the outset.


Poster Content

Next, let’s delve into the components that should be featured on your poster. Before doing so, it’s important not to get ahead of yourself by finalizing your presentation script just yet. My advice is to prioritize the visual and content layout of your poster first. The creation of your poster isn’t just about assembling information; it’s about setting the stage for how you’ll engage with your audience. Once the visuals are in place, they will serve as a roadmap, guiding the development of your presentation narrative.

During the design phase, you’ll find that the process of organizing your poster’s content—deciding what goes where, how data is presented, and which highlights to emphasize—will naturally influence the flow of your spoken presentation. This is because the visual elements of your poster are not merely decorative; they are integral to how you communicate your research story. As you arrange and refine these elements, you’ll start to envision the most effective ways to guide your audience through your findings, sparking ideas for your verbal presentation.

Here are key elements to consider including on your poster, which will later inform your dialogue:

Title and Authors

While it’s perfectly acceptable to use the same title for your poster as you did for your thesis paper, you also have the option to craft a revised title specifically for your poster presentation. Often, thesis titles tend to be longer and more detailed, whereas poster titles benefit from being more succinct and direct. Additionally, when devising a title for your poster, you’re afforded greater creative latitude. This allows you to not only ensure the title’s clarity and significance but also to infuse it with an element of intrigue to capture the audience’s attention more effectively. If you’re contemplating a fresh, revised title for your poster, I recommend revisiting our guide on creating a thesis title from last week’s content. This resource can provide valuable insights and strategies for developing a title that is both informative and engaging, making your poster stand out.

Introduction

Provide a brief overview of your research question and its significance. This segment should offer just enough background to enlighten your audience about the context and significance of your study. Think about what information your audience needs to know to understand the background and context of your research.

  • Begin with a clear and direct statement of your primary research question. This should immediately inform viewers of the focus of your study.
  • Briefly explain why this research question matters. Touch on the potential impact of your findings on the field, industry, societal issues, or theoretical frameworks.
  • Your introduction should smoothly transition into the subsequent sections (typically the methods section) of your poster. It should create a narrative flow that guides the viewer from understanding the ‘why’ behind your study to the ‘how’ and ‘what’ that follow in the Methods and Results sections.

Methods

Your objective for this section should be to elucidate the experimental setup and protocol in a manner that is both accessible and informative. This clarity enables viewers to comprehend the approach you employed to tackle your research question, providing them with a clear pathway to the origin of your main results.

  • Begin with a concise description of your experimental setup, highlighting the design choices you made and why they were essential for your study. This could include the type of study, control groups, and the overall framework of your experiment.
  • Briefly describe the procedures and methodologies you utilized, ensuring to include any specific techniques, tools, or software that were pivotal to your research. Aim to balance the need for detail with the necessity of brevity, providing a clear but concise overview.
  • Visual Aids: Where possible, incorporate diagrams, flowcharts, or images that can help visualize the experimental setup and methodology. Visual aids can make complex processes more understandable and engaging. Include any specific details that your audience may wonder about, such as your sample size, equipment, etc as a part of these visual aids. You do not need to go over these details in your verbal presentation unless it is a very key aspect of your design and research question. But its good to be prepared so should your audience ask, you can point them to the area on your poster where you thoughtfully included such details.
  • Your objective should be to furnish sufficient details so that you can guide your audience toward specific conditions or manipulations within your study, and articulate what outcomes you anticipated from these manipulations. By clearly conveying your predictions and intuitions, you effectively set the stage for unveiling the primary results of your research. This approach not only clarifies the rationale behind your experimental design but also primes your audience for a deeper understanding of the significance of your findings.

Results

In the Results section, you spotlight the core of your research poster. This segment is dedicated to describing your findings and the analysis thereof, making it the focal point where your research outcomes are visually and textually communicated. Here’s how to effectively showcase this crucial part of your poster:

  • Start by summarizing the most significant results of your study. Use clear, concise language to convey the outcomes of your research, emphasizing the findings that directly address your research question or hypotheses.
  • Visual Aids: Employ graphs, charts, and other visual representations to illustrate your results compellingly. Visual aids should be chosen and designed to clarify complex data, highlight trends, and demonstrate relationships within your findings.
  • Provide Clear Captions: Every figure or chart should be accompanied by a caption that succinctly explains what the viewer is seeing. Captions should facilitate understanding by briefly describing the visual content and pointing out the relevance of the data presented.
  • Organize for Clarity: Arrange your visuals and text in a logical order that guides the viewer through your results systematically. Group related data together and sequence the information in a way that builds upon each previous point, leading to a coherent narrative of your findings.
  • Where appropriate, include brief interpretations of the data next to the corresponding visuals. This can help viewers grasp the implications of your results without waiting for the full discussion section.
  • Emphasize Significant Results: Use design elements like color, font size, or placement to draw attention to the most critical results. Highlighting these findings ensures they catch the viewer’s eye and are remembered.
  • Be Mindful of Overload: While it’s tempting to include all your data, focus on the results that are most relevant and impactful. Overloading your poster with too much information can overwhelm viewers and dilute the impact of your key findings.

Discussion/Conclusions

While the Results section was dedicated to the explicit presentation of your study’s findings, the Discussion and Conclusions should zoom out to examine the larger picture. This entails delving into the broader significance of your results, interpreting what these findings mean beyond the immediate context of your study, and identifying the core message or key takeaway for your audience. Here’s how to approach this:

  • Begin by summarizing the most important results of your research. What stands out as the fundamental contribution of your study to the field?
  • Broader Implications: Expand on the significance of these findings within a wider context. How do they enhance, challenge, or refine existing knowledge? Discuss the implications for future research, policy, practice, or theoretical frameworks within your discipline.
  • Clearly articulate the key takeaway from your research. What should your audience remember or consider as the most critical insight your study provides? This message should resonate with the broader themes and challenges in your field.
  • Full Circle Moment: Reflect back on your initial hypothesis or research question. How do your findings align with your expectations, and what does this alignment—or lack thereof—suggest about the area of study?
  • Future Directions: While the Results section is about what was found, the Discussion and Conclusions should also hint at what comes next. What questions remain unanswered? What new inquiries have emerged from your research? Suggest pathways for future studies that could build on your work.
  • Conclude with Impact: End your discussion with a strong, impactful statement that emphasizes the significance of your work. Leave your audience with a clear understanding of the value and relevance of your findings.

References

It’s essential to acknowledge the scholarly work that has underpinned and informed your research. Crediting references is not only a practice of academic integrity but also provides your audience with the context and foundation of your study. If your research poster includes numerous references, managing how you present these citations can be challenging without overcrowding the space with text. To efficiently manage and credit your references without cluttering your research poster, consider using a QR code. This approach minimizes text by providing a direct link to a digital document containing your full list of citations. Simply generate a QR code linked to your references online, then include it on your poster with a brief instruction (something as short and simple as “Scan Me”) for viewers to scan for detailed reference information. This method saves space, enhances accessibility, and leverages technology for a streamlined presentation.

Acknowledgments

Acknowledge the contributions of those who supported your research, including any funding sources, by incorporating their logos on your poster. This acknowledgment not only demonstrates gratitude but also adheres to ethical standards of transparency in research.

Contact Information

Ensure your poster includes your name, affiliation, and contact details, such as your institutional email, to facilitate further engagement from attendees interested in your work. Incorporating a QR code that directs to a digital business card, your LinkedIn profile, or even a draft email page is an innovative way to streamline communication. Consider these options to enhance accessibility and make connecting easier for your audience.


As you piece together these elements on your poster, you’ll naturally start to draft a rough outline of how to verbally navigate through your content during the presentation. Remember, creating your poster and developing your presentation dialogue are interconnected activities that evolve together. By focusing first on crafting a compelling visual narrative, you’ll lay a solid foundation for a persuasive and engaging oral presentation.

Target Audience

Understand who your audience will be. Tailor the complexity of your content and the language you use to suit their level of expertise. Whether your audience consists of experts in your field or a general scholarly crowd, your message should be accessible and engaging to them.


Design for Readability and Impact

Use contrasting colours for text and background to ensure readability. A minimalistic color palette can prevent visual overload.

  • Pro tip: To create a visually compelling and cohesive poster, I strongly recommend utilizing the Google Chrome extension, ColorPick Eyedropper. This tool allows you to explore images online that feature aesthetically pleasing colour combinations and high contrast. With ColorPick Eyedropper, you can easily identify and select these colours to develop your personalized colour palette for your poster. Additionally, consider researching colour palettes commonly associated with your field of study and incorporating them into your design. This approach not only enhances the visual appeal of your poster but also ensures relevance and resonance with your research area.
  • Choose a font that is professional and easy to read. Sans-serif fonts like Arial or Helvetica are often recommended for their clarity, especially for headings and main points.


Effective Use of Visuals

  • When designing your research poster, it’s crucial to prioritize the quality of visuals over their quantity. Ensure that every chart, graph, or image included serves a distinct purpose and effectively supports the key points of your thesis. Refrain from adding any visual elements unless they are directly relevant to your research and you are fully prepared to discuss and answer questions about them. This focused approach ensures that your poster remains clear, impactful, and directly aligned with your research objectives, facilitating a deeper understanding among your audience.
  • I strongly advise against the inclusion of irrelevant visuals, such as generic images from Google, in your research poster. Opt for visuals that are directly related to and enhance the understanding of your research findings. This ensures your poster remains professional, focused, and academically rigorous.
  • Ensure that visuals are self-explanatory to some extent, with concise legends and labels that make them understandable without extensive text.

Dynamic Layout

  • Arrange content blocks in a way that guides the viewer through your poster logically, typically from the top left to the bottom right.
  • Consider using a grid layout to organize information neatly and cohesively, which can help maintain balance and flow.

Engagement and Interaction

  • Engage viewers with questions or thought-provoking statements that invite them to think more deeply about your research.
  • Provide a way for viewers to interact with your poster or research further, whether through QR codes, a website link, or social media handles.

Attention to Detail

  • This should go without saying but proofread your poster meticulously to avoid typographical and grammatical errors. Such mistakes can detract from your credibility and the overall impact of your presentation.
  • Pay attention to alignment and spacing. Consistent margins, aligned text blocks, and evenly spaced elements contribute to a professional and polished appearance.

Relevance and Context

Make sure your poster tells a story. It should not only present data but also explain why your research matters. Contextualize your findings within the broader field or societal implications.

Practical Considerations

When printing, choose a matte finish over glossy to reduce glare, making your poster easier to read under conference lighting. If your poster session is virtual, ensure your poster is optimized for digital viewing. This might mean adjusting the layout or providing an interactive version that allows for zooming on specific sections.

Personal Preparation

Beyond rehearsing your pitch, prepare to answer deeper questions about your research. This could involve thinking about future directions, the limitations of your study, and how your work fits within the current state of the field.
Wear a name tag during your presentation, and if possible, dress in a way that is professional yet approachable. This makes you easily identifiable as the presenter and can make attendees more comfortable engaging with you.

Follow-Up

Be ready to take notes on questions or feedback you receive. This can be invaluable for future research or presentations. Have business cards or a simple handout with your contact information and a brief summary of your research. This allows interested attendees to follow up after the event.


By expanding your approach to include these additional considerations, you can create a research poster that not only presents your thesis work effectively but also makes a lasting impression on your audience.

XI

ConGRADulations!

Heartfelt congratulations on reaching this pivotal milestone in your academic voyage! The completion of your thesis is not just a testament to your scholarly achievements but also a profound reflection of your unwavering commitment, persistent drive, and intellectual evolution. As you stand on the brink of exciting new chapters—be it furthering your education, diving into your career, or embarking on diverse ventures—carry with you the assurance that the hard-earned triumphs of this academic journey will serve as a robust foundation for all your future undertakings.

Whichever path you choose to tread, may it be strewn with triumphs, joy, and the realization of your aspirations. The expertise and acumen you’ve honed will undoubtedly guide your way, and the grit you’ve demonstrated in the accomplishment of your thesis stands as a powerful testament to your capability to surmount obstacles and realize your ambitions.

As you transition from the realm of academia into the broader world, hold fast to the knowledge that your potential is boundless. Approach each new opportunity with the same zeal and ardour that brought you to this moment, and may you continue to embrace the ethos of lifelong learning. Fondly recall the experiences that have shaped you, the bonds you’ve forged, and the wisdom you’ve amassed throughout your undergraduate journey.

I extend to you my most sincere best wishes for your future paths. This is merely the commencement of an extraordinary journey, rich with limitless prospects. May you go forth and continue to flourish, making indelible marks on the world.

With the warmest of congratulations and the best of wishes for your journey ahead!

1

Appendix

This is where you can add appendices or other back matter.