The Table of Contents: Accessing Sections and Chapters
In the top left corner of the screen is a black tab labelled “Contents.” Click this to open the Table of Contents dropdown menu. From there, you can navigate to any of the major sections or individual chapters in the book.
By clicking the plus button (+) to the right of a section, you can expand the contents to show each chapter title. These titles are clickable and will take you directly to the chapter.
“Next” and “Previous” Page Buttons
At the bottom left or right of any Pressbooks page (including this one!) are the “next” and “previous” buttons. They are labelled with the title of the previous or next chapter. You can use these buttons to go directly to the previous or next chapter without navigating back to the Table of Contents.
Glossary
At the end of the book is a glossary of terms for your reference. Where applicable, glossary definitions have also been embedded directly within the chapters and appear as underlined in the text. When clicked, the glossary definition will appear as a tooltip window.
Why an Open Textbook?
With the recent release of the Tri-Agency Research Data Management (RDM) Policy, RDM has become crucially important. All researchers who apply for grants to fund data-related research must now meet requirements including writing Data Management Plans and preparing data for archiving. Given the heightened attention to RDM, the need for greater education and the number of courses related to RDM is likely to increase.
In summer 2021, a number of Canadian academics and librarians, including faculty who teach existing RDM courses, formed a group to discuss creating a bilingual, made-in-Canada textbook. The group recognized that at the time, there were no resources suited to the unique Canadian regulatory context and appropriate for use in classrooms. Together, it was decided that an open educational resource (OER) in the form of a textbook would be of the most value to Canadian practitioners and learners, and would capture the spirit of RDM which is meant to encourage openness.
What is an Open Textbook?
An open textbook is a publicly available online resource that is free-of-charge and has an open license that allows others to reuse, retain, remix, redistribute, and revise it. This book has a Creative Commons Attribution-NonCommercial (CC BY-NC) license, which allows for the adaptation and redistribution of this textbook for non-commercial purposes so long as the original creator is attributed (see “Licensing and Attribution” section). Further to the open license, the authors of this open textbook are committed to making this open textbook available immediately, freely, and permanently to anyone who can access the internet.
Benefits to using open textbooks are many. Besides simply providing freely available quality open scholarship resources to students and instructors as a significant cost savings, open resources also ensures that the intention of education is considered. UNESCO’s SG4 goal to “ensure inclusive and equitable quality education and promote lifelong learning opportunities for all” by 2030 begins with freely accessible open educational resources (OER). The previous view that education is the business of disseminating knowledge has been challenged by OER advocates who are leading the education reform towards the co-creation and sharing of knowledge (Blomgren & Henderson, 2021; Cronin, 2017; Henderson & Ostashewski, 2018). In addition to the free use of an open textbook, open resources used for instruction are directly applicable to curriculum goals and can remain relevant to the field through the adaptation and revision of the resource (Hendricks et al., 2017).
While there are many commercial publishers that offer similar textbook quality, they have limitations that reduce the impact that they could have. Specifically, they are rarely permanent or freely available which limits the accessibility of these resources to many students, educators, and practitioners. This open textbook, Research Data Management in the Canadian Context: A Guide for Practitioners and Learners, responds to this call for education reform by meeting the gold open access standards of an immediate, free, and permanent open education resource that can be revised, redistributed, retained, remixed, and reused for non-commercial purposes under a Creative Commons Attribution-NonCommercial license.
This book is expected to meet the needs of instructors looking for resources to support their teaching in RDM topics as well as supporting the needs of librarians, students, and researchers who are seeking up-to-date materials for guidance on RDM practices. By publishing Research Data Management in the Canadian Context: A Guide for Practitioners and Learners with a CC BY-NC license, it is our intention that this book be adopted in full as required reading in the classroom, adapted in part as supplemental information, or revised with current or compelling information that the resource may lack. We are excited to offer this open educational resource as a starting point to advance the RDM field with, and for, RDM practitioners and hope to shed light on the need for more resources in this field.
Licensing and Attribution
This book is licensed CC BY-NC (Creative Commons Attribution-NonCommercial 4.0). This license allows users to reuse, remix, revise, redistribute and retain the resource for non-commercial purposes so long as you attribute it to the original author(s). Each chapter is written by authors who have agreed to release their original works under CC BY-NC and any use must be attributed to the chapter authors in addition to the editors who have curated this collection. The authors of each chapter also retain the copyright to their work.
Examples of attribution language are as follows:
Redistributing the complete book:
Research Data Management in the Canadian Context: A Guide for Practitioners and Learners created by Kristi Thompson; Elizabeth Hill; Emily Carlisle-Johnston; Danielle Dennie; and Émilie Fortin published with Pressbooks. The original is freely available under the terms of the CC BY-NC 4.0 license at https://ecampusontario.pressbooks.pub/canadardm.
Redistributing chapters:
Chapter title, authors, in Research Data Management in the Canadian Context: A Guide for Practitioners and Learners created by Kristi Thompson; Elizabeth Hill; Emily Carlisle-Johnston; Danielle Dennie; and Émilie Fortin published with Pressbooks. The original is freely available under the terms of the CC BY-NC 4.0 license at https://ecampusontario.pressbooks.pub/canadardm.
Revised or adapted versions:
This material has been adapted/revised from Research Data Management in the Canadian Context: A Guide for Practitioners and Learners created by Kristi Thompson; Elizabeth Hill; Emily Carlisle-Johnston; Danielle Dennie; and Émilie Fortin published with Pressbooks. The original is freely available under the terms of the CC BY-NC 4.0 license at https://ecampusontario.pressbooks.pub/canadardm.
If you like our work and are planning to use it, we would love to know! Please send us a note to let us know how you are using the work by emailing rdmoerteam@gmail.com.
You will find the French edition of the book at this address: https://ecampusontario.pressbooks.pub/gdrcanada/. If you are interested in adapting, translating, or otherwise have suggestions for editing and updating this work, we would also love to hear from you and answer any questions you may have.
Reference List
Blomgren, C., & Henderson, S. (2021). Addressing the K-12 open educational resources awareness niche: A virtual conference response. Alberta Journal of Educational Research, 67(1), 68-82. https://doi.org/10.11575/ajer.v67i1.56965
Cronin, C. (2017). Openness and praxis: Exploring the use of open educational practices in higher education. The International Review of Research in Open and Distributed Learning, 18(5), 1-21. https://doi.org/10.19173/irrodl.v18i5.3096
Henderson, S. & Ostashewski, N. (2018). Barriers, incentives, and benefits of the open educational resources (OER) movement: An exploration into instructor perspectives. First Monday, 23(12). https://doi.org/10.5210/fm.v23i12.9172
Hendricks, C., Reinsberg, S. A., & Rieger, G. W. (2017). The adoption of an open textbook in a large physics course: An analysis of cost, outcomes, use, and perceptions. The International Review of Research in Open and Distributed Learning, 18(4), 78-99. https://doi.org/10.19173/irrodl.v18i4.3006
Henderson, S., McGreal, R., & Vladimirschi, V. (2018). Access copyright and fair dealing guidelines in higher educational institutions in Canada: A survey. Partnership: The Canadian Journal of Library and Information Practice and Research, 13(2), 1-37. https://doi.org/10.21083/partnership.v13i2.4147
Emily Carlisle-Johnston has been Research and Scholarly Communication Librarian at Western University since 2020. She works with faculty looking to incorporate Open Educational Resources (OER) in their teaching, which includes helping faculty find and evaluate OER, assessing licensing options for re-use and adaptation of OER, and supporting the use of Open publishing software such as Pressbooks. Prior to this role she worked at eCampusOntario, where she led the editorial workflows for creation of OER. Emily completed the SPARC Open Education Leadership Fellow program in 2022. ORCID: 0000-0002-5391-723X
Danielle Dennie has been the Head, Vanier Library at Concordia University in Montréal since 2021. She has also been the Research Data Librarian at Concordia since 2018. She has a Masters in Applied Microbiology from INRS-Institut Armand Frappier as well as a Masters in Library and Information Studies from McGill University. She was the lead on Concordia University’s Institutional RDM Strategy. ORCID: 0000-0003-3771-2450
Émilie Fortin has been Research Data Management and Digital Preservation Librarian at Université Laval since 2021. Prior to this, she was the librarian responsible for digital production, preservation and conservation of collections. She completed her Master’s degree in Information Science at Université de Montréal, spending a year at the Haute école de gestion in Geneva. She is involved in the Digital Research Alliance’s Preservation Expert Group as well as the Partenariat des bibliothèques universitaires du Québec (PBUQ) working group on research data management, and is also a regular participant in iPRES conferences on digital preservation. ORCID: 0000-0002-9717-6840
Elizabeth Hill is the Data Librarian at Western University in London Ontario. She provides access and data literacy instruction to data sources at Western. She has an external advisor role with Statistics Canada. Elizabeth is active in various data communities and working groups in participant and leadership roles. Her research interests include supporting researchers, and she has published on topics related to data delivery systems and data librarianship in Canada. ORCID: 0000-0002-9715-238X
Kristi Thompson is the Research Data Management Librarian at Western University, and previously held positions as data librarian at the University of Windsor and data specialist at Princeton University. Kristi supports research projects, administers data archiving software, works with Western’s Research Ethics boards, and is involved at a national level with developing research data infrastructure. She co-edited the book Databrarianship: the Academic Data Librarian in Theory and Practice and has published on topics ranging from data anonymization algorithms to intergenerational psychology. ORCID: 0000-0002-4152-0075
Acknowledgements
3
Research Data Management in the Canadian Context would not have been possible without the collaboration and participation of members of Canada’s academic data community, as well as representatives from agencies supporting Research Data Management.
The initial idea to create a resource of this type came from a Canadian RDM-OER listserv, which brought together RDM supporters across Canada. Lachlan MacLeod was instrumental in getting this group formed and talking about developing an open textbook on RDM. The RDM-OER listserv continued to provide input, feedback and support throughout the life of the project.
We are thankful for the project support we had from Serena Henderson during the initial phases of the project, with financial support from Dalhousie University. Yeliz Baloglu Cengay provided assistance with inputting chapters to Pressbooks.
This project could not have happened without the financial support of a number of different groups. Research Data Management in the Canadian Context is supported in part by funding from the Social Sciences and Humanities Research Council. We additionally gratefully acknowledge financial support from Compute Ontario; a Western University Research Mobilization, Creation & Innovation Grant; the Western Libraries, Western University Academic Activity Support Fund; a Concordia Library Research Grant; and a University of British Columbia OER Rapid Innovation grant. Dalhousie University provided support for hiring a Project Coordinator in the early days of the project. The Digital Research Alliance of Canada provided graphics support.
The cover design is by Amy McConchie, CCGoodwin Consulting.
Copyediting services for the original English chapters were provided by Paula Chiarcos and Amanda Feeney from Colborne Communications. Copyediting services for the original French chapters were provided by Suzanne Aubin from Colborne Communications and Jonathan Dorey. Translation from French to English was done by Jonathan Dorey and Amanda Feeney. Translation from English to French was done by Manon St-Jules and Suzanne Aubin. An additional review of the French version of chapter 3 “Indigenous Data Sovereignty” was carried out by Wintranslation.
We would especially like to acknowledge the efforts of our peer reviewers, who helped ensure the academic integrity and quality of this manuscript. The following individuals provided assistance:
Jennifer Abel
Fatoumata Bah
Lacey Cain
Alicia Cappello
Erin Clary
Mathieu Clouthier
Alexandra Cooper
Lyne Da Sylva
Sarah Forbes
Jane Fry
Meghan Goodchild
Monique Grenier
Alex Guindon
Melissa Helwig
Laurence Horton
Jasmine Hoover
Fiona Inglis
Erin Johnson
Sandra Keys
Marjorie Mitchell
Nora Mulvaney
Kaitlin Newson
Paul R. Pival
Isaac Pratt
Kharah Ross
Kimberly Silk
Tara Stieglitz
Robyn Stobbs
Carolyn Sullivan
Felicity Tayler
Arielle Vanderschans
Minglu Wang
Susie Wilson
Shiloh Williams
Nadia Zurek
Foreword: Reflections on a Career in Data Librarianship
4
Recognition of Research Data Management (RDM) as a key pillar in the research enterprise has increased dramatically in recent years, driven by the efforts of data librarians and specialists, research facilitators, policy makers, funders, journal publishers, administrators in higher education, and a growing number of frontline researchers. But how did we get here? Reflecting on my 36 years working in this space, the answer is clear: community. It is the collegial and collaborative nature of the Canadian data community, working over decades, that has brought us to where we are today through the shared belief that together we can do better. Tracing the history of this progress will help frame the origins and purpose of this new Open Educational Resource (OER) RDM textbook. My recounting of our shared history will be personal and necessarily selective; far more thorough and thoughtful coverage can be found in the excellent works of Gray and Hill (2016) and Humphrey (2020).
I arrived at Queen’s University in 1987, armed with a background in biology, a library degree, and a basic knowledge of statistics and mainframe computers — with the latter ultimately getting me hired as Queen’s first data librarian. I believe Queen’s University was one of only six Canadian institutions with data librarians at that time. Early on, I learned that data librarianship was an aerobic activity: run 9-track data tapes to the computing centre, run back to the library, execute your batch job on the mainframe, run back to the computing centre to collect printed results, run back to the library, find and fix errors, repeat. I was in the best shape of my life.
At around this time, the Federal government of the day imposed cost recovery measures that effectively raised the price tag for Statistics Canada data tenfold, from $25 to $2500 per file, putting these data well out of reach for most researchers and universities. Laine Ruus, a veteran Data Librarian at the University of Toronto, thought together we can do better. Collaborating with the Canadian Association of Research Libraries (CARL), Laine spearheaded negotiations to purchase a single set of all Census data files from Statistics Canada, to be copied and shared under license with participating institutions. The gargantuan, and wholly altruistic task of copying and shipping hundreds of magnetic tapes across the country ensured these data remained affordable and accessible for the 25 institutions who joined in.
With this success, however, came challenges — what were academic libraries supposed to do with these tapes? Librarians, more often than not those responsible for government documents, were assigned ‘data librarian’ roles but in most cases had no background or training in this field. As part of the response to this, the Canadian Association of Public Data Users (CAPDU) was established in 1988, with training as one of its primary mandates. Early drivers of this training included Wendy Watkins (Carleton University) and Laine Ruus. Training was first offered informally, often one-on-one, and later more formally in conjunction with various conferences.
Wendy later partnered with Ernie Boyko from Statistics Canada to undertake a watershed project — developing and resourcing what became known as the Data Liberation Initiative (DLI), a national data service model designed to provide access to Statistics Canada data and, importantly, targeted training, for a fixed and affordable annual subscription fee. But this success took much buy-in, time, and effort. In a 1995 regional report to ICPSR, Wendy wrote: “To date, all parties are enthusiastic. What remains to be found are firm commitments to funding.” By its launch in 1996, over 50 institutions had joined with each designating a ‘DLI representative’ and taking advantage of the dual benefits of cost savings and much-needed training. Another less tangible benefit to emerge from DLI was a nascent hub-and-spoke community of practice, with more-experienced data librarians and specialists offering support, guidance, direction, and encouragement to a growing number of new data professionals across Canada. This de facto network of expertise and mentorship helped build relationships, trust, and credibility — and is a community-building model that we are benefiting from to this day.
Fast-forwarding through time, I see the blur of progress from magnetic tapes to tape cartridges to CD-ROMs — standalone and networked in ‘towers’ — to the emergence of Internet data delivery via FTP and eventually the web. Baked into this latter period were many home-grown, web-based data delivery services whose cryptic names probably still resonate with data librarians of a certain age: IDLS, Equinox, QWIFS, LANDRU, ISLAND, Sherlock, and SDA. Regional training offered by DLI was often framed around one or more of these services. This patchwork of systems served as a proving ground for more ambitious national solutions to come, with several of these platforms providing subscription access to institutions across Canada.
Importantly during this period, the concept of data management arose and grew, albeit slowly. Many data librarians became involved in what was coined ‘data rescue,’ reflecting the reality that many government-produced data files were at risk of being lost due to ignorance, lack of funding, or neglect. More than once, Laine Ruus, a data packrat in the very best sense of the word, was asked by Statistics Canada if she had kept (managed) a copy of a data file they needed but could not find. In another example, the ICPSR regional report cited above mentions the University of Alberta Data Library rescuing 20 years of Alberta Hail Study data when that provincial government program was shuttered. These data can be found today in Borealis, the Canadian Dataverse repository.
As technology advanced, so did awareness of the importance of doing research digitally. As with the data rescue initiatives already mentioned, there was a growing understanding of how important, yet vulnerable, researcher-generated data were. In the past decade or so, the federal government and its Tri-Agency funders issued a series of foundational policy documents outlining their stance on open science and the importance of transparency, replicability, verification, and reuse of data. Libraries as well, spearheaded by the Canadian Association of Research Libraries (CARL) and astutely led by Executive Director Susan Haigh, took an active interest in RDM. With support from CARL Library Directors, and visionary leadership from Charles (Chuck) Humphrey (University of Alberta), a roadmap for RDM in Canada emerged, culminating in the creation of CARL Portage in 2015. In 2017, I accepted the challenge of filling Chuck’s rather large leadership shoes when he retired, joining Lee Wilson, then Service Manager at Portage, in continuing to develop the Canada-wide Portage Network of Experts, or NoE (a thankful nod here to DLI), which was initiated to grow and coordinate RDM capacity and training from the ground up in Canada. Together, we oversaw the transition of Portage into the Digital Research Alliance of Canada (the Alliance). The RDM team at the Alliance and the NoE, now led by Lee Wilson, continue the work of Portage through close collaboration with others in the Digital Research Infrastructure ecosystem to improve data management practices, platforms, services, and training across Canada.
Shortly after Portage was launched, I was asked to map out a graduate-level RDM syllabus for the Library School at Western University. After much searching, I ended up choosing a textbook written in the United Kingdom as a foundation for the course. While well-written and thorough, this textbook relied entirely on UK- and European-based tools, policy frameworks, and examples. And while many aspects of RDM transcend national boundaries, bringing the topic home for Canadian students would have been of great value. Others have expressed similar frustration in seeking authoritative home-grown RDM support.
Portage, and now the Alliance, have done much to address RDM training needs in Canada, working closely with the RDM NoE, and in particular the National Training Expert Group (NTEG) to create a range of webinars, templates, guides, glossaries, videos, and primers – all freely available on the alliancecan.ca website. At the same time, others in the RDM community recognized more could be done. Of particular note, Lachlan MacLeod from Dalhousie University initiated grassroots discussions about the creation of an open textbook on RDM, convening community calls and establishing a mailing list for interested participants. A core national editorial team was formed, consisting of Elizabeth (Liz) Hill, Kristi Thompson, and Emily Carlisle-Johnston, all from Western University [English] and Danielle Dennie (Concordia University) and Émilie Fortin (Université Laval) [French].
The English editorial team worked on initial concept development for the textbook, fundraising, and editing of English-language submissions. Liz Hill brings a wealth of data and RDM experience, has deep awareness of the history of data services in Canada (see article, cited below, and historical chapter included in this work), and knows/is known by just about everyone in the Canadian data ecosystem. She served as consummate people- and relationship-wrangler for the project. Kristi Thompson brings a background in computer science and quantitative analysis to the project, which along with previous editorial experience, she leveraged to review technical content in this textbook. She is known for her work on data anonymization (see the Sensitive Data chapter in this work) and quantitative literacy, and her involvement in ‘data rescue,’ all grounded in strong RDM expertise. Kristi also led very successful fundraising efforts for the project. Emily Carlisle-Johnston brought essential expertise in OER, copyediting, and textbook development to the editorial team. Her knowledge of the Pressbooks open-publishing platform, her advocacy for openness throughout the project’s workflow, and her previous experience leading the editorial process for OER projects while working at eCampusOntario, made Emily a perfect fit for this project.
The French editorial team was responsible for overseeing translation, reviewing French contributions, and leading the production of a complete French edition of the text. Émilie Fortin has a range of experience and a background in preservation, and in addition to her editorial work she contributed crucial material on metadata and formats to this textbook. She has been working in RDM since 2021. Danielle Dennie has a background in science librarianship as well as RDM and has held several library leadership roles. Danielle was the primary coordinator between the English and French sides of the project, liaising with the English project team and juggling copy editors and translators. Danielle and Émilie co-led outreach with the French data community and translated communications for the project.
This core national editorial team had a diverse range of skills and levels of experience, with each member contributing in distinct but complementary ways. Their collective efforts ultimately attracted over 50 members of the Canadian data community to serve as editors, authors, reviewers, fundraisers, and other contributors to this project. This larger pan-Canadian team had a shared appreciation of the value and importance of framing RDM training and resources in the Canadian context and set out to fill this need, culminating in this all-Canadian bilingual RDM textbook — Research Data Management in the Canadian Context: A Guide for Practitioners and Learners.
It is exciting to think how valuable and appreciated this work promises to be as part of an ever-growing arsenal of Canadian RDM training resources. This textbook is aimed at researchers and practitioners at all levels and from all disciplines. It has strong potential for use:
in teaching (Library School courses, workshops, etc.)
as a reference source (by researchers and RDM specialists, new and established)
by administrators hoping to learn more about policy and regulatory aspects of RDM
as a driver of change, with applications in policy discussions, development, and deployment.
The online and open nature of this work will facilitate access and ongoing improvement. The RDM landscape is constantly changing with advancements being made locally, regionally, nationally, and internationally — all with the potential to inform and augment this textbook over time.
Fundamentally, this textbook is the embodiment of a sea change in the Canadian data ecosystem. We are witnesses to and participants in the broadening of our collective national focus from solely facilitating access to and use of existing data, to proactively expanding available content by promoting and supporting the FAIR-ification of researcher-generated data in the ways described in this work. The best practices, tips, guidance, policy discussions, and examples in this textbook will certainly bolster efforts to normalize the necessary and growing focus on FAIR. I say normalize, because we do need to make the best practices surrounding research data management a normal and expected part of researchers’ mindsets and workflows — not just in response to policy imperatives, but because researchers recognize and value the benefits of data well managed, for their disciplines, for their reputations, for future reuse and verification, and for society at large. This textbook will help us, together, to reach this goal. Never underestimate the power of a dedicated community to get things done.
March 2023
Gray, S. V. & Hill, E. (2016). The Academic Data Librarian Profession in Canada: History and Future Directions. Western Libraries Publications. Paper 49. http://ir.lib.uwo.ca/wlpub/49
Humphrey, C. The CARL Portage Partnership Story. (2020). Partnership: The Canadian Journal of Library and Information Practice and Research, 15(1). https://doi.org/10.21083/partnership.v15i1.5825
About the author
Jeff Moon
Jeff Moon is the Director, Data Strategy and Services at Compute Ontario.
First Principles in Research Data Management
I
The Basics: An Introduction to Research Data Management
1
An Introduction to Research Data Management
Kristi Thompson
Learning Outcomes
By the end of this chapter you should be able to:
Define the terms research data, Research Data Management, and Data Management Plan.
Describe the three elements of the 2021 Tri-Agency Research Data Management Policy.
Understand the link between Research Data Management and research replicability.
List some common elements of a Data Management Plan and explain their importance.
Introduction
In 2021, Canada’s three federal research funding agencies, the Canadian Institutes of Health Research (CIHR), the Natural Sciences and Engineering Research Council (NSERC), and the Social Sciences and Humanities Research Council (SSHRC), released the Tri-Agency Research Data Management Policy. The policy’s stated goal is to ensure that “research data collected through the use of public funds should be responsibly and securely managed and be, where ethical, legal and commercial obligations allow, available for reuse by others” (Government of Canada, 2021). Funding agencies in many other countries have released similar policies.
This chapter will discuss some of the fundamental questions of Research Data Management (RDM) in Canada: Where is the push towards formal RDM coming from? What is research data, in terms of this policy and in general? What are the requirements of good data management?
Canada’s Three Federal Research Funding Agencies
The Natural Sciences and Engineering Research Council of Canada (NSERC), the Social Sciences and Humanities Research Council of Canada (SSHRC), and the Canadian Institutes of Health Research (CIHR), are Canada’s three federal research funding agencies. They are sometimes collectively referred to as the Tri-Council or the Tri-agency; throughout this text they will often be collectively referred to asthe agencies. As the source of a large share of Canada’s research money, they are able to set policies that significantly influence how research is conducted in Canada. In addition to the Tri-Agency Research Data Management Policy, they are responsible for the Policy Statement on Ethical Conduct for Research Involving Humans (TCPS 2), the Open Access Policy on Publications, and others. Their policies are not laws. However, in addition to deciding whether or not to award funding to individual researchers, the agencies can each bar entire institutions from administering research funds, which would make every researcher at that institution ineligible to apply for funds. This gives the agencies a huge amount of power to shape how research is done in Canada.
What Are Research Data?
To understand RDM requirements, you have to understand the definition of research data. The term research data combines two key concepts: research and data. Research might be described as a systematic process of investigation, a way of finding out about things. Research transforms information into knowledge and is a part of how we discover the world. Data can be an important part of that knowledge discovery. Data are one type of information or evidence that serve as input to research. But not all information in a research project is data.
Canada’s Tri-Agency FAQ (2021) states that “What is considered relevant research data is often highly contextual, and determining what counts as such should be guided by disciplinary norms” (Government of Canada, 2021b). In short, context is important; you can’t really define research data without looking at how it’s being generated and used. The FAQ section “How are research materials related to research data?” delves into this: “Research materials serve as the object of an investigation, whether scientific, scholarly, literary or artistic, and are used to create research data. Research materials are transformed into data through method or practice.”
That transformation is a key part of separating general information from research data. Data are the results of taking raw information from any source (e.g., informants/survey respondents, archival or bibliographic data, social media, scientific instruments, document text) and collecting or assembling that information into a structured form to serve as an input for further research. Because of the work that goes into structuring, annotating, and organizing research data, they can also be considered a research output, along with books, articles, and other items created by researchers. Research data are a vital source of information that may not be captured in any other source. If they are published or shared, they can be referred to by other researchers and cited just like any other research output.
For example, a researcher may use a set of research articles as input for their research. If the researcher is simply reading those articles and referring to their contents through citations to support other ideas, the articles are serving as research material, but not research data. However, if the researcher takes the same set of articles, imports them into a piece of software, and reviews and annotates them in a structured way to come to some sort of formal conclusion on the group of articles as a whole, then those articles form a dataset and are considered research data.
Research data can be secondary data, meaning that the researcher did not collect or assemble the material themself. In this case, the structuring or refining to serve as input may have been done by another researcher. Or the data may come pre-structured if it’s administrative data(say, extracted from an admissions database). But something that is a structured collection of information that is being refined into research through analysis is still considered research data.
Data Structure
A common structural format for data, used in spreadsheets and statistical files, is the rectangle, in which data are organized into rows and columns. Each row will contain one case, which is a single unit of the thing being studied (e.g., one person in a survey, or a fruit fly in an experiment). Each column will be used to store one variable or characteristic of each case, such as the age of each person (or fruit fly!) in the study.
Figure 1.An image showing a rectangular data file. It’s a spreadsheet with one row for each person in the dataset and a column for each characteristic.
While we’re talking about data structure, here are some simple rules for organizing rectangular, spreadsheet-style data to make it easier to manage:
Organize the data as a single rectangle, with subjects/cases as rows and variables/features as columns; add a single row as a header at the top, with brief, descriptive names for what is in each column.
Put just one thing in a cell and do not merge cells. Every cell should have one piece of information that corresponds to one row and one column (one case and one variable).
Create a data dictionary — a separate document explaining what is in your rows and columns.
Do not include calculations or functions in the original data files.
Do not use font colour or highlighting as data.
The figure above shows what data structured this way will look like. Data in this simple format can be read by and used in any spreadsheet program or statistical package.
What Is Research Data Management?
Research data management is a general term that describes what researchers do to structure, organize, and maintain data before, during, and after doing research. In this sense, anyone who collects or uses data for the purpose of doing research is doing research data management. Creating a data file and deciding where to save it, renaming a data file, or moving it are all research data management activities. Research Data Management (RDM), spelled with capitals, is an emerging discipline that is concerned with researching and developing ways to manage research data more effectively. The idea behind data management is to use a set of techniques to structure, organize, and document the information that is serving as input to research and to do so in a way that will allow others to understand and reproduce your research and make use of the data that went into your research.
The research data lifecycle is often used to illustrate the cyclical nature of research. Researchers start by planning their research. They then collect, process, and clean data to get them into shape for analysis and analyze them to form conclusions about their research. Finally, they take steps to preserve the data for the long term and make them available for others to use and study. In practice, the cycle is more complex, with many steps happening at the same time. For example, preservation of the original data needs to start as soon as the data has been collected to avoid any possibility of loss, and researchers will often process, analyze, and reprocess their data as they work with them. This is a very data-centric view of research, as the research cycle will include many other steps, from applying for funding to writing up and publishing results.
Figure 2.Research data lifecycle.
Reproducibility, Replicability, Traceability
Reproducibility, replicability, and traceability are three related but distinct concepts that are important to understanding the importance of good RDM. For research to be reproducible, it must be possible for researchers who were not part of the original research team to repeat the research using the same data, methods, and code, and to get the same results. In practice this means data, code, and thorough documentation need to be available to external researchers.
For research to be replicable, researchers who were not part of the original research team need to be able to repeat the original research study on newly collected or different data and get the same or similar results. For this to be possible, the original researchers’ methods need to have been documented and published, but the original data do not need to be available.
For research to be traceable, researchers who were not part of the original research need to be able to reproduce the analysis dataset from the original, as collected or acquired datasets. If data are traceable, everyone can be confident that no undocumented changes happened to the dataset. External researchers should also understand why every change made to the data happened, who made it, and what the decision process was. Research data are evidence — if you’ve ever watched CSI, this is like the chain of custody that ensures evidence in a criminal case hasn’t been contaminated.
Remember those data structure tips from earlier in the chapter? Simple, standardized, widely understood formats and structures are good for reproducibility, replicability, and traceability.
Mandating specific standards for how data should be managed isn’t meant to put arbitrary constraints on how people do research. The standards help to preserve research integrity by having researchers handle their data in ways that can be followed and understood and, therefore, reproduced and replicated. Research findings that cannot be repeated or reproduced are not credible. Mandated RDM also includes the goal of increased data sharing, not just so research can be reproduced directly, but so data can be reused for other projects, allowing for the creation of more research at a lower cost. The 2021 Tri-Agency Research Data Management Policy includes three requirements intended to help Canada move towards this goal.
Replicability Crisis
The replicability crisis is an ongoing issue in the physical and social sciences that calls the credibility of these sciences into question. Starting around 2010, psychologists began to repeat earlier studies in an effort to reproduce their findings and found they were unable to consistently do so. In one major effort to replicate 28 studies, close to half could not be replicated, and 32% showed effects opposite to that which had been originally reported (Klein et al., 2018). This means that people who rely on this research have been teaching, carrying out further research, and changing practices based on results that may be incorrect. Similar issues have since been reported in other fields, such as biology, medicine, and economics. The original studies may have included bad data, incorrect analysis methods, or atypical samples, among many possible reasons for the discrepancies. If the original data aren’t available and traceable, it’s hard to tell.
Tri-Agency Policy: The Three Requirements
The three requirements laid out in the Tri-Agency Research Data Management Policy (Government of Canada, 2021) are:
Institutional Strategies. Institutions (generally post-secondary institutions and hospitals) that are eligible to administer Tri-Agency funding are required to develop formal RDM strategies, post them on their websites, and submit them to the agencies by a deadline. These strategies need to explain how the institution intends to support its researchers in doing better RDM and in coping with the next two requirements. Strategies submitted to the agencies are linked on their Institutional Strategies page.
Data Management Plans. The agencies will start requiring that researchers submit plans explaining how they intend to manage their data, at least for some funding opportunities. These plans will be considered when the agencies decide how to award grants.
Deposit. When grant recipients publish any articles or other outputs arising from research supported by the agencies, they will be required to deposit the data and code that support that research output into a digital repository. This is a fairly narrow requirement. A researcher may collect dozens of variables but write a paper that only makes direct use of a small subset of them. This subset is what they need to deposit. Also note that depositing is not the same as sharing. Data that is confidential or otherwise shouldn’t be shared needs to be deposited in a secure private location.
Data Management Plans (DMPs)
A Data Management Plan (DMP) is a formal description of what a researcher plans to do with their data from collection to eventual disposal or deletion. DMPs have existed in some form or other since the 1960s (Smale et al., 2020), but adoption has been slow and, in many disciplines, it is still not widespread. Internationally, DMPs have become a frequent requirement of funding agencies, including in the United Kingdom and in the United States. Tools and templates have been developed to help researchers write plans that meet funding agency requirements. The main tool used in Canada is called DMP Assistant. It is a web-based tool that asks users a series of questions about their data and research plans, with contextual help and guidance on how to answer those questions.
DMPs are intended to help researchers manage data across all phases of the research data lifecycle, from collection to sharing. They are often described as “living documents” that should be updated as needed while researchers work with their data. They can include a variety of different elements (Williams et al. (2017) identified 43 topics that may be required as elements of DMPs), and which elements may be required or useful can vary by discipline or by type of data. The elements of a DMP are intended to prompt researchers to consider how they will handle their data and what resources they will need before they start their research. The Tri-Agency Policy asks the researcher to submit a plan that addresses the following:
how data will be collected, documented, formatted, protected, and preserved
how existing datasets will be used and what new data will be created over the course of the research project
whether and how data will be shared
where data will be deposited.
Research funders, in Canada and internationally, want researchers to use DMPs to demonstrate that their data will be collected, stored, and preserved in a way that facilitates transparency, data sharing and reuse, and reproducibility of results. Researchers who do this will be given an edge when applying for funding to collect or use data. DMPs are also intended to have benefits for researchers, helping them think through and work with their data more effectively. In effect, DMP requirements are a form of social engineering, intended to nudge researchers into doing better research.
These benefits are largely unproven. In theory, carefully considering all the elements that DMPs incorporate should lead to better research, but theory sometimes collides with practice. “Indeed, an extensive literature review suggests there is very limited published systematic evidence that DMP use has any tangible benefit for researchers, institutions or funding bodies” (Smale et al., 2020). Given that DMPs are meant to enhance the research enterprise, it is unfortunate that relatively little thought seems to have been put into researching whether they actually achieve that goal or how they could be modified to do a better job.
We’ll look quickly at some of the topics often covered in a DMP.
Data Collection
Researchers need to list the types of data they will be collecting or acquiring and what file formats the data will be saved in. From the start, researchers should consider formats that will allow for data preservation, sharing and reuse; good formats are ones that can be used in widely available software packages. Open formats are even better: they have published standards so that anyone with the training can write the software to read them. Open formats are future-proof.
Thinking about file naming conventions before starting data collection can be surprisingly important. Researchers who don’t establish a system ahead of time are liable to end up with an assortment of files with names like “data.csv”, “data2.csv”, “finaldata.csv”, “fixeddata.csv” and so on. An example of a system for naming and tracking different versions of a data collection might be “shortdescriptivename-changemade-date.ext”. Including the change and date in the file name acts as a rudimentary form of version control, which will be discussed in more detail in chapter 10, “Supporting Reproducible Research with Active Data Curation.” Version control should also include further systems to help enhance the traceability of the data, such as noting information about every change made to the data on a master documentation file or making all changes to the data using code that is updated and saved after each change.
Documentation and Metadata
Documentation is essential to both preservation and traceability. If a file is preserved as a sequence of 0s and 1s on disk, but no one knows what those numbers represent, then the file hasn’t really been preserved. Documentation needs to include elements like a master study document noting where the data came from and how they were collected, giving columns in spreadsheets easily understood names, and recording detailed information about changes made to the data files.
Documentation can also include giving files and folders human-readable names and coming up with a sensible structure of folders and subfolders. One common form of additional documentation is the README file, which is simply a file included in each folder that lists the files present in that folder, describes the contents of each file, and explains any relationships between the files (e.g., if there are code files that were used to generate data files).
For many types of data, including health and survey files, codebooks are also important. Codebooks describe the structure and contents of data files according to some schema. For example, a survey codebook will list all the questions asked in a survey (which will be coded as variables), describe different possible response options, explain how the survey sample was chosen, and explain any additional variables created by researchers. Ideally, you should have sufficient documentation on your deposited data that someone who is knowledgeable in your field would be able to:
understand and follow the steps you took to collect your data in the first place and the decisions you made along the way
take your original data file and reproduce the changes you made to it to get your data into their final form
run the analyses that produced your final publishable results.
The documentation section of a DMP should also include information explaining how the researchers will make sure they keep track of and record every change made to the data file. If there will be many people working with the data, it’s especially important to have a system.
Code Files
Statistical programs, such as SPSS, Stata, and R, and general-purpose programming languages, such as Python, let you modify and analyze data by typing commands into a code file and then running them. Some programs, like SPSS, will also let you generate the commands using menu options. If any changes made to your data are done using code files, you will always be able to go back and figure out exactly how every change to your data happened.
Storage and Backup
Researchers can explain where they will be storing their data and how secure it will be in the storage and backup section. Storing only one copy of the data — on a personal hard drive that could fail or a USB stick that could be stepped on — is surprisingly common (Cheung et al., 2022). It’s also a bad idea, as many have discovered. A system that ensures data are regularly backed up is a good idea. The 3-2-1 backup rule is a widely used standard: there should be three copies of each file, the copies should be on two different media, and one copy should be off-site. If data is stored somewhere with an automated backup system (such as a departmental server or a cloud service) then that reduces the need for additional copies since a copy will be in the backup system.
Preservation and Sharing
Research transparency and the preservation and sharing of research data are key goals of RDM, so it is essential to address them in a DMP. The gold standard for data sharing is posting a complete, well-documented dataset in an online archive, where it can be downloaded by anyone, with an open or Creative Commons license that explicitly allows it to be reused. Some licenses include the stipulation that data that are used in further research should be properly cited (though, even if that is not stipulated, it is good practice and professional courtesy to do so).
If data will be shared, the most important step is identifying an appropriate repository. There are many appropriate data repositories available. Many institutions (universities, colleges, hospitals, etc.) have institutional data repositories with features that ingest data to preservation formats. These institutions commit that the data will be preserved and backed up. Individual journals also host archives to make data relating to the papers they publish available. There are also disciplinary repositories that host particular types of data, such as genomic data or geospatial data.
However, open sharing in a repository is not always advisable, and for some kinds of data (such as medical data) sharing may be highly unethical. Confidentiality, commitments made to research subjects, Indigenous data sovereignty, data ownership, and intellectual property concerns can all be reasons why openly sharing a particular dataset is not an option. In cases like this, researchers may need to find alternative sharing methods. One possible alternative would be to share documentation about the data in a repository and invite potential users to contact the research team for access. Sometimes parts of a data collection can be shared while other parts are considered too sensitive. The potential users may need to commit to following certain ethical standards, or other conditions may be applied. In these cases, the data will need to be preserved in some other way, in a secure archive or on a private network. See chapter 13, “Sensitive Data,” for more information.
The preservation and sharing section of a DMP needs to be explicit about how data will be preserved for the long term. It also needs to explain provisions for data sharing, including where it will be deposited, what parts of the data will be shared, and what access conditions there will be, if any. If data can’t be shared openly, the DMP needs to explain why not.
Conclusion
Research Data Management is a general term for the work researchers do as they organize and maintain data during and after their research. It is also a growing field of practice that engages librarians, data professionals, and researchers with the question of how to best manage data to include research transparency, data preservation, and data sharing so it can be criticized, studied, and used by other researchers and research consumers. Ultimately, RDM is about doing better research.
Reflective Questions
Pick a field of study and describe some examples of research data that might be used by researchers in that field. What might be some particular challenges of managing this data?
Read the Tri-Agency Research Data Management Policy. What does it tell you about how the funding agencies view RDM?
Find your (or a local) institution’s RDM strategy. What does it tell you about how the institution views RDM?
Visit DMP Assistant or use the template in Appendix 1 and create a DMP for an imaginary research project.
Key Takeaways
Research Data Management (RDM) is an umbrella term for the activities undertaken by researchers while they work with data. As a field of study, RDM asks you to engage with fundamental questions about the best way to perform research.
Canada’s three federal research funding agencies have a policy on Research Data Management that is intended to encourage researchers to make their research more transparent and to preserve and share their data.
Data Management Plans (DMPs) are documents prepared by researchers to describe how they intend to manage their data. They cover many aspects of working with data, including data collection, documentation, storage, sharing, and preservation.
Reference List
Cheung, M., Cooper, A., Dearborn, D., Hill, E., Johnson, E., Mitchell, M., & Thompson, K. (2022). Practices before policy: Research data management behaviours in Canada. Partnership: The Canadian Journal of Library and Information Practice and Research, 17(1), 1-80. https://doi.org/10.21083/partnership.v17i1.6779
Klein, R. A., Vianello, M., Hasselman, F., Adams, B. G., Adams Jr., R. B., Alper, S., Aveyard, M., Axt J. R., Babalola, M. T., Bahník, Š., Batra, R., Berkics, M., Bernstein, M. J., Berry D. R., Bialobrzeska, O., Binan E. D., Bocian, K., Brandt, M. J., Busching, R., … Nosek, B. A. (2018). Many Labs 2: Investigating variation in replicability across samples and settings. Advances in Methods and Practices in Psychological Science, 1(4), 443-490. https://doi.org/10.1177/2515245918810225
Smale, N. A., Unsworth, K., Denyer, G., Magatova, E., & Barr, D. (2020). A review of the history, advocacy and efficacy of data management plans. International Journal of Digital Curation,15(1), 1-29. https://doi.org/10.2218/ijdc.v15i1.525
Williams, M., Bagwell, J., & Zozus, M. N. (2017). Data management plans: The missing perspective. Journal of Biomedical Informatics, 71, 130-142. https://doi.org/10.1016/j.jbi.2017.05.004
About the author
Kristi Thompson
Kristi Thompson is the Research Data Management Librarian at Western University, and previously held positions as data librarian at the University of Windsor and data specialist at Princeton University. She has a BA in Computer Science from Queens University and an MLIS from Western University. Kristi supports research projects, administers data archiving software, works with Western’s Research Ethics boards, and is involved at a national level with developing research data infrastructure. She co-edited the book Databrarianship: the Academic Data Librarian in Theory and Practice and has published on topics ranging from data anonymization algorithms to intergenerational psychology. kthom67@uwo.ca | ORCID 0000-0002-4152-0075
The FAIR Principles and Research Data Management
2
Minglu Wang and Dany Savard
Learning Outcomes
By the end of this chapter you should be able to:
Explain the history of the FAIR principles.
Understand some of the key meanings, requirements, and underlying mechanisms of the FAIR principles.
Be familiar with the tools and frameworks available to help improve the FAIRness of data.
Understand how FAIR principles are included and referenced in research policies and data availability policies.
Evaluate how research data repositories support FAIR principles.
Find communities or initiatives that are using the FAIR principles within the Research Data Management ecosystem.
Introduction
The FAIR principles (Findable, Accessible, Interoperable, Reusable) are guiding principles that aim to encourage data stewards to improve the ways in which research data can be found and reused by computational systems in today’s growing, complex data ecosystem. In this chapter, we’ll explore the scope of the principles and the tools you can use to evaluate and enhance the FAIRness of a dataset. We’ll also discuss the impact of the principles and explore how they have been endorsed.
Brief History of FAIR Principles
Why Do We Need Guiding Principles for Research Data?
Research Data Management (RDM) requirements were first proposed by national research funders in European countries because of the rise of data intensive science. Requirements around Data Management Plans (DMPs), data citation and data availability have since become important for the responsible conduct of research and have introduced new conditions for researchers seeking to publish or receive public funding (Hrynaszkiewicz et al., 2020). Since then, data stewards have helped researchers meet RDM requirements by advocating for data preservation, providing training on how to prepare data, and developing infrastructure to safely store data. While advancements in informational technology infrastructure have made computational analysis of large amounts of data possible, the corresponding rise in the number of data repositories and standards created to disseminate data in different disciplines and sectors has helped encourage silos and prevented data from being brought together for meaningful research. As a result, the need for broader principles that can enable responsible data sharing has become increasingly important for different members of the wider research data community.
Origins of the FAIR Guiding Principles
In 2014, at an unconference in the Netherlands called “Jointly Designing a Data FAIRport” (Data FAIRport, 2014) the foundational principles for interoperable research data were first discussed. The next year, a draft of the guide was expanded by a FAIR data publishing group from FORCE11 and published for public commenting and endorsement (FORCE11, 2014a). In 2016, Barend Mons and a group of contributors authored an article in Scientific Data describing the need to establish the FAIR guiding principles for digital assets (Wilkinson et al., 2016). These principles are designed to help humans and machines overcome barriers to discovering, accessing, reusing, and citing research data.
Since its original publication, a version of the FAIR principles has been maintained by GO FAIR. Over time, these principles have influenced researchers wishing to prepare their data for sharing, data repositories wishing to evaluate and improve their infrastructure, and others wishing to assess and enhance their policies to support a FAIR data ecosystem.
What are FAIR Guiding Principles?
FAIR Guiding Principles
The main purpose of the principles is to ensure that machines and humans can easily discover, access, interoperate, and properly reuse the vast amount of information available for scientific discovery. The principles are meant to be high-level and domain independent, meaning they are broad in scope and can be applied to different types of data across multiple disciplines. By refraining from assigning technical specifications, the FAIR guiding principles allow for different implementations of the data management norms and characteristics they propose.
Humans and computers should be able to easily find metadata and data.
Machine-readable metadata are essential for automatic discovery of datasets and services.
F1. (Meta)data are assigned a globally unique and persistent identifier (PID).
F2. Data are described with rich metadata (defined by R1 below).
F3. Metadata clearly and explicitly include the identifier of the data they describe.
F4. (Meta)data are registered or indexed in a searchable resource.
Accessible
Once the user finds the data, they need to know how to access them and may require details around authentication and authorization.
A1. (Meta)data are retrievable by their identifier using a standardised communications protocol.
A1.1 The protocol is open, free, and universally implementable.
A1.2 The protocol allows for an authentication and authorisation procedure, where necessary.
A2. Metadata are accessible, even when the data are no longer available.
Interoperable
The data usually need to be integrated with other data and need to interoperate with applications or workflows for analysis, storage, and processing.
I1. (Meta)data use a formal, accessible, shared, and broadly applicable language for knowledge representation.
I2. (Meta)data use vocabularies that follow FAIR principles.
I3. (Meta)data include qualified references to other (meta)data.
Reusable
The ultimate goal of FAIR is to optimize the reuse of data, so metadata and data should be well-described so that they can be replicated and/or combined in different settings.
R1. (Meta)data are richly described with a plurality of accurate and relevant attributes.
R1.1. (Meta)data are released with a clear and accessible data usage license.
R1.2. (Meta)data are associated with detailed provenance.
R1.3. (Meta)data meet domain-relevant community standards.
Key Mechanisms of FAIR Guiding Principles: Metadata, Persistant Identifiers, and Licenses
Using appropriate metadata (information about data) is central to the FAIR principles. Similar to traditional research material (such as books and articles with bibliographic information), research data must be described in a structured way with controlled vocabularies that can be read by humans and machines so that data can be discovered and reused. As such, metadata are an integral part of research data outputs because they give the user important information about a dataset’s supporting documentation, identifiers, licenses, and other relevant elements. While metadata describing original research data should be rich and specific enough to allow humans and machines to understand the context and limitations of a dataset, they should also be offered by way of standardized descriptions so that the research data are more interpretable across different domains. To achieve this balance, researchers from various disciplines have endorsed well-developed metadata standards, such as those listed by the Research Data Alliance (RDA).
The other major mechanisms to guarantee findability and reusability of data are PIDs and licenses defining how data can be used. A publicly registered PID provides each dataset and its metadata with a unique and stable means of identification that can track any changes or movements online. Researchers sharing data on their own websites normally won’t be able to assign such an identifier and are encouraged to instead deposit their data with a dedicated data repository to access support around the use of PIDs, such as Digital Object Identifiers (DOI) (i.e., https://doi.org/10.1000/182).
Many researchers have concerns about data misuse and are reluctant to share data broadly (Wiley et al., 2019, p. 5). Data users, on the other hand, are often not able to confidently reuse and reshare secondary data derived from an original research dataset due to a lack of clarity around data reuse permissions. To counter this issue, standard data licenses, such as Creative Commons licenses or Open Data Commons licenses, or custom data use agreements can encourage data reuse while protecting data creators’ rights to credit and attribution. By providing information about how data that has been assigned a given license can legally and ethically be used, licensing helps define the terms of a relationship between data creators, publishers, and users for a particular dataset. You’ll learn more about licensing data in chapter 12, “Planning for Open Science Workflows.”
FAIR Data and Openness
Efforts to make data FAIR doesn’t necessarily lead to data being shared openly without restrictions. For example, data objects could have PIDs and FAIR metadata but not be open or reusable because of the way they’ve been licensed. The FAIR Principles Working Detailed Document offers four levels of FAIRness for data objects within a repository to describe different potential degrees of access to data:
Each data object has a PID and offers FAIR metadata.
Each data object has user-defined metadata to give rich provenance information.
Data elements within data objects are FAIR but are not open access and have defined restrictions around reuse.
Data objects and data elements are FAIR and public with well-defined licenses (FORCE11, 2014b).
The FAIR guiding principles allow data stewards to participate in important data publishing decisions and also provide space for other principles to be invoked. For example, the CARE (Collective Benefit, Authority to Control, Responsibility, and Ethics) Principles for Indigenous Data Governance published by the Global Indigenous Data Alliance in 2019 recognize the importance of Indigenous data sovereignty and of centring Indigenous Peoples’ rights and interests in any dealings with Indigenous data. In many ways, the CARE and FAIR principles complement one another and guide researchers toward taking into account the varied participants and purposes associated with research data. Indigenous data sovereignty is further discussed in chapter 3.
How to Make Your Data FAIR: Tools and Guidance
FAIR Guiding Principles and Data Management Plans
Data Management Plans (DMPs) are required by certain funding opportunities according to the Canadian Tri-Agency Research Data Management Policy (Government of Canada, 2021). In DMPs, researchers describe methodologies and strategies that reflect the FAIR guiding principles. For example, researchers should effectively document data in early phases of a project so that high-quality and complete metadata can be generated for dissemination. Also, researchers should negotiate data sharing licenses with collaborators and obtain permissions to share data from research participants early in the data collection stage if they wish to deposit and preserve data in repositories that meet the FAIR guiding principles.
FAIRness Evaluation and Improvement Tools for Researchers
A variety of tools have been developed to help researchers understand the FAIR principles and how to implement certain practices that align with the principles. These tools range from simple checklists to customized resources designed around researchers’ practices. Below is a list of FAIR assessment tools with different features for various user groups that are either currently available or under development. We recommend using these tools as you prepare to make your data FAIR.
Developed by a data services network in Europe, this is a simple one-page checklist based on the FAIR guiding principles with small modifications that make the concepts and terminologies more accessible for researchers. This checklist is a good introductory tool for researchers who are new to the field of RDM.
The FAIR data self-assessment tool was developed by the Australian Research Data Commons. By answering questions corresponding to the FAIR guiding principles, researchers can visualize the FAIRness of their practices for each principle and see overall FAIRness across the four principles. They can also compare their current ways of handling data with best practices, thus identifying potential areas of improvement.
FAIR Aware Tool (Data Archiving and Networked Services, 2021)
Developed by the Netherlands’ Data Archiving and Networked Services, the FAIR Aware tool provides a more detailed assessment to help researchers understand and implement the FAIR principles. Although this tool asks researchers to identify their domain of research, role(s), and organization(s), the actual content of the assessment is the same for all users. Researchers are presented with 10 awareness questions concerning each of the FAIR guiding principles and then asked to rate their willingness to comply with recommended practices. Once answers are submitted, an overview report of the researcher’s FAIR awareness levels is provided along with tips and resources on how to improve.
The F-UJI (FAIRsFAIR Research Data Object Assessment Service) is designed to assess the FAIRness of research data objects based on comprehensive and detailed FAIRsFAIR Data Object Assessment Metrics (Devaraju et al., 2020).
Other Guidance on How to Make Data FAIR
Besides FAIRness assessment tools, international and national research data services have developed general and discipline-specific guidelines on making data FAIR. Examples include the following:
How to FAIR (Danish National Forum for Research Data Management, n.d.) developed through interviews with a broad group of researchers and librarians
Top 10 FAIR Data & Software Things (Library Carpentry, n.d.) offers brief stand-alone guides on different topics and disciplines that can be used by members of research communities (i.e., astronomy, imaging, music, etc.)
Sustainable and FAIR Data Sharing in the Humanities (ALLEA Working Group E-Humanities, European Federation of Academies of Sciences and Humanities, 2020), provides practical guidance for researchers looking to make digital humanities data FAIR.
In Canada, researchers at the University of Ottawa Heart Institute and the Ottawa Hospital Research Institute have developed a series of data handling courses, including one called FAIR Principles (Centre for Journalology, n.d.). Not much additional guidance on the FAIR principles is available within the Canadian context. Librarians or researchers interested in this area could consult How to Be FAIR with Your Data: A Teaching and Training Handbook for Higher Education Institutions (Engelhardt et al., 2022) for examples of FAIR-related training options at various higher-education institutions in Europe.
Policy Impacts of the FAIR Principles
The FAIR principles have been used by government agencies, academic institutions, research funders, scholarly societies, publishers, and a variety of other actors to underscore the cultural, economic, and social significance of research data stewardship. As a result, these principles have become foundational for organizational bodies looking to influence researchers and how they to manage and share data. Some examples of policy impacts include the European Commission citing FAIR as directly influencing the development of the European Open Science Cloud (Hill, 2019, p. 284) and the U.S. National Institutes of Health citing the application of the FAIR data principles in their Data Management and Sharing Policy (Office of The Director, National Institutes of Health, 2020).
In Canada, a key government recommendation in the Roadmap for Open Science (2020) is the implementation of the FAIR principles by federal departments and agencies. This plan aims to ensure the interoperability of scientific and research data and metadata standards for data products tied to government agencies and departments is in place by January 2025. In terms of research funding, the Tri-Agency Research Data Management Policy states that Canada’s three federal research funding agencies — the Canadian Institutes of Health Research (CIHR), the Natural Sciences and Engineering Research Council of Canada (NSERC), and the Social Sciences and Humanities Research Council of Canada (SSHRC) — support FAIR guidance and expect researchers to share their data in accordance with FAIR principles and disciplinary standards where allowed by ethical, cultural, legal and commercial requirements (2021). In addition, Canadian academic publishers, such as Canadian Science Publishing (n.d.), have mirrored other journal publishers’ efforts by describing the FAIR principles as framing the contents of their data availability policy. Complying with such policies can mean employing the above-mentioned researcher tools to ensure data are as FAIR aligned as they can be before being released. However, in addition to data preparation, these requirements are also meant to influence a researcher’s thinking around the selection of a research data repository and how their choice will support FAIR alignment beyond the initial publication of their data.
FAIR Principles and Repositories
The FAIR principles represent an opportunity to recognize the current and potential value of data repositories. Wilkinson et al. (2016) underscore this idea in their work by discussing the benefits and limitations of data repositories and arguing these should evolve to respond to the discovery and reuse needs of researchers (pp. 2–4). Researchers should determine if a data repository meets their unique disciplinary RDM needs and allows them to comply with relevant ethical and legal requirements, and they should also consider whether their choice offers features that mirror FAIR guidance.
Research data repositories are special-purpose data containers designed to store research data and associated files and metadata to provide stable and long-term access to data outputs (Boyd, 2021, pp. 25–26). Repositories are critical pieces of digital infrastructure set up to encourage the discoverability of research data and help researchers publish and disseminate data. Which repository they choose will often depend on factors such as disciplinary norms, publisher or funder requirements, or data sharing guidelines. Additionally, a researcher may choose a repository based on such elements as the ease and convenience of the data deposit process, the types of files the repository accepts, the amount of data curation support they will receive, or the metadata schemas and controlled vocabularies a repository uses to describe the research data objects it stores. Consideration of these elements should lead researchers to select either a discipline-specific repository, a community-specific repository, or a generalist repository. Researchers can then explore whether their chosen repository puts the FAIR principles into practice by evaluating whether or not it offers some specific functions.
In their paper on the improvement of interoperability between types of repositories, Hahnel and Valen (2020) note that, to effectively function in alignment with the FAIR principles, a repository should do the following:
assign PIDs (DOIs, ORCIDs, and GRIDs) to its data products and related materials
offer its data alongside documented application program interfaces (APIs)
support robust options for data curation and subscribe to web accessibility guidelines
offer well-defined licenses that support data reuse
describe its path to sustainability by documenting preservation and disaster recovery workflows (pp. 195–197).
This guidance around optimal repository features mirrors similar recommendations made by OpenAIRE and by the FAIR Sharing initiative (Cannon et al., 2021). Some of these elements are also represented in the TRUST Principles for digital repositories released by Lin et al. (2020).
To assess how some major Canadian and international data repositories have documented their commitment to FAIR principles, review the following examples:
Additionally, you can locate appropriate repositories by consulting the re3data directory, which is a multidisciplinary tool that lists more than 2,800 entries for data repositories that can be searched by specific criteria, such as API type and metadata standard. Another strong option is the FAIRsharing directory, which is endorsed by the Research Data Alliance and provides a multidisciplinary platform where researchers can look up entries for repositories, data standards, and data policies. Both tools are excellent options for finding disciplinary-aligned repositories.
Some larger commercial, community, or publisher-endorsed repositories may offer more flexible and specialized features that align with FAIR guidance. However, when selecting a repository, one should consider whether their choice allows them to adhere to disciplinary norms, access the support needed to meet ethical or legal requirements, and help fulfill responsibilities toward communities that have expectations around access to their data. A choice of repository based on alignment with FAIR principles should always be balanced with these equally important requirements.
Getting Involved
For those interested in supporting the implementation of FAIR principles on a large scale, the GO FAIR initiative brings together individuals, institutions, and organizations to collaborate on policy development, skills development, and technical standards/technology development. This is primarily achieved via GO FAIR Implementation Networks that bring partners together to support the creation of unique deliverables. To learn more about implementation networks or about how to join them, visit https://www.go-fair.org/implementation-networks/.
Conclusion
The FAIR principles have helped clarify how some goals of the RDM movement may be achieved. Along with other guiding principles, they have been endorsed by funders, publishers, and varied research communities, and they have helped connect and align efforts around supporting data access and reuse. Researchers should monitor the evolution of the FAIR principles in terms of their influence on national and international research data ecosystems and how they impact data reuse in their own disciplines.
Reflective Questions
Use the FAIR Aware tool to conduct a self-evaluation of knowledge and skills for making data FAIR.
Use the FAIR principles as a framework to evaluate the FAIRness of the following sample datasets and identify suggestions to improve the FAIRness of these datasets:
FAIR guiding principles are high-level goals to guide the continuous optimization of research data, metadata, and data publishing environments for easier data access and reuse across domains through implementation of PIDs, rich and standard metadata, and data licenses.
Researchers can follow guidance and use tools to learn about FAIR principles, evaluate their current RDM practices, and plan for strategies to FAIRify their research data and publishing activities.
The FAIR principles have influenced government policies, research funding policies, and publisher policies regarding data availability.
Researchers can align their data management and sharing activities with the FAIR principles by ensuring they select data repositories that offer features that support FAIR compliance.
Research data repository registries are important tools for identifying repositories that offer FAIR-aligned features as well as other features related to disciplinary norms or legal/ethical/community-based obligations.
ALLEA Working Group E-Humanities. (2020). Sustainable and FAIR data sharing in the humanities: Recommendations of the ALLEA working group e-humanities. https://doi.org/10.7486/DRI.TQ582C863
Boyd, C. (2021). Understanding research data repositories as infrastructures. Proceedings of the Association for Information Science and Technology, 58(1), 25–35. https://doi.org/10.1002/pra2.433
Cannon, M., Graf, C., McNeice, K., Chan, W. M., Callaghan, S., Carnevale, I., Cranston, I., Edmunds, S. C., Everitt, N., Ganley, E., Hrynaszkiewicz, I., Khodiyar, V. K., Leary, A., Lemberger, T., MacCallum, C. J., Murray, H., Sharples, K., Soares E Silva, M., Wright, G., … (Moderator) Sansone, S-A. (2021). Repository features to help researchers: An invitation to a dialogue. Zenodo. https://doi.org/10.5281/zenodo.4683794
Devaraju, A., Huber, R., Mokrane, M., Herterich, P., Cepinskas, L., de Vries, J., L’Hours, H., Davidson, J., & Angus W. (2020). FAIRsFAIR data object assessment metrics (0.5). Zenodo. https://doi.org/10.5281/zenodo.6461229
Engelhardt, C., Biernacka, K., Coffey, A., Cornet, R., Danciu, A., Demchenko, Y., Downes, S., Erdmann, C., Garbuglia, F., Germer, K., Helbig, K., Hellström, M., Hettne, K., Hibbert, D., Jetten, M., Karimova, Y., Kryger Hansen, K., Kuusniemi, M. E., Letizia, V., McCutcheon, V., … Zhou, B. (2022). D7.4 How to be FAIR with your data. A teaching and training handbook for higher education institutions. Zenodo. https://doi.org/10.5281/ZENODO.5665492
Hahnel, M., & Valen, D. (2020). How to (easily) extend the FAIRness of existing repositories. Data Intelligence, 2(1–2), 192–198. https://doi.org/10.1162/dint_a_00041
Hrynaszkiewicz, I., Simons, N., Hussain, A., Grant, R. and Goudie, S., 2020. Developing a research data policy framework for all journals and publishers. Data Science Journal, 19(1), 1-15. http://doi.org/10.5334/dsj-2020-005
Lin, D., Crabtree, J., Dillo, I. Downs R. R., Edmunds R., Giaretta, D., De Giusti, M., L’Hours, H., Hugo, W., Jenkyns, R., Khodiyar, V., Martone, M. E., Mokrane, M., Navele, V., Petters, J., Sierman, B., Sokolova, D. V., Stockhause, M., & Westbrook, J. (2020). The TRUST principles for digital repositories. Scientific Data, 7, 144. https://doi.org/10.1038/s41597-020-0486-7
Wiley, C. A. & Burnette, M. H., (2019). Assessing data management support needs of bioengineering and biomedical research faculty. Journal of eScience Librarianship, 8(1), 1-19. https://doi.org/10.7191/jeslib.2019.1132
Wilkinson, M. D., Dumontier, M., Aalbersberg, Ij. J., Appleton, G., Axton, M., Baak, A., Blomberg, N., Boiten, J-W., da Silva Santos, L. B., Bourne, P. E., Bouwman, J., Brookes, A. J., Clark, T., Crosas, M., Dillo, I., Dumon, O., Edmunds, S., Evelo, C. T., Finkers, R., … Mons, B. (2016). The FAIR guiding principles for scientific data management and stewardship. Scientific Data, 3(1), 160018. https://doi.org/10.1038/sdata.2016.18
About the authors
Minglu Wang
Minglu Wang is a Research Data Management (RDM) Librarian at York University. She has published book chapters, conference/working papers, and research articles closely related to academic libraries and RDM services. Minglu Wang is an active member of the Association of College & Research Libraries (ACRL), a division of the American Library Association (ALA), and she contributed to multiple years of the Association’s publications of Top Trends articles and Environmental Scan white papers. She is a member of the Research Intelligence Expert Group, a part of The Digital Research Alliance of Canada (The Alliance) RDM Team, and has participated in the design and report writing of the RDM Capacity Survey of Canadian Institutions. Email: mingluwa@yorku.ca | ORCID: 0000-0002-0021-5605
Dany Savard
Dany Savard is the Associate Librarian for Collections and Research Services at the University of Toronto Mississauga Library. He has contributed to research articles on the topics of research data discovery and data repositories. He is a member of the Alliance Network of Experts’ Discovery and Metadata Expert Group and is the current Chair of its Canadian Data Repositories Landscape Working Group. He holds an MLIS from Western University and a Master of Arts in Public Policy and Administration from Toronto Metropolitan University. Email: dany.savard@utoronto.ca | ORCID: 0000-0001-7472-7390
Indigenous Data Sovereignty: Moving Toward Self-Determination and a Future of Good Data
3
Moving Toward Self-Determination and a Future of Good Data
Mikayla Redden and Dani Kwan-Lafond
Learning Outcomes
By the end of this chapter you should be able to:
Articulate the importance of Indigenous data sovereignty and its role in Indigenous self-determination.
Identify deficit-focused data and explain why these type of data are harmful.
Identify the differences in assumptions made by Western/dominant research culture and Indigenous research culture and understand how these assumptions affect data-related decision making in the research process.
Introduction
Indigenous Peoples is perhaps one of the broadest umbrella terms frequently applied to a contemporary global population of colonized and formerly colonized peoples who, today, are politically united because of a shared history of loss and degradation under colonization. This chapter focuses on the history and present-day iterations of knowledge theft and knowledge mining (defined in this context as collecting Indigenous knowledge without seeking permission or consulting partners in the community) from Indigenous communities, as well as the Indigenous communities’ sovereignty of their own data. Knowledge mining and data sovereignty intersect because digital data is the most common way to store and archive knowledge for use by community members and researchers.
To begin, we will present a brief history of the global political community of Indigenous Peoples, with a focus on the impact of the United Nations Declaration on the Right of Indigenous Peoples (UNDRIP) in Canada. In the Canadian context and for the purposes of this chapter, Indigenous is used to broadly refer to three ethnically and culturally distinct groups: First Nations, Métis, and Inuit.
The United Nations and Indigenous Self-Determination
UNDRIP was adopted in 2007 by all United Nations (UN) member states except for four settler colonial nation states: Canada, New Zealand, Australia, and the United States. These four later signed the Declaration in 2012 after considerable efforts by Indigenous Peoples in these members states and their allies. UNDRIP is an extension of the human rights system, which is most clearly articulated in the 1960 Universal Declaration of Human Rights. UNDRIP contains no new human rights, but is an articulation and affirmation of rights often denied to Indigenous Peoples (Erueti, 2022).
The access to, or denial of, rights to Indigenous Peoples is globally disparate. While settler states are partially defined by their majority rule over Indigenous communities within their borders, there are always local, historical, and culturally specific aspects to these contexts that we must consider. Local contexts will impact how access and control of data, information, and knowledge are negotiated and decided on, but are too numerous to delve into here. Instead, we point to the need to also understand policy, and the role policy frameworks can play in promoting and assuring data sovereignty, while preventing knowledge theft and knowledge mining.
UNDRIP is the most well-known and recent human rights framework that seeks to redress and uphold rights for Indigenous Peoples. But it is important to mention the International Labour Convention (ILO) 169 (1989), which most nation states in Central and South America had already signed/adopted before UNDRIP was developed. The ILO is a UN-affiliated agency with a focus on workers and working conditions in member nation states. ILO 169 itself was a revision and renaming of the Indigenous and Tribal Populations Convention 107 (1957), which arose in the wake of World War II out of a concern about discrimination and oppression faced by Indigenous Peoples.
ILO 107 and the revised ILO 169 are laws in the nation states that adopt them (Hanson, n.d-a; n.d-b). ILO 169 consists of 44 articles that set minimum standards in the areas of health care, education, and employment. It also recognizes rights to self-determination and calls upon nations states to protect Indigenous Peoples from displacement (Hanson, n.d-a; n.d-b). Whereas previous human rights frameworks used individual rights as the basic unit, UNDRIP extends these rights to collective groups of Indigenous Peoples, including those living as minority groups within larger nation states (as is the case in Canada). This important global framework emphasizes not only collective rights and identities, but also self-determination and the right to free, prior, and informed consent (FPIC). It also refers to historical wrongs and offers ideas for reparative measures (Erueti, 2022). The passage of UNDRIP was aspirational, insofar as it depends on each member nation to pass legislation that makes UNDRIP law (unlike ILO 169).
A History of Indigenous Peoples and Bad Data
Engagement between Indigenous Peoples and the governments in their Anglo-colonized countries centres on administrative policies and the programming that stems from them. This is certainly true in a Canadian context, where the mandate for Indigenous Services Canada (ISC) reads, in part, “Our vision is to support and empower Indigenous peoples to independently deliver services and address the socio-economic conditions in their communities” (Indigenous Services Canada, 2022). ISC focuses on disadvantages and social disparities of Indigenous Peoples and how the colonial nation state can help them. The same can be said when looking at mandates by the United States Department of the Interior Bureau of Indian Affairs (2023) and at the National Indigenous Australians Agency’s Closing the Gap framework (2019) (for a detailed analysis of these policies, see Walter et al. in the Additional Resources section). Each of these colonial organizations situate data as the basis for their policy decisions.
Across all these countries, data paint a picture of Indigenous Peoples as having poorer health, lower education levels, and lower socio-economic status, which results in, and often numerically justifies, their startling high rates of incarceration, victimization, and suicide. All of these nations had active policies to assimilate Indigenous Peoples into Anglo-colonial society by forcibly removing children from their families and communities. These data are not disputed by Indigenous folks, but the social, racial, and cultural assumptions made by those collecting the data are questioned (Walter & Andersen, 2013). These assumptions provide us with only a narrow, colonized snapshot of Indigenous realities (Walter & Suina, 2019). As a result, the policies and programs developed using these data do not reflect the needs of Indigenous Peoples. All data collected from Indigenous Peoples should be their own to control, access, interpret, and manage.
This chapter will introduce this idea, known as Indigenous data sovereignty, which is defined as the right of Indigenous Peoples to collect, access, analyze, interpret, manage, distribute, and reuse all data that was derived from or relates to their communities. This chapter will also discuss the frameworks and strategies that affirm Indigenous data sovereignty in the dominant research culture.
Indigenous Data: What is it? How Would It Be Different Under Indigenous Self-Determination?
Indigenous data is a broad term referring to information and knowledge about individuals, groups, organizations, ways of knowing and living, languages, cultures, land, and natural resources. It exists in many formats, including traditional knowledge, which is defined as information that is passed down between generations. Traditional knowledge includes languages, stories, ceremonies, dance, song, arts, hunting, trapping, gathering, food and medicine preparation and storage, spirituality, beliefs, and world views. Indigenous data also include born-digital and digitized data collected by researchers, governments, and non-governmental institutions (Walter 2018; Kukutai & Taylor, 2016; Walter et al., 2021; Walter & Suina, 2019).
Across colonized nations, Indigenous data collected by governmental and non-governmental researchers are focused on differences, disparities, disadvantages, dysfunction, and deprivation of Indigenous Peoples — abbreviated as 5D data by Walter (2016; 2018). 5D data are lacking in social and cultural context due to their collection and analysis by researchers and policymakers coming from non-Indigenous world views and comparing the data against their colonial realities. No matter the analyses conducted, the policy-forming statistics are invalid because they are produced from 5D data and, therefore, focus entirely on deficits (Walter & Suina, 2019).
Data needs vary widely among Indigenous communities, but there is a consensus that all Indigenous data should reflect the social, political, cultural, and historical realities of Indigenous lives so that it can be used to support the self-determined needs of Indigenous Peoples (Walter, 2018; Walter & Suina, 2019). These data needs are central to the global Indigenous data sovereignty movement and are affirmed by the UNDRIP.
The Indigenous data sovereignty movement advocates for self-governance, meaning that Indigenous Peoples would control all aspects of the research process, from idea conception to use of resulting data. Without Indigenous data sovereignty, there is no way to ensure that Indigenous data reflects the rich diversity in Indigenous world views, ways of knowing, priorities, cultures, and values (Walter & Suina, 2019).
Indigenous Data Self-Governance Organizations in Anglo-Colonized Nations
Before getting into best practices for working with Indigenous data, you should be aware of the following assumptions that differ between Indigenous and Eurocentric research practices.
Table 1. Differences between Eurocentric and Indigenous research practices.
Eurocentric assumption
Indigenous assumption
Researchers remain objective and unbiased.
Research is NOT objective and unbiased. It can’t be. Researchers are connected to all living things — this includes the human or non-human subjects of their research. Emotions are connected to cognition. When we think, we use reason, which is tied to our emotions, making research subjective.
Research is planned and led by the researcher(s).
Research is community based. Community members always shape the research question. No matter the topic, research allow us to gather knowledge that works toward one common goal: to create social action. Knowledge paired with action leads to social change.
The researcher is largely unaffected by the research process.
Personal growth of the researcher is an important result (because research is subjective).
No piece or member of the sample is more valuable than the others (outside of a case study).
The eldest community members most likely carry the most valuable knowledge. If elders are not involved in the research process, it is not based in traditional knowledge. One caveat to keep in mind here is that not all elder community members are “Elders.” There are younger community members who carry traditional knowledge or language. Therefore, the terms “Traditional Teacher,” “Knowledge Keeper,” or “Language Keeper” are more descriptive than simply referring to all traditional peoples as “Elders.”
In addition to these four assumptions, Indigenous Peoples consider the following four Rs during the entire research cycle, including publication: Relationality, Respect, Reciprocity, and Responsibility.
Relationality is the centre of everything in Indigenous world views and knowledge systems (Wilson, 2008). Relationships inform all of our experiences; as Littletree, Belarde-Lewis, and Duarte (2020) put it, they are “at the heart of what it means to be Indigenous.” As we engage with the world, it is our relationships that ensure we are accountable to our relations in every one of our interactions. Our relations include the land, our ancestors, and future generations. We are our relationships and are, in fact, made up of relationships between four realms: the intellectual, spiritual, emotional, and physical parts of ourselves (Archibald, 2008). It is essential that researchers interested in Indigenous ways of knowing understand that all data, books, articles, stories, art, and other outputs began as relationships (Meyer, 2008). These things are a result of Peoplehood, defined as communal knowing. An example of this is shared histories and languages, ceremonies, celebrations, and life cycles (Holm, Pearson, & Chavis, 2003). Indigenous ways of knowing are where those relationships turn into actions. Some examples of this are asking questions, watching dance, listening to relations, dreaming, telling stories, experiencing life events, making art, and intergenerational activities like planting seeds and nurturing them as they grow into something we harvest in the fall. The Expressions of these ways of knowing are tangible items like documents, songs, tools, traditional dress, written and oral stories, books, food, paintings, carvings, and pottery. These Expressions are often held by knowledge organizations, such as libraries, museums, schools, sacred organizations, and Indigenous nations (Kidwell, 1993). The relationality at the centre of these items is often missed by non-Indigenous researchers and knowledge organizations. For a deeper understanding of relationality, see Littletree’s (2018) conceptual model. Also see Holm, Pearson, and Chavis (2003); Archibald (2008); Wilson (2008); Meyer (2008); and Kidwell (1993), whose work informed the model.
Figure 1.Indigenous Systems of Knowledge by Sandra D. Littletree. All Rights Reserved. Used with permission.
Respect, reciprocity, and responsibility support relationality.
Respect for land, cultural protocols, history, language, and intellectual, spiritual, emotional, and physical health. Do not make assumptions about the knowledge you are working with. Use an educated, but open-minded approach. The knowledge you are inquiring about may be associated with painful historical events and elicit a great deal of trauma.
Reciprocity for the information you are receiving. Be open to give and receive information. There is a long history of knowledge mining from Indigenous communities by settlers. Reciprocity does not solely refer to monetary compensation, although it is important to financially compensate individuals and communities for their time and information. Reciprocity also includes supporting communities in recovering traditions and important cultural expressions.
Responsibility to obtain informed consent and nurture any relationships you have built for life — well past the end of the research project. Indigenous world views tell us that time is non-linear; it is circular. The community you are working with must guide the process and make decisions about their knowledge and information at every step.
For an in-depth look at these assumptions and considerations, see Research Is Ceremony: Indigenous Research Methods (2008) by Shawn Wilson and “Centering Relationality: A Conceptual Model to Advance Indigenous Knowledge Organization Practices” (2020) by Sandra Littletree, Miranda Belarde-Lewis, and Marisa Elena Duarte.
First Nations Data Self-Governance in Canada
In 1994, the federal government excluded First Nations people who live on-reserve from national population surveys (First Nations Information Governance Centre, 2022a; 2002b). In response to the data gap this created, First Nations advocates and academics formed what would later become the First Nations Information Governance Centre. Two years later, the Assembly of First Nations formed the National Steering Committee (NSC), which was tasked with developing the First Nations and Inuit Regional Longitudinal Health Survey, an early iteration of what is now known as the First Nations Regional Health Survey (RHS). The first Survey report was published in 1997 (First Nations Centre, 1997). The RHS is the only national health survey that is governed by Indigenous Peoples and based on both Indigenous and Western understandings of health and well-being. It was later reviewed by a group at Harvard University who determined that it was, “unique in First Nations ownership of the research process, its explicit incorporation of First Nations values into the research design and in the intensive collaborative engagement of First Nations people and their representatives at each stage of the research process” (Harvard Project on American Indian Economic Development, 2006).
In 1998 the NSC established a set of principles called the First Nations Principles of OCAP® to ensure that First Nations people were stewards of their own information in the same way they are stewards of their own lands. The NSC later became the First Nations Information Governance Committee and, later, an incorporated nonprofit called the First Nations Information Governance Centre (FNIGC).
OCAP® is an acronym for ownership, control, access, and possession. These four principles govern how First Nations data and information should be collected, protected, used, and shared. OCAP® was created because Western laws do not recognize the community rights of Indigenous Peoples to control their information. The principles are reflective of Indigenous world views on stewardship and collective rights. Historically, Indigenous Peoples have not been consulted about information collected about them, nor who collects it, how they store it, or who else has access to it. As a result of this lack of self-governance, data collection has lacked relevance to the priorities and concerns of Indigenous Peoples.
The principles affirm the rights and self-determination of Indigenous communities to own, control, access, and possess information about their peoples and asks any researchers interested in conducting research with an Indigenous community to learn the principles before they begin. The principles can benefit anyone who works with (or hopes to work with) Indigenous research, data, information, or cultural knowledge and supports Indigenous Peoples’ path to data sovereignty (FNIGC, 2022). FNIGC and Algonquin College have developed an online course to train researchers in the principles and history of OCAP®.
Ownership: Communities or groups collectively own their own knowledge, data, and information in the same way that individuals own their own personal information.
Control: Communities have control over all stages of research, from collection to storage and everything in between. Communities have control and decision-making power over all aspects of research and information that impacts them.
Access: Communities should be able to access their collective information and data, no matter its location. Communities should be able to manage and make decisions regarding the access to and control of their information.
Possession: This is like Ownership, but more concrete. It is the physical control of data, the mechanism that asserts and protects ownership of information. It may also be thought of as stewardship.
A Non-Exhaustive List of Strategies for Conducting Research That Respects OCAP®
(Adapted from Schnarch (2005), National Aboriginal Health Organization (2005), and First Nations Information Governance Centre (2016))
Prepare for it to take more time. You will need to get permission from community decision-makers like the Chief and Council, advisory committees, and Knowledge Keepers in addition to your research ethics board, individual participants, funding agencies, etc. Community consent is as important as the informed consent of individual participants. Research must be suspended if the community does not consent.
Negotiate the research relationship and create a written agreement that affirms your rights and responsibilities as well as those of the community and all other partners in the research process. Be sure that all parties understand, agree, and receive a copy of the document.
Seek funding sources that have policies that affirm Indigenous self-determination and sovereignty.
Provide explanations and seek feedback for all aspects of the project. This can include your purpose, the anticipated benefits and risks of the project, the methods you plan to use, how you recruit your participants, how you plan to report your findings, and what you plan to do with the resulting data.
Respect the privacy, cultural and community protocols, well-being, and individual and collective rights of Indigenous Peoples. Follow stringent ethical guidelines. Develop a code of research ethics or guidelines specific to the project. Be sure to consider that each community may have distinct interpretations and comfort levels with OCAP® and other self-determination frameworks.
Support the interests of the community and maximize the benefits of the work. This includes building on successful Indigenous initiatives and providing opportunities for further capacity building.
Submit all communications, summaries, and reports of your research to the community in the appropriate language prior to publication.
Ensure that Indigenous communities have access to their data, not just the reports and resulting publications.
Critical Analysis of OCAP®
Critics might say that a necessary precursor to Indigenous controlled data and research is capacity development. They may argue that there is a lack of expertise within the community, which could lead to risks and consequences. Some would encourage First Nations, Inuit, and Métis Peoples with existing credentials in higher education to become involved, or even encourage folks from the community without existing credentials to obtain some that are related to research.
Both of these solutions could benefit individuals, but do they support nation and community building in addition to career building? Obtaining higher education credentials often requires leaving the community, which can alienate them from their communities. Not so long ago, choosing to go to university forced First Nations, Inuit, and Métis Peoples to relinquish their Indian identities and status and assimilate into white settler society. The real beneficiaries in this situation are the institutions where individuals go to study under or work for.
Opportunities to work as a full-time researcher within communities are very rare. The ability to walk in two worlds (i.e., balance Indigenous values and manage community responsibilities while advancing academic careers) is challenging, often forcing folks to make a difficult choice between the two. Furthermore, suggesting that communities cannot conduct ethical and beneficial research on their own is harmful at best. Research does not have to be specialized, use complex methodologies, or be full of scientific jargon to be beneficial.
Looking to the Future with OCAP®
At this point in time, the Principles of OCAP® are the strongest tool First Nations people in Canada and their allies have in asserting their sovereignty over data. The principles have the capacity to challenge bad data and research practices and encourage good ones. Still, there are challenges we face in moving forward in a meaningful way.
For Research Ethics Boards: Assess all research applications going forward for OCAP® principles, or another appropriate framework, so that all research is compliant. But what about assessment of ongoing and historical research against OCAP®? After all, substantial harm has been caused to Indigenous communities via exploitative research practices. Does Truth and Reconciliation not remain a stated commitment of many educational institutions and governmental bodies?
For policy writers: Address the ownership, control, access, and possession of data and research for all policies, and review previous policies. Some examples of existing policies that affect community-based research are institutional fire and smoking policies; data storage and dissemination policies; and intellectual property policies.
For researchers: Be flexible, willing to compromise, and able to challenge your own assumptions about the ownership, control, access, and possession of the work that you may see as “yours.” Remember that true community-based research aims to create positive and Indigenous-determined social action.
For data management professionals: Consider the community a research project is focused on before you develop a Data Management Plan. Defer to the community to assess their understanding of and comfort level with data self-determination no matter the set of principles you are working from. Always approach projects with Relationality, Respect, Reciprocity, and Responsibility at the forefront of your mind.
Other Frameworks for Indigenous Self-Determination and Good Research Practices
This chapter has focused on the history and present-day iterations of knowledge theft and knowledge mining, including a history of the global political community of Indigenous Peoples, especially the impact of the United Nations Declaration on the Right of Indigenous Peoples (UNDRIP) in Canada. We have contextualized the importance of Indigenous data sovereignty within this history, and have shared best practices for working with Indigenous data in order to challenge historically bad data practices. These best practices include recommendations from the Principles of OCAP®, the strongest tool First Nations people in Canada and their allies have in asserting their sovereignty over data.
Reflective Questions
Which assumption or consideration of reframing your research practices to incorporate Indigenous ways of knowing did you find most challenging? Why?
Can you identify any strategies you could deploy in your own research to be respectful of the Principles of OCAP® or other principles for self-determination?
Consider asking your institution to provide researchers the opportunity to complete the Fundamentals of OCAP® online training course or host the FNIGC to lead a workshop before you submit your next application to your research ethics board. If funding is not currently available, consider the following resources:
Data gathered by colonial nation states “others” Indigenous Peoples by comparing them against an Anglo-colonized reality, which lacks social and cultural context, and focuses on social disadvantages and disparities. This makes the policies it informs invalid. Indigenous data sovereignty is crucial if the goal is to form valid and useful policies and programs.
Researchers informed by Indigenous ways of knowing make different assumptions than those informed by Western ways of knowing. Indigenous researchers also ensure that their work is community-based, by centering relationality, respect, reciprocity, and responsibility.
Good Indigenous data is self-determined, meaning that Indigenous Peoples own it, control it, determine who has access to it, and oversee its storage.
Additional Readings and Resources
Lovett, R. Lee, V., Kukutai, T., Cormack, D., Rainie, S. C., & Walker, J. (2019). Good data practices for Indigenous data sovereignty and governance. In A. Daly, S. K. Devitt, & M. Mann (Eds.), Good data (pp. 26-36). Institute of Network Cultures: Amsterdam.
Toombs, E., Drawson, A. S., Chambers, L., Bobinski, T. L. R., Dixon, J., & Mushquash, C. J. (2019). Moving towards an Indigenous research process: A reflexive approach to empirical work with First Nations communities in Canada. The International Indigenous Policy Journal, 10(1). https://doi.org/10.18584/iipj.2019.10.1.6
Tuhiwai Smith, L. (2012). Decolonizing methodologies: Research and Indigenous peoples. University of Otago Press: Dunedin, New Zealand.
Reference List
Archibald, J.-A. (2008). Indigenous storywork: Educating the heart, mind, body, and spirit. Vancouver: UBC Press.
Erueti, A. (2022). The UN declaration on the rights of Indigenous Peoples: A new interpretative approach. Toronto: Oxford University Press.
First Nations Information Governance Centre. (2016). Pathways to First Nations’ data and information sovereignty. In T. Kukutai, & J. Taylor (Eds.), Indigenous data sovereignty: Toward an agenda, (pp. 139-156). Canberra, Australia: ANU Press.
First Nations Information Governance Centre. (2014, July 22). Understanding the First Nations Principles of OCAP: Our road map to information governance [Video]. Youtube. https://youtu.be/y32aUFVfCM0
Holm, T., Pearson, J. D., & Chavis, B. (2003). Peoplehood: A model for the extension of sovereignty in American Indian studies. Wicazo Sa Review, 18(1), 7–24. https://doi.org/10.1353/wic.2003.0004
Kidwell, C. S. (1993). Systems of Knowledge. In A. M. Josephy & F. E. Hoxie (Eds.), America in 1492: The world of the Indian peoples before the arrival of Columbus, (pp. 369–403). Vintage Books.
Littletree, S., Belarde-Lewis, M., & Duarte, M. (2020). Centering relationality: A conceptual model to advance Indigenous knowledge organization practices. Knowledge Organization, 47(5), 410-426. https://doi.org/10.5771/0943-7444-2020-5-410
Meyer, M. A. (2008). Indigenous and authentic: Hawaiian epistemology and the triangulation of meaning. In N. K. Denzin, Y. S. Lincoln, & L. T. Smith (Eds.), Handbook of critical and indigenous methodologies, (pp. 217–232). Sage.
National Aboriginal Health Organization. (2005). Ownership, control, access, and possession (OCAP) or self-determination applied to research: A critical analysis of contemporary First Nations research and some options for First Nations communities.https://ruor.uottawa.ca/bitstream/10393/30539/1/OCAP_Critical_Analysis_2005.pdf
United States Department of the Interior Bureau of Indian Affairs (2023). Mission statement.https://www.bia.gov/bia
Walter, M. (2016). Data politics and Indigenous representation in Australian statistics. In T. Kukutai & J. Taylor (Eds.), Indigenous data sovereignty: Toward an agenda, (pp. 79-87). Canberra, Australia: ANU Press.
Walter, M. (2018). The voice of indigenous data: Beyond the markers of disadvantage. Griffith Review, 60, 256–263.
Walter, M., & Andersen, C. (2013). Indigenous statistics: A quantitative research methodology. Routledge: Walnut Creek.
Walter, M., Kukutai, T., Russo Carroll, S., & Rodriguez-Lonebear, D. (2021). Indigenous data sovereignty and policy. Taylor & Francis: Milton.
Walter, M., & Suina, M. (2019). Indigenous data, Indigenous methodologies, and Indigenous data sovereignty. International Journal of Social Research Methodology, 22(3), 233-243. https://doi.org/10.1080/13645579.2018.1531228
Wilson, S. (2008). Research is ceremony: Indigenous research methods. Fernwood Publishing: Halifax.
About the authors
Mikayla Redden
I am a mixed-race woman; Anishinaabe with Anglo settler heritage. I am a granddaughter, daughter, sister, auntie, helper, and learner. I live and work on the Tkaronto Purchase but was born and raised on Treaty 20. Though I am a member of Curve Lake First Nation, I was not raised in the community. My great-grandfather is John ‘Jack’ Jacobs. Jack was married to my great-grandmother, Edith Marsden of Scugog First Nation. Jack enfranchised himself and his children under section 214 of the Indian Act in March of 1935. This means that they relinquished their Indian identities and assimilated into white settler society. Our family settled in nearby Burleigh Falls, Ontario, finding community with a local Métis settlement. The branch of the family I come from eventually moved to Keene, Ontario. I have the privilege of walking in two worlds; learning from my relations on and off-reserve, both urban and rural, traditional and contemporary, and am able to apply pieces of that knowledge to my work life, as an academic librarian.
Dani Kwan-Lafond
I am mixed-race woman, born in Treaty 4 territory, and I am a member of many communities through family and kin, including Asian, French, Jewish, and Anishnaabe communities. I teach courses focused on social inequity, race, and Indigenous-Settler relations. I do not self-identify as Indigenous and the focus of my work is on settler colonial policies and the ideologies that maintain inequity, as well as land-based learning, Indigenization, and experiential learning. I live and work, and make community, on the historical and present-day lands of the Anishnabek nation, also home to Haudenosaunee Confederacy and other Indigenous peoples, as well as to many newcomers.
A Canadian Context for Research Data Management
II
Canadian Research Data Management: History and Landscape
4
Eugene Barsky; Elizabeth Hill; Tatiana Zaraiskaya; Minglu Wang; and Lucia Costanzo
Learning Outcomes
By the end of this chapter you should be able to:
Describe the history and background of Research Data Management in Canada.
Identify the Canadian groups and individuals involved in Research Data Management.
Understand regional developments in Research Data Management.
Comprehend the technological tools and data repositories used collaboratively by Canadian researchers.
Introduction
Canada and many other developed countries are establishing Research Data Management requirements across a range of scholarly disciplines. Barriers to data management, data preservation, and data sharing, which you’ll learn about in future chapters, are being addressed through the recommendation and use of community standards, such as established metadata, data documentation, and disciplinary repositories.
As you’ve now learned, the Canadian Institutes of Health Research (CIHR), the Natural Sciences and Engineering Research Council of Canada (NSERC), and the Social Sciences and Humanities Research Council of Canada (SSHRC) are Canada’s federal research funding agencies. In March 2021, the agencies released the Tri-Agency Research Data Management Policy to gradually begin Data Management Plan (DMP) requirements with selected grant programs. Through these programs, the agencies actively encourage research institutions to provide their researchers with an environment that enables robust research data stewardship and curation practices and to deliver support for managing and depositing research data in secure, curated, and accessible repositories. But even before this policy was released, visionary leaders and organizations, especially Canadian academic libraries, were carrying out grassroots data management awareness-raising initiatives and efforts.
Over the past decade, academic libraries in Canada have been working collaboratively to deliver RDM support to their communities (Steeleworthy, 2014; Liss, 2018). Collaborations between academic libraries and the broader research community address the central challenges of infrastructure, services, and training through initiatives such as the Portage Network (Portage) and Research Data Canada (RDC). Both these entities are now part of the Digital Research Alliance of Canada (Alliance).
In this chapter, we provide a brief history and overview of Canadian RDM, which began with grassroots initiatives before evolving into larger national efforts. The chapter updates and expands on previous work from a few years ago (Barsky et al., 2017).
A Brief History of Research Data Management in Canada
Since the end of the 20th century, academic libraries have discussed and advocated for centralized data archiving and data discovery services and improved access to research data in Canada. However, in a country with a relatively small and geographically dispersed population, centralization is challenging. In the early stages of RDM, Canadian academic librarians succeeded in strengthening the social sciences and, especially, government data collections available to researchers for secondary analysis purposes. The academic libraries also contributed to the development of a national RDM community of practice. By leveraging the close ties between researchers and data librarians and specialists, the network of data stewards was not only able to contribute collaboratively to the development of RDM tools and infrastructures, but was also able to make new resources available to local researchers through data education, consultation, and data deposit services.
Providing Access to Statistics Canada Data
The Data Liberation Initiative (DLI), a subscription-based service providing access to Statistics Canada data, is an excellent early example of how data management collaboration can help build and maintain data delivery infrastructure and train data reference experts. The DLI program began in 1996 as a result of consultations between Statistics Canada, the Canadian Association of Research Libraries (CARL), and the Humanities and Social Sciences Federation of Canada (Boyko & Watkins, 2011). The DLI was founded in response to both the high costs of Statistics Canada’s public use microdata files and the lack of data infrastructure at Canadian universities to provide access to these data (Humphrey, 2005). Due to budget cuts in the 1980s, the public use microdata files were priced on a full cost recovery basis, so only the most well-funded researchers could afford them.
The DLI collection includes thousands of data files for hundreds of survey series. Its size and the demand from researchers have directly contributed to the growth of the library data infrastructure needed to manage and preserve access to these data. When the DLI was formed, there was little expertise in many libraries to support data services. However, Statistics Canada required a point of contact within the library who would be responsible for distributing data to end-users. So libraries had to develop staff expertise through DLI training activities (Humphrey, 2005). Training programs under the DLI have led to the development of skilled library professionals and a national academic data community. The need to support the DLI program also led to the development of local initiatives to provide or improve data delivery to data specialists and users. These data delivery systems include <odesi> and Abacus in Ontario and BC, as well as systems in the Western provinces and Quebec (Gray and Hill, 2016). Sources cited for this chapter provide further in-depth reading.
National Research Data Strategy in the Early 2000s
In the 2000s, Hackett (2001) identified a wide range of issues related to Canadian research data acquisition, preservation, and access. Difficulty locating and accessing previously collected Canadian data was a key issue. This difficulty was due to high costs, a lack of a central resource directory or depository service, and a lack of a national body to set standards and provide guidance, funding, and infrastructure (Hackett, 2001). There were some exceptions. In the disciplines of physical sciences and genetics, there was already an international culture of data sharing through disciplinary repositories. The importance of data sharing to scientific practice in these disciplines led to the establishment of some Canadian repositories that did not need a policy. Examples of domain repositories include the Polar Data Catalogue (a project of the Canadian Cryospheric Information Network), the Canadian Astronomy Data Centre (an initiative of the Canadian Advanced Network for Astronomical Research), and CBRAIN (an initiative of the McGill Centre for Integrative Neuroscience, MCIN). However, the lack of interdisciplinary coordinated data curation and metadata standards still remains a problem.
For the last twenty years, the federal government has consulted with various research communities, including the National Library of Canada and the National Archives of Canada (now Library and Archives Canada), about the benefits and challenges of RDM. In 2005, the Canadian government released the National Consultation on Access to Scientific Research Data (NCASR) report. This was the cumulative work of an expert task force of more than seventy Canadian leaders in the fields of research, administration, and libraries, among others (Strong & Leach, 2005). The report included a recommendation for the development of a national steering body to form a national data archive and coordinate data management. It also included a recommendation for project funding across sectors in Canada. However, the approach ultimately failed to gain political support (Humphrey, 2012a).
Without a national steering body or resources from the federal government, academic libraries had to forge an alternative path. They built institutional and cross-institutional repositories for disseminating and archiving data, particularly long-tail research data, which is the large number of relatively small datasets produced across many disciplines (Heidorn, 2008). These long-tail datasets are diverse and are often difficult to manage (Cooper et al., 2021). Libraries had expertise in archiving and preserving research output and a history of engagement in solutions for access to and dissemination of licensed data through their work with the DLI program. They were recognized as being well positioned to take on the challenge of managing long-tail datasets.
A Grassroots Approach to Canadian RDM Infrastructure Beginning in the 2010s
In 2008, a Research Data Strategy Working Group was formed to implement the recommendations made by the NCASR. It was a task force appointed by the National Research Council of Canada with over seventy Canadian leaders in scientific research. At the same time, CARL, a group representing Canada’s largest university libraries and two federal institutions, had started participating in various national conversations about the future of Canadian digital research infrastructure. CARL gradually made the case for RDM, high-performance computing (represented by Compute Canada), and high-speed research network (represented by Canada’s National Research and Education Network (CANARIE)) to be considered equally important pillars for such an infrastructure (Humphrey, 2012b).
In 2011, CARL and the Research Data Strategy Working Group held a Research Data Summit, which resulted in the formation of RDC in 2012. Since 2014, the project has been supported by CANARIE, a not-for-profit organization whose mission is to operate the national backbone network of Canada’s research and education network. RDC has helped form committees and launch technical projects, and it has partnered with international organizations to advance research data infrastructure and expertise. RDC coordinated the National Data Services Framework (NDSF) Summit, first held in 2017 and again in 2019–2022. The NDSF Summit brought together RDM groups and experts, such as funding agency representatives, disciplinary data repository curators, and data librarians, from around the country. They discussed and raised awareness on the importance of prioritizing a nationally coordinated RDM infrastructure and services for the future of Canadian digital research infrastructure (Attendees of the NDSF Summit, 2019).
As part of CARL’s efforts to enhance library readiness for research data support services, an RDM course was offered to libraries in early 2013. In the wake of the course, a forum called the Canadian Community of Practice for Research Data Management was created for ongoing dialogue related to RDM activities in Canada.
CARL directors created more formal relationships with the organizations providing Canadian libraries with research computing infrastructure, namely CANARIE, Compute Canada (high-performance computing), Canadian University Council of Chief Information Officers (CUCCIO), and the National Science Library. A one-year pilot project, known as project ARC, was launched in 2014 to foster a community of practice for research data in Canada. The pilot resulted in the creation of a network of experts, including academic librarians, system and code developers, and data service providers. Project ARC was a success and became the Portage Network in 2015, with the mission of providing stewardship for Canadian researchers through a network of experts across the country. As of April 1, 2021, Portage became part of the Alliance. The RDC subsequently amalgamated with the Alliance in the spring of 2022. Currently, the Alliance provides an integrated digital research infrastructure and service for all academic researchers across Canada.
National RDM Policy in the Late 2010s and Early 2020s
By 2016, following in the steps of other countries, Canada’s federal research funding agencies began developing an RDM policy by releasing a “Statement of Principles on Digital Data Management.” This statement proposed expectations for researchers, research communities, research institutions, and funders to collaborate on building a robust and open environment for Canadian research data.
In 2018, the agencies announced a draft RDM policy and started a public consultation. The agencies received over one hundred submissions of feedback from a variety of experts on Indigenous research, monitoring and compliance, and each of the three pillars of implementation detailed in the policy: RDM strategy, DMP, and data deposit. In March 2021, the agencies formally announced their Tri-Agency Research Data Management Policy: promoting excellence in RDM within the Canadian research community, while recognizing the diverse context of disciplinary scientific inquiry, legal and ethical constraints, institutional capacities, and Indigenous communities’ self-determination and engagement. As a result of this long-anticipated announcement, the policy established an RDM support mandate within research institutions.
The policy requires each Canadian institution to submit an RDM strategy so research funders can assess readiness across institutions. Developing an RDM strategy allows institutions to think through local gaps and develop solutions, and it encourages collaboration with other institutions. The release of the Tri-Agency RDM Policy coincided with the establishment of the Alliance, a national not-for-profit organization whose goal is to harmonize and improve access to digital tools and services for Canadian researchers. A key vision of the Alliance is to build a network of collaborative national RDM services in three areas: advanced research computing, research data management, and research software.
National Collaboration: From Portage Network to the Alliance
Origin and Current Organization
Portage was launched by CARL in 2015 in response to Canada’s Action Plan on Open Government and was a precursor to the Alliance. Portage began as a community-based national network of RDM services and support that leveraged the existing national and regional networks of Canadian academic libraries. It was envisioned by dedicated RDM advocates and leaders (Humphrey, 2012b). The initial concept of the network was discussed during an informal meeting at a CARL conference in 2013.
In 2014, CARL launched a one-year community of practice pilot project, called project ARC. Building on the success of the pilot, a library-based RDM network of experts (NOE) was framed, and operational models and governance were established over the following two years (September 2015–August 2017 ) (Humphrey, Shearer, and Whitehead, 2016). Since then, the NOE has developed and made available numerous RDM-related training resources, guidelines, and templates aligned with the Canadian funders’ requirements to support the research community and help data stewards. The NOE strengthened the connections among existing regional data repository infrastructures that used the Dataverse software, which ultimately led to the formal partnerships and the launch of the national service Borealis Dataverse Repository (Borealis). It also coordinated the development of a Data Management Plan Assistant (DMP Assistant) web-based application, a repository known as the Federated Research Data Repository (FRDR), and Lunaris, a data discovery platform.
After joining the Alliance in April 2021, the Portage NOE community became part of the Alliance RDM team. The future governance and operations of the NOE is currently under discussion. The NOE has grown to over 140 experts from 60 institutions across Canada. It collaborates with a broad range of interested parties and partners locally, nationally, and internationally to develop services and infrastructure so academic researchers can access the support they need for RDM (Humphrey, 2020). At the time of writing, the NOE includes the following nine active groups:
Curation Expert Group (CEG)
Data Management Planning Expert Group (DMPEG)
Data Repositories Expert Group (DREG)
Dataverse North Expert Group (Dataverse North)
Discovery and Metadata Expert Group (DMEG)
Preservation Expert Group (PEG)
Research Intelligence Expert Group (RIEG)
Sensitive Data Expert Group (SDEG)
National Training Expert Group (NTEG)
The efforts of the RDM community of experts have continued to advance through the efforts of the Alliance RDM team to develop shared resources, expertise, and training materials. The outputs and publications of each expert group are openly available on the Alliance website. Below are highlights of the major accomplishments of the community.
Infrastructures, Services, and Tools
Canada’s current network of local and regional collaborations makes it easier and more efficient to foster national data management infrastructure, services, and tools. Data specialists and librarians from Canadian academic institutions and staff from the Alliance RDM have contributed to the development and ongoing support of the RDM infrastructures and tools mentioned in this chapter. For example, the Dataverse North Working Group was formed to bring the Dataverse repository providers and librarians in Canada together to coordinate and discuss local and national training, support services, outreach strategies, promotions, and infrastructure development and needs.
An even bigger, multi-functional data management infrastructure, FRDR, was developed with the Alliance RDM as its service provider and Compute Canada as its hardware and infrastructure host. It also had support from several expert groups, including the DMEG, PEG, and CEG. Today, FRDR provides a wide range of RDM services to Canadian institutions, organizations, and researchers, including data discovery, storage, preservation, and curation. All Canadian researchers are eligible to deposit open data in FRDR and obtain a Digital Object Identifier (DOI) to uniquely identify their dataset and generate a permanent web address. FRDR also has a large data ingest capacity and dedicated curation support.
FRDR originally included functionality to index data from other Canadian data repositories and make their data discoverable. However, in 2022 the decision was made to develop this capability as a separate service, named Lunaris. Lunaris is a bilingual platform that provides a single place to search for data from FRDR and other sources. Lunaris does not host data, it instead provides links to external repositories where users can go to download data.
Preservation of research data is essential to ensure that it remains accessible and usable in the long term. However, Canada still lacks a robust research data preservation plan or strategy. PEG was created to improve Portage’s capability in developing infrastructure and best practices for preserving research data and metadata. This includes working with relevant parnters on software development projects that add platforms and preservation services to the RDM infrastructure in Canada. PEG has been collaborating with other expert groups to increase awareness of preservation issues, liaising with FRDR and Borealis repositories on preservation functionality in repositories, and working with FRDR, SciNet, Scholars Portal, and University of Toronto Libraries on a preservation pipeline project to facilitate researcher access to a robust long-term digital preservation environments.
Initially, the online DMP Assistant tool was hosted and overseen by the University of Alberta, but later responsibility for the tool has moved to the Alliance RDM. The Tri-Agency RDM Policy highlights the importance of Data Management Plans in the research process and defines a DMP as one of three core pillars. Canada’s three federal research funding agencies also announced that a DMP would soon become a requirement and not a recommendation for all Canadian researchers seeking public funding. Before this announcement, the use of DMPs was already a standard requirement for American and European research funding applications. Developed in partnership with the agencies, the DMP Assistant offers step-by-step advice for developing a Data Management Plan. In addition, the NOEs developed several bilingual documents, including guides describing how to:
There are also a number of discipline-specific DMP exemplars and templates highlighting best practices in DMPs for various disciplines within the training resources area of the Alliance website.
Best Practices, Standards, and Guidance
As a national collaborative network of experts, the Alliance RDM fostered a coordinated framework of existing, disperse infrastructure and online tools: DMP Assistant, Scholars Portal Dataverse (rebranded to Borealis, the Canadian Dataverse Repository in 2022), FRDR, and Lunaris. It also developed guidelines and recommendations on best RDM practices in close partnership with the three federal research funding agencies. The guidelines and documentation developed by the Alliance RDM working groups can be found on Zenodo and include:
A Guide to Curating Dataverse Datasets, developed by the Dataverse Curation Guide Working Group. This guide outlines best practices for preparing datasets for publication in the Dataverse repository.
A Dataverse North Metadata Best Practices Guide, developed and continuously updated by the Dataverse North Working Group. This guide provides an overview of metadata best practices and offers examples from various disciplines, including geospatial data.
Appraisal Guidance for the Preservation of Research Data, developed by the Appraisal for Preservation Working Group. The guide addresses the needs of data creators and curators to evaluate and select research data for long term access.
Sensitive Data Toolkit for Researchers, published in 2020 and continuously updated by the SDEG. The 3-part guide includes a glossary of terms related to sensitive data, a data risk matrix, and a sample consent language. We’ve listed and provided a link to each part of the guide in the in following textbox. The guide has been widely adopted by Canadian institutions.
Besides offering RDM infrastructure and best practices, the Alliance RDM aimed to break down social, cultural, and technological barriers associated with an RDM ecosystem (Humphrey 2012b). The Alliance RDM has, in fact, cultivated a variety of networks and communities in recent years.
Members of the Alliance RDM DREG were involved in the development of the DataCite Canada Consortium, which was launched in January 2020 with Alliance RDM as the operating lead, Canadian Research Knowledge Network as the administrative lead, and funding from the Alliance. More than fifty consortium institutions worked together to develop a governance and funding structure and to offer DOI minting services and metadata registration through DataCite to all of their members. The DataCite Canada consortium is a significant achievement for Canadian institutions. It allows us to collaboratively manage the national pool of DOIs for a variety of research repositories and other digital assets while having a stable, shared, and collaborative pricing scenario for various tiers of research institutions in Canada. Also, it allows a community of practice to resolve technical issues and initiate innovative DOI projects within Canada.
To help Canadian research data repositories align their practices with global standards, the DREG adjudicated Alliance RDM funding for a cohort of CoreTrustSeal (CTS) certification applicants. A total of 12 repositories made up the first cohort of applicants, including several Borealis institutional repositories seeking improvement of current practices. CTS certification has a lengthy process before it is successful. For the benefit of applicants, DREG organizes and oversees the writing and reading groups and assists applicants with the peer-review process.
CEG is dedicated to identifying, evaluating, and promoting best practices in curating data. This includes techniques, methods, and tools that can better prepare data and metadata, improve data quality, and ultimately facilitate data dissemination and reuse. It also fills in the need for training and supporting a new generation of data curators. Community building and networking are key aspects of the expert group’s approaches. In 2019, CEG hosted the first Canadian Data Curation Forum, in partnership with McMaster University and with funding from SSHRC. A key goal of this forum was to establish a national community of practice among data stewards, librarians, data service providers, and system developers. The Forum’s program included a variety of keynote talks, discussions, and workshops with the objectives of facilitating communication and collaboration around data curation practices and standards and developing skill and training resources. The Forum was a huge success and achieved its goal of establishing a network of data curators who have met regularly with the CEG since then to discuss and update each other on data curation, current issues, and development.
Research and Training
To keep up with a constantly changing environment, the Alliance RDM built a research intelligence group and a training team to monitor gaps in RDM areas and to provide timely training to the community and its broader groups.
RIEG prioritizes ongoing surveillance of RDM-related topics and mandates. RIEG guides the development of best RDM practices in Canada and informs relevant communities about existing and arising issues in related policies and practices. It maintains an RDM Roadmap of Research Priorities to identify gaps in RDM knowledge, skills, services, and policies. RIEG also conducts independent studies and surveys and analyzes the results to provide evidence-based recommendations to Alliance RDM. In 2016, it established the Canadian RDM Survey Consortium and developed a common survey instrument. Fifteen universities have since used the instrument to survey researchers in their institutions to understand their RDM practices and attitudes. In 2019, RIEG conducted two surveys on Canadian institutions, measuring their RDM capacity and strategy development status, before the Tri-Agency RDM Policy was announced. The survey results provided evidence of existing RDM initiatives and services and voiced the institutions’ priorities and needs for further RDM support areas.
As RDM continues to evolve, it is crucial that researchers, data professionals, and others involved with RDM have the information and training they need to stay up to date with the latest developments and best practices. The development of RDM training resources has been one of the core activities of the Alliance RDM. Since 2017, the Alliance RDM NTEG has developed RDM training material. The NTEG oversees a range of specific projects that collaboratively develop and deliver training and resources to support RDM skill development across Canada. Immediately following the announcement of the Tri-Agency RDM Policy, NTEG coordinated a series of well-attended workshops on the most important aspects of the policy. The workshops helped researchers and others understand the policy requirements and raise awareness of existing tools and resources that could support them in developing DMP and institutional RDM strategies.
Data Repository Services in Canadian Libraries
Just as a network of experts, training, and support has been established nationally, various university libraries have also developed a Canadian data repository service. Most notably, the Dataverse repository has been a key resource. The Dataverse repository is an open sourcesoftware, developed by Harvard’s Institute for Quantitative Social Science, to store, share, cite, preserve, discover, and analyze research data. Its open source nature enables institutions to host their own installations of the Dataverse software and offer a customized solution tailored to their own community needs.
There has been an evolution from local and regional installations of Dataverse software in Canada, including Scholars Portal Dataverse and other institutions and regions, to a national service called Borealis: Scholars Portal Dataverse first began offering the service outside of the Ontario Council of University Libraries in 2019, an official national service was offered in 2020 with agreements with the four regional academic library consortia, and the new brand Borealis was launched in 2022. The shared national installation also provides the opportunity for local branding and for providing shared training resources to users. During this transition, a Dataverse North expert group developed training resources, provided support and outreach, and developed promotion strategies. This is an important factor, as Canadian universities often prefer to store data on locally hosted servers.
In the Dataverse platform, data can be deposited into Dataverse collections that are part of a larger network. A Dataverse collection is a container for datasets (research data, code, documentation, and metadata) and can be set up for an individual researcher, department, journal, or organization. As an example, a researcher can deposit data into their institutional Dataverse collection, which is a part of the larger Borealis repository. Researchers and their collaborators can create their own accounts and deposit their data into an institutional collection (defined by their affiliation) or into research project collections, if available. Librarians and data stewards can also curate data contributions and handle data submissions on behalf of researchers. The Dataverse software is quite flexible in this regard. It is possible to apply institutional or project branding to Dataverse collections and sub-collections.
The Dataverse repository software also provides data analysis functionality in the browser; users do not need to download the data files in order to interact with them. The tabular data files that are uploaded to the system can be analyzed using the integrated web-based data analysis and visualization tool. Dataverse software can also be integrated with other library resources for improved discovery. For instance, since all partners of UBC Abacus Dataverse (libraries at the University of Victoria, University of Northern British Columbia, and Simon Fraser University) use ProQuest Summon as a discovery search engine, the Dataverse collections corresponding to their libraries are accessible through the specific Open Archives Initiative (OAI) protocol feeds. Each OAI feed includes all data from partner institutions and appropriate licensed data for that school. Through improved discovery (especially the assignment of DOIs for research datasets), curated data could be easily accessed and reused by researchers (e.g., in ORCID, Google, DataCite, Google Data Search, Crossref, and other services), thereby enhancing citations and improving research metrics for individuals and institutions.
Dataverse repository software has proven to be a flexible platform that can support many models for library RDM services in Canada. It offers a range of features that may improve data discoverability and access. It also provides excellent data management for preservation. However, Dataverse software is not a fully featured digital preservation system (although the national Borealis repository does support bit-level digital preservation, which is explained in the chapter, “Digital Preservation of Research Data,” and in the Borealis Preservation Plan. The repository is format-agnostic and accepts all types of files, not just tabular data.
The Ontario Council of University Libraries sponsored work by Artefactual to develop a technical integrationbetween the Dataverse software and Archivematica, a robust, open source tool for processing digital objects for preservation and access. This preservation processing tool could be used in conjunction with the established Borealis service or any Dataverse installation (with Archivematica version 1.8+ and Dataverse software version 4.8.6+).
Support for RDM in Canada has been a national focus. Historically and currently, regions and communities have faced issues related to support and infrastructure based on their own networks, regional or provincial funding and participation in consortium decisions by region.
Indigenous Data Sovereignty
Many of the initiatives and developments that we have mentioned in this chapter, and others that will be referenced throughout this textbook, have occurred without considering Indigenous Peoples and their data or redressing historical injustices. In fact, there has been a long history of mistreatment and neglect of Indigenous communities in Canadian research. While the Tri-Agency RDM Policy now explicitly addresses Indigenous data considerations, and Indigenous data experts are also included in the Sensitive Data Expert Group, we encourage the Alliance RDM team to address these issues more comprehensively in the near future.
First ‘Nations advocates and academics have responded to these gaps. For example, the First Nations Information Governance Centre (FNIGC) was incorporated as a nonprofit in 2010 to serve First Nations in data sovereignty, with work encompassing research, training, capacity building, and data collection. Their work dates back to 1996, when the Assembly of First Nations formed a National Steering Committee with the mandate of creating a national First Nations Health Survey (the First Nations Regional Longitudinal Health Survey), following Canada’s decision to exclude the on-reserve population from major longitudinal data collection projects. In 1998, the committee established the principles of OCAP® (standing for ownership, control, access and possession) as a tool and standard for collecting and managing First Nations data. For more on OCAP® see the chapter, “Indigenous Data Sovereignty.”
Regional Efforts
Across Canada, institutions have taken individual approaches on developing and expanding RDM services depending on their size, available resources (human resources and infrastructure), and research focus. College and university librarians and specialists are key members of the institutional RDM working groups and committees. They are involved in developing institutional RDM policies and strategies.
Many institutions across Canada have participated in surveys of RDM practices and needs that were based on a common survey instrument developed by librarians at the University of Toronto in 2015. The survey instrument was subsequently adapted with some modifications by many institutions across the country. This survey led to a richer understanding of disciplinary RDM practices and of local and national RDM needs, and it helped researchers become aware of RDM best practices (Cheung, et al., 2022) .
Courses on RDM have been taught at library schools across Canada. As described earlier, regions have adapted Dataverse repository software locally and, in many cases, nationally. All regions had representation on the Alliance RDM committees. Some schools responded to the need to provide RDM support with the development of RDM librarian positions or library roles. Below we describe regional initiatives highlighting unique services and areas of focus.
RDM in the Atlantic region
CAAL/CBPA (the Council of Atlantic Academic Libraries/Conseil des bibliothèques postsecondaires de l’Atlantique, formerly CAUL-CBUA) is the network of public university and college libraries in the Atlantic region. CAAL/CBPA has focused on building and coordinating digital preservation activities in the region. The Digital Preservation and Stewardship Committee (DPSC) was formed in 2013. It later expanded its work on building and developing RDM services on a broad scale to align its work with the national vision. The most recent initiative involves the 2020 CAAL/CBPA Innovation Grant that enables a series of RDM workshops to be delivered and streamed across Atlantic institutions, with DPSC members taking the lead in organizing and conducting the workshops. The events are called Atlantic RDM days, and they are conducted in English and French. These workshops are important to colleges and universities that do not have the resources to support RDM at the institutional level but must still comply with the Tri-Agency RDM Policy and promote RDM best practices within their research community.
In 2015, Dalhousie University was one of the first Atlantic research institutions to start building an RDM team, which included many partners across the institution (Office of Research Services, Academic Technology Services, and Dalhousie University Libraries). Dalhousie University was one of the first Canadian institutions to develop and publish an RDM strategy, as required by the Tri-Agency RDM Policy. Dalhousie University now offers an RDM course entitled “Managing Research Data.”
Several Atlantic research institutions have joined the national Borealis repository to provide data archiving services to their local research community. Others have agreed to maintain their own instances of the Dataverse repository installed on local institutional servers. This is due to the availability of local institutional resources to maintain and keep the repository up to date. For instance, since 2018, UNB Libraries at the University of New Brunswick have hosted a local Dataverse repository. This institutional data repository is hosted and maintained independently by the UNB Libraries through the collaborative work of the Library Systems team and the Libraries’ RDM Services Committee. Like other Canadian institutions, all research universities in the Atlantic region have access to the national data archiving infrastructure, FRDR, available through the Alliance’s website.
RDM in Quebec
Since the 1960s, academic libraries in Quebec have collaborated under le Bureau de la Coopération Interuniversitaire (BCI), formerly known as la Conférence des Recteurs et des Principaux des Universités du Québec (CREPUQ). In 1967, le Comité de coordination des bibliothèques was created. A few years later, it became le Sous-comité des bibliothèques (Roy et Bégin, 1969).
Dataverse internationalization took place in two phases: the first phase began in 2015, and the second phase began a few years later (Bilodeau, 2018). Marie-Hélène Vézina, a senior librarian from l’Université de Montréal with experience in digital project development, teamed with Scholars Portal staff, with support from the broader Dataverse community, including Harvard’s Institute for Quantitative Social Science, to internationalize Dataverse software. Although some translation work had been done in the past, nothing had been done to support multilingualism. The developed code became part of the central Dataverse software codebase, which allowed a bilingual (French and English) installation to be deployed by Scholars Portal. L’Université de Montréal contributed the French translation. The Scholars Portal and BCI institutions finalized and signed a formal agreement in spring 2019, and the first institutional Dataverse collections from BCI institutions were made available to researchers in summer 2022 (Vézina, 2022).
At l’Université de Montréal, the first dedicated RDM librarian position was established. Soon after, a second RDM librarian position was opened at l’Université Laval. McGill University set up an RDM research support position, and three smaller institutions shared an RDM research support position, namely l’Institut national de la recherche scientifique (INRS), l’École nationale d’administration publique (ENAP), and la Telé-université, Université du Québec (TÉLUQ).
Other institutions have allocated part-time resources to RDM. Institutional Dataverse collections are being launched in Borealis. The focus will likely be on keeping pace with growing needs in the years to come.
RDM in Ontario
In Ontario, there are 23 public universities and 24 colleges. Since the 1960s, the libraries at these universities have been successfully collaborating through the Ontario Council of University Libraries (OCUL). In its early years, OCUL was involved in traditional library services, such as consortial licensing of journals and facilitating effective resource sharing. In those early years, several institutions developed their own data repository systems, including Carleton University’s Social Science Data Archive, founded in 1965 in the Sociology and Anthropology Department; Western University’s Data Resources Library, launched in the late 1970s, which worked with the Social Science Computing Laboratory to disseminate and archive several faculty research projects; and the University of Toronto’s Map and Data Library, established in 1988, with services that included the acquisition and preservation of datasets produced by the University of Toronto researchers.
In 2002, OCUL formed Scholars Portal, a shared technology infrastructure that hosts and provides access to OCUL’s growing digital collections. As data services came to greater prominence, Ontario libraries saw an opportunity to collaborate under the OCUL umbrella in order to improve services, reduce duplication of effort, and better manage limited resources. Over the last decade, OCUL has undertaken several successful data infrastructure projects, including the development of the collaborative <odesi>, a social science data portal, and Scholars GeoPortal, a geospatial data portal. While both of these data portals do contain some research data, they are intended as curated collections of published datasets from authoritative sources, such as government statistical agencies. As such, they are not conducive to the widespread inclusion of member libraries’ institutional research data outputs. These systems are primarily focused on discovery and access rather than long-term data preservation (Moon, 2014).
For this reason, other solutions were needed in Ontario as well as in Canada to address the growing demand for library research data repositories. In 2011, Scholars Portal joined the UBC Library pilot and installed a Dataverse repository, an open source software and offered it to the OCUL community as a pilot program. The pilot was intended to address a community-identified need for an Ontario-based repository service that would allow for easy-to-use, web-based self-deposit by researchers. Dataverse software was chosen for the pilot due to its support for research data, including the Data Documentation Initiative (DDI) built-in metadata. Scholars Portal staff developed documentation and training materials to inform and train staff at OCUL libraries about the benefits of incorporating Dataverse software into the suite of services offered for data management and deposit of research data. As a result, the Scholars Portal Dataverse repository, now branded Borealis, has allowed some OCUL libraries to launch RDM services without needing to have the technical infrastructure and staffing to support repositories of their own. Models for the service vary from library to library, ranging from self-serve deposit to library-mediated curation. Today, the service has grown dramatically. Many more institutions across Canada have joined or migrated their research data content to Borealis, making it a national hub for research data archiving. The support for the use of Borealis is largely provided by local library staff and is independent of the infrastructure hosted and supported by Scholars Portal.
The OCUL data community, which was initially formed to address data access for Statistics Canada DLI data, has evolved into a forum for support of RDM. Experts from Ontario academic institutions have been key members of the Alliance RDM community and working groups.
RDM in the Prairie Provinces
Institutions in the Prairie provinces have been very influential in the national RDM collaborations over the last decade. In early 2015, the University of Alberta Libraries implemented the first Canadian instance of an open source online tool to help researchers write DMPs. A UK-based DMPOnline code was used at that time, and UBC and the University of Alberta were the first Canadian institutions to adapt the Canadian version.
Almost immediately, the project was adapted by other Canadian institutions within the CARL Portage framework and was branded as DMP Builder. Later in the tool’s lifecycle, it was rebranded again and became DMP Assistant, which included English and French options to better serve the francophone academic community. Over 50 Canadian institutions now use DMP Assistant with custom institutionally specific guidelines developed by the Alliance RDM NOE. It has been almost a decade since the University of Alberta Libraries sponsored DMP Assistant for the Canadian RDM community, who greatly appreciate their work.
Since late 2015, the University of Saskatchewan (USask) Research Computing has been implementing a similar initiative in partnership with the Office of the Vice-President Research. As a result of Compute Canada’s seed funding, the USask team was chosen to create a national data discovery interface for research data in Canada. The USask-based team is still chiefly responsible for the software development and operation of the Lunaris platform, now under the Alliance umbrella. They adapted the open source code base from the UBC Library Open Collections as their main discovery interface back in 2016 and the Geodisy open source code base, also developed by the UBC Library, as their map-based data discovery interface. Using the open source Archivematica software, the USask-based team has also developed an excellent collaboration with the Globus Connect platform to work with big data and preserve research data digitally at scale.
RDM in British Columbia
British Columbia institutions have long been engaged with RDM, with the University of British Columbia (UBC), Simon Fraser University (SFU), and the University of Victoria (UVic) taking the lead in this work. The UBC Library is one of the largest university libraries in Canada and has been conducting ad hoc RDM activities since the early 1970s. In 2008, to help smaller regional schools, UBC entered into an arrangement to make the Abacus data repository available to other universities in the province. At the time of writing, four major university research libraries in British Columbia (Simon Fraser University, University of Victoria, University of Northern British Columbia, and the University of British Columbia) are using the UBC instance of the Dataverse repository as a licensed data repository.
Data is provided to users from each institution according to their data licenses using the Canadian Access Federation, an organization that manages digital identities in higher education and research through a trust framework for access control. The UBC Library data team provides basic and advanced training on the Dataverse repository to groups, departments, and labs on the UBC campus and to its partners in other university libraries and research institutions. After the training, these groups should be managing their own data within the appropriate Dataverse assigned to them. UBC Library School (now known as iSchool) was also one of the earliest Canadian institutions to offer a Research Data Management graduate course.
The SFU and UVic Libraries have also contributed greatly to the RDM landscape in Canada. Early in the 2010s, the SFU Library developed Radar, its own Islandora-based research data repository (now depreciated and replaced by FRDR), and it became the Canadian leader on zero-knowledge encryption of sensitive data. The UVic Libraries have also successfully experimented with RDM services and have accommodated unique license needs for research teams, such as, for example, the well-used Canada Health Infoway datasets.
RDM in Northern Canada
Northern Canada consists of three territories: the Northwest Territories, Nunavut, and Yukon. The two research institutions located in Northern Canada are Yukon University and Aurora College. As part of the institutional RDM strategy (mandated by the Tri-Agency RDM Policy), Yukon University librarians and the Research Services Office work together to build an institutional repository hosted by BC ELN Arca – a collaborative initiative for digital repositories in BC based on Islandora software, primarily aimed at smaller institutions and colleges. Research outputs deposited by Yukon University researchers into BC ELN Arca will be harvested by Lunaris.
In October 2022, librarians from Aurora College in Inuvik participated in an institutional strategy panel organized by the Alliance. They shared their unique experience addressing RDM issues at the small-size Northern institution. Some institutions from Northern Canada, including Yukon University, work together with universities and colleges from British Columbia to develop their institutional RDM strategies in line with the Tri-Agency RDM Policy. They collaborate as an ad hoc group to create action plans and share visions for RDM services in small institutions.
Conclusion
It is an exciting time for RDM in Canada, and it took years of dedicated work and sophisticated, multi-provincial collaboration to get to this point. Libraries are seeing new opportunities to engage with their communities and with one another. With these new opportunities inevitably come challenges, such as costly digital infrastructure that must be managed on an ongoing basis. We believe that Portage and the formation of the Alliance have the greatest potential to meet some significant unmet needs, but they will need sustainable funding in order to be successful.
The development of open source tools, infrastructure, and support services for RDM is crucial if Canadian scholars are to successfully integrate these new activities into their workflows. Academic libraries have a history of supporting data access, dissemination, and preservation, and they have an established mandate to participate in the preservation of the research outputs of their community (e.g., in institutional repositories). Libraries can provide leadership in the adoption of best practices and open standards. They can also partner with other groups in the development of infrastructure and tools. The Canadian library community has been actively encouraging research data sharing since the 1960s and is well-positioned to play a leadership role going forward.
Reflective Questions
What new knowledge have you gained about the Canadian data community?
How do you think the Canadian academic library data community compares to other areas of academic librarianship?
Given the current international open science movement, what challenges do you see in research data management today?
Which parties or organizations are best positioned to provide RDM support to Canadian researchers?
Key Takeaways
The development of data services, awareness, infrastructures, tools, and RDM culture in general has evolved over several decades locally, regionally, and nationally.
Data librarians, data specialists, library consortia, government funding agencies, and governance bodies play key roles in identifying needs and developing services in RDM.
To promote best data management practices in support of RDM services, government, institutions, service providers, and the research community need to continue to partner at every stage of the research lifecycle.
A number of tools and technical infrastructures are available to support RDM, and these will evolve to support ongoing and new needs.
Acknowledgement
The initial draft of the RDM in Quebec section was contributed by Ève Paquette-Bigras, academic librarian at the Université de Montréal. The authors are grateful to Ève for providing the background and context for the RDM achievements in that province.
Read, K., McDonald, G., Mackay, B., & Barsky, E. (2014). A commitment to First Nations data governance: A primer for health librarians. Journal of the Canadian Health Libraries Association / Journal de l’Association des bibliothèques de la santé du Canada, 35(1), 11–15. https://doi.org/10.5596/c14-003
Wilkinson, M. D., Dumontier, M., Aalbersberg, Ij. J., Appleton, G., Axton, M., Baak, A., Blomberg, N., Boiten, J-. W., da Silva Santos, L. B., Bourne, P. E., Bouwman, J., Brookes, A. J., Clark, T., Crosas, M., Dillo, I., Dumon, O., Edmunds, S., Evelo, C. T., Finkers, R., … Mons, B. (2016). Comment: The FAIR guiding principles for scientific data management and stewardship. Scientific Data, 3, 1–9. https://doi.org/10.1038/sdata.2016.18
Reference List
Attendees of the NDSF Summit. (2019). Kanata declaration (Version 2.0). National Data Services Framework Summit 2019 (NDSF 2019), Ottawa, Canada. Zenodo. https://doi.org/10.5281/zenodo.3234815
Barsky, E., Laliberté L., Leahey, A., and Trimble, L. (2017). Collaborative research data curation services: A view from Canada. In L.R. Johnston (Ed.), Curating research data, volume one: Practical strategies for your digital repository. Association of College and Research Libraries. https://dx.doi.org/10.14288/1.0340778
Cheung, M., Cooper, A., Dearborn, D., Hill, E., Johnson, E., Mitchell, M., & Thompson, K. (2022). Practices before policy: Research data management behaviours in Canada. Partnership: The Canadian Journal of Library and Information Practice and Research, 17(1), 1-80. https://doi.org/10.21083/partnership.v17i1.6779
Cooper, A., Steeleworthy, M., Paquette-Bigras, È., Clary, E., MacPherson, E., Gillis, L., Wilson, L., & Brodeur, J. (2021). Dataverse curation guide. Zenodo. https://doi.org/10.5281/zenodo.5579820
Gray, S. V., & Hill, E. (2016). The academic data librarian profession in Canada: History and future directions. Western Libraries Publications. Paper 49. http://ir.lib.uwo.ca/wlpub/49
Hackett, Y. (2001). A national research data management strategy for Canada: The work of the National Data Archive Consultation Working Group. IASSIST Quarterly, 25(3), 13-16. https://doi.org/10.29173/iq91
Heidorn, P. B. (2008). Shedding light on the dark data in the long tail of science. Library Trends, 57(2), 280–299. https://doi.org/10.1353/lib.0.0036
Humphrey, C. (2005). Collaborative training in statistical and data library services: Lessons from the Canadian data liberation initiative. Resource Sharing and Information Networks, 18(1–2), 167–181. https://doi.org/10.1300/J121v18n01_13
Humphrey, C. (2020). The CARL Portage partnership story. Partnership: The Canadian Journal of Library and Information Practice and Research, 15(1), 1–7. https://doi.org/10.21083/partnership.v15i1.5825
Humphrey, C., Shearer, K., & Whitehead, M. (2016). Towards a collaborative national research data management network. International Journal of Digital Curation, 11(1), 195–207. https://doi.org/10.2218/ijdc.v11i1.411
Moon, J. (2014). Developing a research data management service – a case study. Partnership: The Canadian Journal of Library and Information Practice and Research, 9(1), 1–14. https://doi.org/10.21083/partnership.v9i1.2988
Roy, J. et Bégin, J.-O. (1969). Enquête relative à un plan de coordination. Montréal : Comité de coordination des bibliothèques de la CREPUQ.
Steeleworthy, M. (2014). Research data management and the Canadian academic library: An organizational consideration of data management and data stewardship. Partnership: The Canadian Journal of Library and Information Practice and Research, 9(1), 1–11. https://doi.org/10.21083/partnership.v9i1.2990
Vézina, M.-H. (2022). Métadonnées bibliographiques des thèses et mémoires du dépôt institutionnel de l’Université de Montréal [Canada] [dataset]. Borealis. https://doi.org/10.5683/SP3/SJJACL
About the authors
Eugene Barsky
Eugene Barsky is the Research Data Librarian at the University of British Columbia. Eugene works with the UBC researchers curating and managing research data, from planning to deposit to preservation. Eugene participates in building the Canadian Federated Research Data Repository service (FRDR), and he collaborates with Digital Research Alliance of Canada (the Alliance) and the European Union (OpenAIRE). He is the PI for the national Geodisy project funded by the Alliance. His recent peer-recognition includes the Canadian Association of Research Libraries, American Society for Engineering Education, and Special Library Association awards. He had published more than 30 peer-reviewed papers and presented at more than 70 conferences. Eugene is an adjunct professor at the iSchool at UBC where he teaches research data management, and is one of the founders of the Portage Network of Experts in Canada. Email: eugene.barsky@ubc.ca | ORCID: 0000-0002-5119-2271
Elizabeth Hill
Elizabeth Hill is the Data Librarian at Western University in London Ontario. She provides access and data literacy instruction to data sources at Western. She has an external advisor role with Statistics Canada. Elizabeth is active in various data communities and working groups in participant and leadership roles. Her research interests include supporting researchers, and she has published on topics related to data delivery systems and data librarianship in Canada. ORCID: 0000-0002-9715-238X
Tatiana Zaraiskaya
Tatiana Zaraiskaya is a STEM Librarian at the University of New Brunswick Libraries, where she is also responsible for RDM. Tatiana has been a member of the RIEG Portage Network (The Alliance) team since 2016, has participated in several surveys by RIEG, and was one of the leaders of the RDM Survey of Queen’s University and the UNB. She is a co-author of multiple conferences and other scholarly publications related to RDM and an author of the DMP Portage template. Tatiana holds a PhD in Biophysics from the University of Guelph and an MLIS from Western Ontario University. Email: t.zaraiskaya@unb.ca | Google Scholar: https://scholar.google.com/citations?user=BB6c8XQAAAAJ&hl=en | ORCID: 0000-0001-9294-6052
Minglu Wang
Minglu Wang is a Research Data Management (RDM) Librarian at York University. She has published book chapters, conference/working papers, and research articles closely related to academic libraries and RDM services. Minglu Wang is an active member of the Association of College & Research Libraries (ACRL), a division of the American Library Association (ALA), and she contributed to multiple years of the Association’s publications of Top Trends articles and Environmental Scan white papers. She is a member of the Research Intelligence Expert Group, a part of The Digital Research Alliance of Canada (The Alliance) RDM Team, and has participated in the design and report writing of the RDM Capacity Survey of Canadian Institutions. Email: mingluwa@yorku.ca | ORCID: 0000-0002-0021-5605
Lucia Costanzo
Lucia Costanzo is the Research Data Management (RDM) Librarian at the University of Guelph. She recently completed a secondment at the Digital Research Alliance of Canada (the Alliance) as the Research Intelligence and Assessment Coordinator. As part of this role, Lucia coordinated the activities of the Research Intelligence Expert Group, which included informing and advising the Alliance RDM Team and Alliance management on emerging developments and directions, both nationally and internationally, in RDM and broader Digital Research Infrastructure ecosystems. Before the secondment, Lucia actively supported, enabled, and contributed to the learning and research process on campus for over twenty years at the University of Guelph. Email: lcostanz@uoguelph.ca | ORCID: 0000-0003-4785-660X
Research Data Sharing and Reuse in Canada: Practice and Policy
5
Meghan Goodchild; Shahira Khair; Amber Leahey; Kaitlin Newson; and Lee Wilson
Learning Outcomes
By the end of this chapter you should be able to:
Understand practices, policies, and services guiding research data sharing and reuse in Canada.
Identify elements of Canadian digital research infrastructure, including data storage options like data repositories and long-term preservation platforms, as well as services that support access and use of these infrastructures.
Using case studies, identify supports and barriers to data sharing and reuse throughout the research data lifecycle, along with areas in need of future development.
Introduction
Canadian researchers from all disciplines and sectors are producing unprecedented amounts of data (Baker et al., 2019). With the advancement of open science and open data policies from journal publishers, research funders, disciplinary groups, and institutions, researchers are becoming more acutely aware of the need to manage their data in accordance with related policies on data deposit and sharing. These policies support broader goals around research transparency, reproducibility, and reuse (the Alliance Research Data Management Working Group [Alliance RDM WG], 2020). (See chapter 12, “Planning for Open Science Workflows,” for an overview of open science and open data.)
A major value proposition for data sharing and reuse is the acceleration of scientific progress and prevention of unnecessary expensive data collection. Data sharing also enables research results to be reproduced, which can improve the integrity and trustworthiness of published findings. When a researcher’s data is easy to discover and access, this increases the visibility and impact of their research. Additionally, sharing data, research environments, and tools enables and enhances collaboration, leading to greater interoperability and research efficiencies.
In order to maximize the benefits of data sharing and reuse, research data outputs should be guided by the FAIR principlesof Findability, Accessibility, Interoperability, and Reusability, discussed in chapter 2,(Wilkinson et al., 2016), and supported by a foundation of a TRUST-ed (Transparency, Responsibility, User focus, Sustainability and Technology) digital research infrastructure and support services (Lin et al., 2020). Therefore, data sharing is an integral component of conducting high-quality research, requiring ongoing Research Data Management (RDM) practices. RDM services in Canada are emerging across disciplines, institutionally, and at the regional and national levels to support researchers in data sharing and reuse.
In this chapter, you’ll learn about policies and practices, digital research infrastructure, and tools and services for research data sharing and reuse in Canada. We’ll review policies and practices, Canadian infrastructure, tools, and services that support the research data lifecycle; and support services around data curation and preservation. Then we’ll consider case studies that highlight data sharing and reuse practices and highlight disciplinary challenges.
Policies and Practices in Canada
Research Funding Agencies
Funding agencies and governments around the world have recognized the need for national RDM policies to support access to publicly funded data. Funding agency mandates that require data sharing influence researcher behaviour and the demand for RDM infrastructure and services (the Alliance RDM WG, 2020). The Canadian Tri-Agency RDM Policy (2021) is driving a culture change for data deposit and sharing, as it outlines requirements for researchers to “deposit into a digital repository all research data, metadata and code that directly support the research conclusions in journal publications and pre-prints that arise from agency-supported research” (Government of Canada, 2021), implementation forthcoming. Grant recipients are expected to provide access to their data in accordance with the FAIR principles and disciplinary standards while respecting ethical, cultural, legal, and commercial requirements. Indigenous data sovereignty (discussed in depth in chapter 3) recognizes the inherent rights of Indigenous communities to govern the collection, ownership, and use of their data and may result in distinct practices regarding the sharing of research data.
Funder Policies
Local and Regional
Canadian research institutions may set their own requirements for data management and sharing, according to internal policies governing research practices and intellectual property. They must also publicly post a strategy indicating how RDM practices will be supported (Government of Canada, 2022).
Grant applicants must include a Data Management Plan for certain funding applications (phased implementation beginning in spring 2022)
Grant recipients should deposit into a digital repository all research data, metadata, and code that directly support the research conclusions in journal publications and pre-prints that arise from agency-supported research. Deposit will be expected at the time of publication (implementation forthcoming).
Although sharing data is not required, the Agencies expect researchers to provide appropriate access to the data where ethical, cultural, legal, and commercial requirements allow and in accordance with the FAIR principles and the standards of their disciplines. Whenever possible, these data, metadata, and code should be linked to the publication with a persistent identifier (PID).
Data should be collected and stored using software and formats that ensure secure storage, preservation of, and access to the data beyond the duration of the research project.
Researchers funded by the Canadian Institute of Health Research (CIHR) should deposit specific types of data (e.g., bioinformatics) into an appropriate public database.
Research data must be preserved and made available for use within two years of project completion (Government of Canada, 2016).
International
Many public research funders in other countries that support Canadian research require researchers to share underlying datasets of published research, including:
U.S. funders including National Institutes of Health (NIH) and National Science Foundation (NSF)
Journal publishers have also been driving the adoption of RDM practices. When they require a data availability statement, research data is more likely to be shared online. When policies are less stringent, such as recommending data archiving, there’s only a slight increase in archiving rates over having no policy (Vines et al., 2013). Data sharing and availability differ by discipline. For example, the fields of biological science, earth science, medical science, and physical science have a higher rate of data sharing (Stuart et al., 2018), whereas data were less readily available in materials for energy and catalysis, psychology, optics and photonics, and forestry (Tedersoo et al., 2021).
Over the past 20 years, data sharing rates have improved (Tedersoo et al., 2021), but studies show that results are not always fully reproducible from shared data, often because of inadequate documentation and metadata (Rieseberg et al., 2021). There have been increasing efforts to mitigate this issue. For example, the Journal of Molecular Ecology encourages authors to use the open access database GEOME to establish permanent links between genetic data and geographic and ecological metadata to make the data deposited FAIR (Rieseberg et al., 2021). The Public Library of Science (2022) announced an “Accessible Data” pilot feature for certain articles to emphasize links to datasets in specific repositories, in order to increase sharing and discovery of research data and to highlight the benefits of open science models. The American Journal of Political Science, in partnership with the Odum Institute for Research in Social Science, provides data curation and verification services to ensure that datasets reproduce the results of corresponding articles (Jacoby et al., 2017). Therefore, policies alone are not sufficient but may require technical and discipline-specific solutions to ensure that the data shared can be accessible and reusable.
Infrastructure, Tools, and Services
A range of infrastructures are necessary to support the production, sharing, and reuse of data over its lifecycle. These work together to make data FAIR beyond the timespan of a research project.
There are three types of research data storage: active, repository, and archival. Figure 1 outlines active storage during the research phase, repository storage during the access and publishing phase, and archival storage during the preservation phase, which requires additional processing to support long-term accessibility.
Table 1 details active, repository, and archival storage and provides examples used in Canada. Table 2 outlines different research infrastructures that facilitate sharing, reuse, and access.
Table 1: Types of research data storage.
Type
Attributes
Examples
Active Storage
supports data that need to change or be acted on frequently, from constant (every second) to periodic (every week)
computing and analysis storage (e.g., regional and national high-performance computing)
institutional enterprise and personal storage (e.g., hard drives)
commercial cloud storage (e.g., Microsoft Azure, OneDrive, Google Cloud, Amazon Web Services)
supports stewardship and maintenance of data and metadata or other objects, including code, that represent the authoritative copy in the scholarly record
main functions include ingestion, curation, retention, and access (the Alliance RDM WG, 2020)
access typically mediated by software platforms, including portals or research gateways
supports long-term preservation; may not be the primary access point for reusability but can be relied upon for access and reuse
regional library associations may offer this infrastructure to member institutions
institutional archival storage
storage used by academic library services (e.g., Ontario Council of University Libraries’ (OCUL) Ontario Library Research Cloud (OLRC), offered nationally; and the Council of Prairie and Pacific University Libraries’ (COPPUL) WestVault)
Table 2: Research data infrastructures in Canada.
Type
Attributes
Examples
Multi-Disciplinary Repositories
use of disciplinary repositories encouraged when available.
when not available, may use institutional or generalist repositories that can accommodate multiple file types and use cases
focus on specific types of data (e.g., genomics) and may use specialized standards
may act as a knowledge base, providing curation, extraction, organization, annotation, and linking to bodies of literature or data
may be project-specific portals to collect and share research data for knowledge exchange and mobilization purposes; may include links to repositories or alternative storage options
support long-term care and preservation of digital objects of research value
use specialized software to prepare research data for long-term integrity checking preservation using techniques such as file normalization, integrity checking, and data packaging
open protocol and exchange standards (e.g., OAI-PMH, SWORD)
Canadian Data Repositories
Data repositories are key to research infrastructure in Canada. National and institutional data repositories are emerging to support researchers with deposit, sharing, and long-term preservation of data to provide open, equitable, and connected RDM services, circumventing expanding commercial interests and reducing reliance on customized solutions, such as research project websites that often require maintenance and resources for the long term. Through federal, provincial, and institutional funding, Canadian repositories are available to researchers at no additional cost and may have a longer lifespan than the research project. Table 3 outlines types of data repositories in Canada, many of which can be discovered through global registries such as the Registry of Research Data Repositories (re3data), FAIRSharing, and OpenDOAR.
Table 3: Data repositories in Canada.
Type
Attributes
Examples
Multi-Disciplinary Repositories
support data across disciplines
may provide curation services
may aggregate data across datasets
institutional (e.g., UNB Dataverse, University of Prince Edward Island’s Data Repository)
To produce datasets with a high potential for reuse, researchers must use good curation practices as data are cleaned, documented, interrelated, stored, and shared. A range of services provide support for researchers in developing these RDM practices and are detailed in Table 4.
The 2021 Researcher Needs Assessment survey conducted by the Digital Research Alliance of Canada (the Alliance) found researchers have varying levels of access to and awareness of support for research workflows, at local, provincial, and national levels, with the greatest access at the local level (Pérez-Jvostov et al., 2021).
Internal supports: The first point of support for many researchers is internal to their own research groups. For instance, many research groups employ data managers to support team members with data management and publication. Researchers usually discover and select tools and services based on peer reference (Pérez-Jvostov et al., 2021).
Higher education institutions: These provide formal services and support through offices of research, academic libraries, and research computing services (Pérez-Jvostov et al., 2021). The Tri-Agency’s requirement for institutional RDM strategies will help to coalesce cross-campus support.
Shared support models: These can improve efficiency while meeting the demands of researchers and increasing access and equity. They are often coordinated by regional or national consortia. Case Study 1 is an example of a national community of practice as a support network for institutional repository administrators.
Disciplinary services and supports: These serve the needs of specific research communities and are often advanced nationally and internationally through research organizations and publishers. They are vital for the adoption of standard practices and tools in related disciplines since they are tailored to specific research workflows.
Table 4: Support services in Canada.
Category
Services
Data Management Planning (DMP)
The Alliance supports the infrastructure and oversees the development of the DMP Assistant tool.
Academic libraries and offices of research work together to support local researchers in developing DMPs in compliance with the Tri-Agency’s RDM Policy.
Data Discovery and Access
Academic libraries support data discovery and access through reference services and database licensing. Some of these services are shared among institutions (e.g., Odesi, Abacus Dataverse repository).
National and provincial organizations enable access and use of population data for research. Due to the sensitive subject matter, support often requires entering into an agreement with the service provider (e.g., CRDCN and StatCan Data Centres, ICES, Population Data BC).
The Alliance supports a national discovery service Lunaris to increase exposure to Canadian data repositories and datasets. Exploratory work supports access to common datasets on high-performance computing infrastructures (e.g., bioinformatics datasets).
Computing and Storage
Local research computing and IT departments may offer services to researchers to support data management computing and active storage infrastructure.
Increasing support for data management on active storage is important for the Alliance and its national federation of partners, and researchers can receive support through the Alliance’s national help desk.
Data Curation and Publication
A range of workflows and related guidance have been developed to assist curators, including:
To support open publishing, academic libraries provide curation support to researchers depositing data and other scholarly objects to institutional repositories or other digital asset management systems.
Borealis enables local services through a distributed support model, where infrastructure is centrally hosted, but researchers receive support for curation from a local administrator (see Case Study 1 below).
The Alliance provides curation support to researchers using the nationally accessible FRDR. They also support researchers in developing and deploying research gateways on advanced research computing infrastructure.
Other repositories act as trusted resources for stewarding research data and provide services supporting their platforms (e.g., Canadian Astronomy Data Centre, Ocean Networks Canada, Polar Data Catalogue).
Commercial publishers, including Springer Nature and Elsevier, offer services supporting dataset curation and publication. Others have partnerships with third-party repositories to support authors in publishing datasets underlying their publications (e.g., the partnership between Wiley and Dryad).
Training
Researchers receive training from services developed within their disciplinary communities and institutions (Pérez-Jvostov et al., 2021), often led by peer researchers and support specialists who act as “data stewards” who develop activities that advance awareness, understanding, development, and adoption of RDM tools, best practices, and resources. Key events in Canada include:
workshops and summer bootcamps
Train the Trainer courses and resources
online training modules
Emerging Service Areas
Services supporting data sharing and reuse in Canada are developing in response to the needs of researchers related to RDM. Emerging service areas include support for the following:
Case Study 1: Developing a National Dataverse Repository Service and Community in Canada
Background
The Dataverse Project is open-source research data repository software that allows users to share, cite, explore, and analyze research data. It is developed at the Institute for Quantitative Social Science at Harvard University, with collaborators from all over the world. Borealis, the Canadian Dataverse Repository, is based on Dataverse software and began as a regional research data repository for the Ontario Council of University Libraries, growing over the past ten years into a national, bilingual service with over 60 institutions subscribing. The infrastructure is hosted at the University of Toronto, with data files stored securely on the Ontario Library Research Cloud. Borealis offers one repository option for researchers who may not have a disciplinary repository available to them and who may benefit from the flexible data sharing features (e.g., open to restricted), exploration tools in the browser, and preservation-friendly actions and storage.
Analysis
Although Borealis is centrally hosted, academic libraries and institutions manage their collections, thereby supporting local researchers in depositing and sharing datasets. Since local capacity varies across institutions and regions (Goddard et al., 2018), cultivating a community of practice is crucial for capacity building across institutions and for collaborative development of resources and training materials to support researchers. Alongside efforts to develop technical infrastructure, the Borealis team has been collaborating with the Alliance’s Dataverse North Expert Groupon community-building initiatives, including creating bilingual resources, developing outreach and training materials for admins and users, hosting monthly community meetings, and maintaining an email list to openly share knowledge, expertise, and researcher needs (Goodchild & Huck, 2022).
Discussion
Creating spaces and supports for the community to flourish is essential for the viability of Borealis. Feedback provides insight to set priorities for technical and service developments, and community involvement in the development of user guides, admin guides, and other projects ensures that resources meet the needs of the research community. The overall goal of the community — to encourage successful sharing and reuse of research data — aligns with national efforts to strengthen digital research infrastructure and the RDM community in Canada (the Alliance RDM WG, 2020).
Considerations for Data Sharing
Data sharing requires planning. At the project outset, as part of a Data Management Plan, researchers must consider software and tools needed to collect, analyze, and document data; appropriate storage and backup procedures; how data will be deposited and (if possible) shared; and how they will manage data to ensure ethical and legal requirements are met.
Disciplinary differences, including attitude and culture, can influence data sharing and reuse. Certain research fields have traditions of data sharing and reuse and have adopted standards and tools to support this work. Especially within the humanities, where outputs do not always fit within traditional definitions for research data, researchers may consider different approaches to encourage sharing. Services and tools are often developed with disciplinary needs in mind and may be difficult to adopt or repurpose for other disciplines or contexts. Although general tools and services can help, they often lack disciplinary context that would make reuse and adoption possible. Other disciplinary considerations include the following:
file formats (open vs. proprietary, standard tools and software within the discipline)
metadata standards for documentation and dataset discovery
active data storage, data transfer tools, and repository storage to support disciplinary needs (e.g., big data, sensitive data)
repository selection based on features and user community
availability of data curation support:
data quality review
data documentation for reuse
data transformation (e.g., cleanup, anonymization, de-identification)
terms of access and licensing for reuse
data exploration and visualization tools
the benefits of sharing different types of data
The following case studies examine research projects or disciplinary considerations in the fields of digital humanities (Case Study 2), health sciences (Case Study 3), and natural sciences (Case Study 4), highlighting issues faced by researchers and exploring solutions and lessons learned.
Case Study 2: Digital Humanities
Background
Queen’s University Library hosts the Diniacopoulos Collection Virtual Exhibit, the culmination of a research project that presents virtual reality movies and scaled 3D models of Greek and Egyptian archaeological artifacts from the Classics Department collection. The virtual exhibit is built in WordPress using Object2VR software to create an interactive experience for users to rotate and examine objects in virtual 3D in the browser.
Analysis
Researchers wanted to share and preserve the data from this project for future use as the field of virtual reality continues to grow. Web-based viewers and content management systems require ongoing maintenance of software and tools with an unknown lifespan, revealing considerations around sustainability and long-term access. Challenges were encountered in selecting a repository, given the size of the dataset (60 GB), the large number of files (6500+), and the complex folder structure, and that there are few options and best practices for this field. Additionally, including documentation and disciplinary metadata was crucial to ensure that the data could be reused and understood outside of the original context.
Discussion
The research team deposited the dataset into the Queen’s Dataverse Collection (Jones, Bevan, & Monette, 2017), part of Borealis, to benefit from the support of the Queen’s University Library, as well as features such as comprehensive metadata fields and the ability to assign a Digital Object Identifier (DOI) that could be linked from the virtual exhibit. The Borealis team supported the deposit of large zip archive folders for each artefact. Debate continues around the understanding of research data in the humanities, and further investigation is needed through dataset metrics and citations to determine whether there are challenges around the reuse of this contextual data and whether improved tools and platforms would better manage, share, and preserve these types of digital humanities projects.
Case Study 3: Sharing Sensitive Data
Background
Sensitive data refers to any data that may cause harm if made public. Typically, this refers to data collected about human subjects and can include sensitive, confidential, or personal information related to an individual’s health, ethnicity, political views, and/or geographic location, to name a few. Research data involving human subjects must be managed in accordance with Research Ethics Board (REB) guidelines and approval. Many institutions provide security standards and protection guidelines for managing sensitive and confidential data.
In Canada, research funded by the three federal research funding agencies (the agencies) involving human subjects is guided by the Tri-Council Policy Statement (TCPS 2): Ethical Conduct for Research Involving Humans (GoC Panel, 2023). Researchers must adhere to the policy, which covers issues related to consent, privacy, fairness, and equity, in relation to different types of human research, including clinical trials, genetic research, and research involving First Nations, Inuit and Métis. Research involving Indigenous peoples may not be subject to TCPS 2 guidelines depending on circumstances and terms agreed to or governing the research data that is considered under the control of the participants or community groups (see chapter 3, “Indigenous Data Sovereignty”; review the OCAP® principles for a model dealing with data on First Nations). The handling and use of sensitive data may be governed by other legal and ethical frameworks of the research program (e.g., CIHR, SSHRC) or institution, or at the provincial (e.g., FIPPA, PHIDA) or federal (e.g., Privacy Act, PIPEDA) level.
In 2021, the Tri-Council provided guidelines for researchers titled Guidance on Depositing Existing Data in Public Repositories (Government of Canada Panel on Research Ethics, 2021), which state that researchers may deposit and share data in a repository if they have received consent from participants to do so and/or if they receive approval from an REB. Researchers must be in compliance with the TCPS 2 before deposit and sharing and must seek REB approval before collection or reuse of human subject research.
Analysis
Infrastructure and support services for sensitive data storage, deposit, and sharing continues to be a major gap in Canada. The complexity around sensitive data requires intersection with a number of units on campus, including REB guidelines, contracts and legal support, RDM practices, and infrastructure and workflows to manage sensitive data throughout the lifecycle.
For health sciences research, there are several avenues to publish or share sensitive data with various considerations. De-identification or anonymizing the dataset involves removing identifiable data from a dataset. However, some datasets cannot be de-identified without compromising the usefulness of the data. Data may be shared through closed-access portals with data sharing/transfer agreements. One potential downside of this arrangement is the administrative overhead and potential need for a custom portal.
Discussion/Conclusions
There are ongoing efforts to improve tools, infrastructure, workflows, and resources around sensitive data management and sharing. Software, such as Research Electronic Data Capture (REDCap), has grown in popularity as a tool to capture data for clinical research and create databases and projects that are compliant with legal guidelines, secure, and easy to use (Patridge & Bardyn, 2018). The Alliance’s Sensitive Data Repository Project has led to the creation of a zero-knowledge encryption tool to facilitate secure deposit and controlled access to sensitive data within the FRDR platform. For the next phase of the project, the Alliance RDM team is leading the collaborative participation of institutions in policy framework development, which aims to clarify and streamline the workflow of sensitive data deposit and sharing. The Alliance’s Sensitive Data Expert Group has released resource documents to provide guidance around RDM practices in the context of research ethics frameworks, including the Sensitive Data Tool Kit:
Researchers need continued leadership for national solutions to ensure equitable access to support, tools, and infrastructure for sensitive data management and sharing.
Case Study 4: Supporting Canada’s Large Data Producers: SuperDARN and the Federated Research Data Repository
Background
The Super Dual Auroral Radar Network (SuperDARN) is a network of three dozen scientific radars deployed around the world by universities and government laboratories in ten countries. SuperDARN Canada (headquartered at the University of Saskatchewan) operates five radars in Canada, which produce valuable data that researchers can use to understand space weather, radio communication, and physics of the Earth’s upper atmosphere. However, due to the high-quality captures and rapid collection rates of the radars, SuperDARN is generating data at a massive scale, and storing this data in a manner that is secure, discoverable, and accessible is challenging. In 2018, SuperDARN Canada began meeting with the team at the FRDR.
Analysis
The size, scale, scope of the data, and complexity of SuperDARN’s organizational framework as an international research partnership presented numerous challenges. SuperDARN’s data collection began in 1993, and the data exist in both raw and processed forms. SuperDARN Canada and the FRDR team had to consider which format of the data (approximately 80 TB of raw data or approximately 10 TB of processed data for each algorithmic version) would be best to publish and, of the processed data, which algorithm generation to choose — the older algorithm that has widespread use or the newer one. Versioning datasets to update the outdated algorithm would mean doubling the size of the collection.
Data are collected across time, regions, and instruments via radar installations operating in the Northern and Southern Hemispheres, so the teams had to consider how to subdivide the data into publishable units that would be best suited for discovery, reuse, and usage tracking and reporting. They also had to consider the size of a dataset and number of files and take into account web browser limitations. And while the files are small, depending on how the data were organized, datasets had the potential to be many terabytes.
Since raw and processed data were available only as binary file types, the FRDR curation team could not perform quality checks on the files. The complexity of data also meant that without extensive documentation, the datasets would be useful only to a small number of users involved with the research.
Discussion/Conclusions
Format
The team decided to publish the raw form of the data dating back to 1993.
Curation
The FRDR curation team worked with SuperDARN Canada to review the datasets and develop README files that capture detailed descriptive and technical metadata required for reuse of the data by the broader researcher community. Links to associated publications and documentation were added, and datasets were linked to analysis and visualization software developed by SuperDARN.
Lessons Learned
In addition to the solutions discussed above, the following lessons were learned from this project:
Consultation on data publication needs can take time and is an ongoing process. It took several years from the initial conversation to when the first datasets were ingested; and beyond publication, FRDR and SuperDARN Canada still meet periodically.
Consistent communication is important, particularly when decisions require longer timeframes; setting regular meetings and documenting discussions and decisions ensures that everybody remains on the same page and that threads do not get lost.
Sustainability and future planning are key. When working with SuperDARN, FRDR needed to think about the data publication needs associated with the collection and the commitment going forward.
Future of Data Sharing in Canada
There are a number of developments that could better support Canadian researchers with maximizing the benefits of data sharing. A few suggested areas are provided below, including improving access and inclusion, enhancing research platforms that support the lifecycle of data, developing tools and technologies to automate curation workflows, and improving integration and interoperability between systems and platforms.
Access and Inclusion
Systemic barriers to the inclusion of all researchers and disciplines in accessing and using data sharing tools and services must be removed to support more equitable adoption of data sharing policies and practices. New ways of thinking about data sharing are needed to transform infrastructures that support all types of research data; both in terms of formats and standards, but also the related conceptual models and workflows.
As data sharing workflows mature, attention must be paid to ensuring equitable publishing models are created. Given the high cost of storage, particularly for large datasets, we need to balance sustainability and equity.
Examples
greater customization of data repositories and flexible tools and standards
web accessibility standards within software and platforms
open access agreements between research institutions, publishers, and repositories
Research Lifecycle Platforms
Typical repository workflows for uploading or downloading data require moving data across platforms and between storage locations. Transferring data in this manner is inefficient and costly, and it may be impossible or infeasible for large datasets due to cost, transfer times, or infrastructure limitations. Additionally, certain datasets rely on specialized software or computational environments for analysis. Research platforms and underlying storage clusters that accommodate the full lifecycle of data are needed, where data can be analyzed and curated and an authoritative version shared.
Examples
easy-to-use tools for deploying datasets between different storage layers (e.g., moving data to and from repository and active storage)
all-in-one cloud platforms for data analysis, curation, and sharing
Curation Automation
Making data available is not enough to advance open science, which requires significant resources of time and money to make datasets FAIR. New tools and technologies could reduce this investment and support researchers and curators in producing high-quality outputs.
Examples
artificial intelligence algorithms that generate high-quality metadata from data
software for automated data linkage within and across datasets
software that guides researchers in documenting their datasets, with built-in standards and taxonomies
software that checks for reproducibility and dataset quality
Integration and Interoperability
As demonstrated by the range of policies, tools, and services supporting the sharing of research data, there is significant momentum to progress these infrastructures. However, many are provided and developed in relative isolation, with only a few pieces of middleware or policy frameworks to connect them. As these infrastructures are developed, interoperability (e.g., connecting policy to platform, platform to service, service to policy, etc.) and integration into the research and publishing workflows will be a central focus to improve ease of use and increase adoption of data sharing practices.
Examples
policy frameworks for sharing data across jurisdictional boundaries
Incorporating Data Management Plans into research and sharing infrastructure
connecting datasets into a broader network of research outputs
Conclusion
Canadian infrastructure, tools, and services that support sharing research data are important, particularly given policies requiring access to publicly funded data. A researcher’s area of study and ethical considerations impact the way data is shared and influence developments of policy and infrastructure that could advance data sharing in Canada.
Reflective Questions
What are the challenges of sharing research data?
What are the types of data storage? Provide an example of each.
What are considerations around data sharing? How do disciplinary differences play a role in sharing?
What kinds of data services (local, domain-specific, or national) could be developed to address the challenges and barriers identified in this chapter?
Key Takeaways
Funders and publishers may set requirements that promote research data sharing; however, policies alone are not sufficient to ensure results are reproducible. Technical and discipline-specific solutions may be required to ensure that data is accessible and reusable.
Storage options, infrastructures, and data repositories in Canada support the production, sharing, and reuse of research data over its lifecycle. Research data storage can be broken down into three types: active, repository, and archival. Canadian research institutions often provide storage infrastructures to their researchers, though availability depends on institutional capacity.
Support services exist for Canadian researchers developing RDM practices, publishing data, or planning for reuse of data, including their own research groups, higher-education institutions, and services unique to the needs of specific research communities.
Researchers should consider disciplinary differences and context around data sharing. Certain fields have a tradition of open data sharing and reuse. While some disciplines have adopted standards and tools to support this work, others may need support and tools to address areas such as metadata, file size, data type, and requirements around data sensitivities.
Data sharing and reuse is supported through integration and interoperability between systems and platforms, including platforms that support the lifecycle and technologies that facilitate curation workflows.
Additional Readings and Resources
Barsky, E., Laliberté, L. W., Leahey, A., and Trimble, L. (2017). Chapter 3. Collaborative Research Data Curation Services: A View from Canada. In L. R. Johnston, Curating research data, volume one: Practical strategies for your digital repository (79-101). Association of College and Research Libraries. https://dx.doi.org/10.14288/1.0340778
Cheung, M., Cooper, A., Dearborn, D., Hill, E., Johnson, E., Mitchell, M., & Thompson, K. (2022). Practices before policy: Research data management behaviours in Canada. Partnership: The Canadian Journal of Library and Information Practice and Research, 17(1), 1–80. https://doi.org/10.21083/partnership.v17i1.6779
Garnett, A., Leahey, A., Savard, D., Towell. B., & Wilson, L. (2017). Open metadata for research data discovery in Canada. Journal of Library Metadata, 17(3-4), 201-217. https://doi.org/10.1080/19386389.2018.1443698
Thompson, K., & Kellam, L. M. (Eds.). (2016). Introduction to databrarianship: The academic data librarian in theory and practice. In L. M Kellam & K. Thompson (Eds.), Databrarianship: The academic data librarian in theory and practice. Association of College and Research Libraries. https://scholar.uwindsor.ca/cgi/viewcontent.cgi?article=1047&context=leddylibrarypub
Rice, R., & Southall, J. (2016). The data librarian’s handbook. Facet Publishing.
Baker, D., Bourne-Tyson, D., Gerlitz, L., Haigh, S., Khair, S., Leggott, M., Moon, J., Ridsdale, C., Tourangeau, R., & Whitehead, M. (2019). Research data management in Canada: A backgrounder. Zenodo. https://doi.org/10.5281/zenodo.3574685
Corcho, O., Eriksson, M., Kurowski, K, Ojsteršek, M., Choirat, C. van de Sanden, M., & Coppens, F. (2021). EOSC interoperability framework: Report from the EOSC executive board working groups FAIR and architecture. Publications Office of the European Union. https://data.europa.eu/doi/10.2777/620649
Goddard, L., Barsky, E., Cooper, A., Darnell, A., Davis, C., Doiron, J., & Taylor, S. (2018). Dataverse north working group: Year 1 recommendations. UBC Faculty Research and Publications. https://doi.org/10.14288/1.0386773
Goodchild, M., & Huck, J. (2022, March). Building a shared open research data repository community in Canada. Open Science Framework. osf.io/n8wzt
Jones, K., Bevan, G., & Monette, M. (2017). The Diniacopoulos ceramics display, Department of Classics – 2016. https://doi.org/10.5683/SP/T7ZJAF, Borealis, V2, UNF:6:B4MvStefgmeu6++JjcdOQg== [fileUNF]
Rieseberg, L., Warschefsky, E., O’Boyle, B., Taberlet, P., Ortiz-Barrientos, D., Kane, N. C., & Sibbett, B. (2021). Editorial 2021. Molecular Ecology, 30(1), 1-25. https://doi.org/10.1111/mec.15759
Stuart, D., Baynes, G., Hrynaszkiewicz, I., Allin, K., Penny, D., Lucraft, M., & Astell, M. (2018). Whitepaper: Practical challenges for researchers in data sharing. figshare. https://doi.org/10.6084/m9.figshare.5975011
Tedersoo, L., Küngas, R., Oras, E., Köster, K., Eenmaa, H., Leijen, Ä., Pedaste, M., Raju, M., Astapova, A., Lukner, H., Kogermann, K., & Sepp, T. (2021). Data sharing practices and data availability upon request differ across scientific disciplines. Scientific data, 8, 192. https://doi.org/10.1038/s41597-021-00981-0
Vines, T. H., Andrew, R. L., Bock, D. G., Franklin, M. T., Gilbert, K. J., Kane, N. C., Moore, J-S., Moyers, B. T., Renaut, S., Rennison, D. J., Veen, T., & Yeaman, S. (2013). Mandated data archiving greatly improves access to research data. The FASEB Journal, 27(4), 1304-1308. https://doi.org/10.1096/fj.12-218164
Wilkinson, M. D., Dumontier, M., Aalbersberg, I. J., Appleton, G., Axton, M., Baak, A., Blomberg, N., Boiten, J-W., da Silva Santos, L. B., Bourne, P. E., Bouwman, J., Brookes, A. J., Clark, T., Crosas, M., Dillo, I., Dumon, O., Edmunds, S., Evelo, C. T., Finkers, R., Gonzalez-Beltran, A., … Mons, B. (2016). The FAIR guiding principles for scientific data management and stewardship. Scientific data, 3, 160018. https://doi.org/10.1038/sdata.2016.18
About the authors
Meghan Goodchild
Meghan Goodchild is the Research Data Management Librarian at Queen’s University and Scholars Portal of the Ontario Council of University Libraries. At Queen’s University Library, Meghan is the lead contact for research data management and collaborates with campus partners to improve workflows and services supporting the research data lifecycle. At Scholars Portal, Meghan provides leadership on the team supporting Borealis, the Canadian Dataverse Repository. She holds a PhD in Music Theory and a Masters of Information Studies from McGill University.
Shahira Khair
Shahira Khair (she/her) is a Librarian at the University of Victoria Libraries, with portfolios in organizational analysis and data management. Prior to joining UVic, she worked with national organizations advancing digital initiatives in research and higher ed, including the Canadian Association of Research Libraries and the Digital Research Alliance of Canada. She holds a Masters of Science in Biology and a Masters of Information Studies from the University of Ottawa.
Amber Leahey
Amber Leahey is a Data & GIS Librarian and the Service Director for Borealis, the Canadian Dataverse Repository, a secure, bilingual, national data repository provided in partnership with academic libraries and research institutions across Canada. In her role she supports libraries, institutions, and researchers with data management, sharing, preservation, and reuse, through ongoing development of data and research services at Scholars Portal and the University of Toronto Libraries. She holds a Master of Library and Information Studies from the University of Toronto.
Kaitlin Newson
Kaitlin Newson is a Digital Research Consultant with ACENET at the University of Prince Edward Island. Formerly, Kaitlin was the Digital Projects Librarian with Scholars Portal, a service of the Ontario Council of University Libraries, where she supported digital infrastructure for research data management, scholarly publishing, and cloud storage services for Canadian university libraries. She holds a Master of Information from the University of Toronto.
Lee Wilson
Lee Wilson is the Director of Research Data Management at the Digital Research Alliance of Canada. In this role, Lee oversees the national Research Data Management team at the Alliance, as well as service provision and development through partnerships with a variety of Canadian institutions and organizations. Lee previously held the position of Manager for RDM Platforms and Services at the Alliance, worked as a Research Consultant for Data Management in Atlantic Canada with ACENET, and as a part of the data management team for the Marine Environmental Observation Prediction and Response Network, supporting researchers working with oceans data. He holds a Master of Library and Information Studies from Dalhousie University.
The RDM Maturity Assessment Model in Canada (MAMIC)
6
Jane Fry; Jennifer Abel; Dylanne Dearborn; Alison Farrell; and Chantal Ripp
Learning Outcomes
By the end of this chapter you should be able to:
Explain what a maturity assessment model is.
Understand the value of completing a Research Data Management maturity assessment.
Understand why and how a made-in-Canada maturity assessment model was developed.
Be able to use the Maturity Assessment Model in Canada to assess Research Data Management service maturity at a Canadian research institution.
Be able to support evidence-based decision making with the results gathered from the completed Maturity Assessment Model in Canada.
Introduction
By now you know that Research Data Management (RDM) involves a range of practices and services such as data management planning, curation, discovery, and preservation. So research institutions — universities, colleges, hospitals — thinking about RDM should consider all services, resources, and personnel that support RDM for every research project, particularly when an institution is formalizing services, as many Canadian institutions were at the time of writing (spring 2022) in response to the Tri-Agency Research Data Management Policy.
But how can people at a research institution determine whether all areas of the research data lifecycle are being supported and who is responsible for what? To support Canadian research institutions in undertaking this important step, the authors of this chapter came together in the summer of 2021 to develop the RDM Maturity Assessment Model in Canada, or MAMIC (Fry et al., 2021), to help RDM partners understand the services and resources available to support data management at their institution.
In this chapter, we’ll examine why Canadian institutions may want to conduct an RDM maturity assessment for their institution, in particular, looking at the institutional RDM strategy requirement which was implemented by Canada’s three federal research funding agencies (the agencies); the development of the MAMIC; and how to complete the MAMIC and use its results. Finally, we’ll highlight the importance of community efforts in creating the tool.
The Need: How to Assess an Institution’s RDM Services
In the spring of 2021, the Canadian Institutes of Health Research (CIHR), the Natural Sciences and Engineering Research Council of Canada (NSERC), and the Social Sciences and Humanities Research Council of Canada (SSHRC) released their long-anticipated Tri-Agency RDM Policy. This policy supports Canadian research excellence by ensuring that researchers engage in sound RDM and data stewardship practices, and that their institutions support them in these practices. The Agencies expect high standards of excellence — that research is performed ethically, funds are used wisely, experiments and studies are replicable, and research results are as accessible as possible (Government of Canada, 2021). To demonstrate this, institutions must create and publish an RDM strategy that sets out their commitment to RDM principles and how they will support their researchers in adopting them (see section 3.1 of the policy).
Since one type of strategy will not fit all situations, each institution should consider its particular circumstances, such as its size, research intensity, and existing RDM capacity. But how does an institution determine what its RDM capacity is or what its strategy should be? To help determine this, in 2018, the Digital Research Alliance of Canada (formerly the Portage Network) released an Institutional RDM Strategy Development Template, which was updated in November 2021. The template outlines a five-stage process to inform and shape the creation of an RDM strategy that meets local needs and resource capacities. We’ll focus on the second stage of the process, which encourages institutions to assess their state of RDM using assessment models and tools.
What Is a Maturity Assessment Model? And Why Does Canada Need One?
Maturity assessment models and tools evaluate an institution’s maturity and readiness for RDM service provision and help determine the level of sophistication of a service or product. A common feature of these models is the use of a scale to represent an organization’s maturity in specific capabilities — in other words, how reliably the organization performs the process (Rans & Whyte, 2017). The maturity rubric allows a user to quantify capabilities and enable continuous process improvement.
Internationally, RDM is well-established for enabling research excellence, and several maturity models have already been developed. However, when Canadian institutions began using these models to evaluate the state of RDM on their campuses, they found that these tools did not align with the Canadian RDM landscape; for example, Canadian institutions are not required to have RDM policies, unlike institutions in some other countries.
In 2021, after the release of the Tri-Agency RDM Policy, members of the national RDM community began informally discussing how institutions should go about creating their RDM strategies. The National Training Expert Group (NTEG)NTEG is part of the Network of Experts that is affiliated with the Digital Research Alliance of Canada., a group of information professionals, researchers, and practitioners, decided to create a series of webinars and workshops to be presented in October 2021 to bring representatives of different institutions together to discuss their strategy development work. While planning for the fall series, several members noted that there was no Canadian maturity assessment model that institutions could use in the second stage of their strategy development. NTEG decided that a Canadian-focused maturity assessment model tool could be a useful starting place for discussions about institutional RDM capacity with strategies in alignment with the Tri-Agency RDM Policy. In April 2021, a smaller group set to work on developing what would become the first version of the MAMIC, in time for the October workshop. We — the authors of this chapter — along with Shahira Khair of the University of Victoria, were the members of that group.
How the MAMIC Was Created
Environmental Scan of Maturity Assessment Models
As a first step, we examined several international assessment tools. While the available models were excellent, they included sections not applicable to Canada, and there were gaps — things we needed to include in the Canadian model, one of them being the requirement by the agencies for an RDM Institutional Strategy. After our review, we focused on aspects of the three most popular models to help develop the MAMIC — the Research Infrastructure Self Evaluation Framework (RISE) tool, published in 2017 by the Digital Curation Centre (DCC); the Evaluate your RDM Offering tool by SPARC Europe; and the Data Management Framework of the Australian National Data Service (ANDS)Since the time of the development of the MAMIC, ANDS has been folded into the Australian Research Data Commons (ARDC), https://ardc.edu.au/. We based our Canadian model primarily on RISE, with elements inspired by the SPARC model and the ANDS frameworks.
Overview of the MAMIC
In our Canadian tool, we detail the reason for, intention of, and definition of the MAMIC, and provide a section on how to complete it. There are four tables to be filled out by the research partners:
Institutional Policies and Processes
IT Infrastructure
Support Services
Financial Support
Each table has five columns:
element being assessed
definition of that element
its maturity level (how advanced the institution’s RDM is)
its scale (who may access the service or support)
any required explanation as to the rating given to that element
Below each table, there’s space for the date of completion as well as the name(s) and role(s) of the person(s) filling it out, since users need to know who those research partners are in order to address questions or concerns about how the table was completed. The MAMIC is also intended to be used in the future, so it’s important to know who filled in the previous version.
We also wanted to ensure that the terms used were well defined, so we included a page of definitions of maturity and scale levels specific to each table, along with hints to help fill them out.
Initial Version of the MAMIC
After receiving feedback from members of the RDM community, a draft was completed, the MAMIC was translated into French (where it is the MEMAC, or Modèle d’évaluation de la maturité de la GDR au Canada) and introduced to the attendees at the Institutional Strategies Workshop in late October 2021.
Note: There are certain areas not covered in this initial version, so changes will need to be made in future versions. For example, a future version should contain considerations for Indigenous data sovereignty. Another idea is to explore different ways to present the tool, such as developing an online tool that could allow users to produce different types of charts, as the SPARC tool does.
These revisions will be useful for those who plan to do this type of assessment on a regular basis as part of reviewing and revising their institutional RDM strategy or as part of ongoing service improvements. It may also be useful to apply the MAMIC at a national scale to highlight and address gaps and to showcase where institutions may be able to rely on national resources.
Using the MAMIC
The MAMIC can be used to determine whether RDM resources and services exist, as well as who is responsible for these different supports so that institutions can support researchers in effective data management and also be aware of what is needed to supplement their current offerings. Using the model involves coordination between interested parties across campus, such as the library, research office, ethics office, and IT department.
Categories and Measures
Before the work begins, research partners filling in the MAMIC should discuss the process so everyone understands how scales and measures will be applied and to ensure that key decisions about how to do the work are documented. Each category (Institutional Policies and Processes, IT Infrastructure, Support Services, and Financial Support) can be assessed in its own table — see Appendix 2 for an example of a completed Institutional Policies and Processes category — using three different measures:
Measure 1: Maturity Level of the element at the institution is rated on a 5-level scale ranging from “does not exist” OR “do not know” to “robust and focuses on continuous evaluation.” Note: the first level of this scale is 0 not 1 because sometimes an institution cannot provide a service or support, or does not feel they need it. The category “does not exist” is not meant to indicate a level of maturity, but rather an acknowledgement that this element is not available to researchers at an institution.
Measure 2: Scale is used to identify who can access the service or support. The element may not be applicable to certain users or is not available to all populations. This allows an institution to see whether its services are being offered in an equitable and appropriate manner or if there are accessibility issues.
Measure 3: Comments are perhaps the most important measure because this section identifies specific strengths and weaknesses and provides an avenue for discussion. This is also a place where regional, national, consortial, or other tools that complement the institution’s RDM maturity can be noted. It can be difficult to determine the maturity level or scale of an element if there are multiple initiatives within that element (e.g., multiple units offering similar data management services), so the comments section can be used for explanations of such instances.
Filling in the MAMIC
The data collected in the MAMIC are for that particular institution’s use only; none will be collected by any other organization, and those who fill in the MAMIC are the ones to decide how to collect and use their data.
While the MAMIC can be completed by an individual, we recommend that a group of interested research partners be involved. These people should come from the areas being assessed. For example, IT Infrastructure should be assessed by representatives of IT; Financial Support should be assessed by representatives of the areas which provide RDM services and support (e.g., libraries, IT, research services).
After the MAMIC was made public, the RDM community shared four examples of the MAMIC completion process with us, and each looked similar. Three of the institutions had a small working group composed of librarians, IT representatives, research office members, and either a researcher or an industry partner. At one of the institutions, however, the data librarian filled in the entire document, reaching out to colleagues in the office of research services to help fill in gaps. This method was less effective and a tremendous amount of work, by comparison. In each case, the results of the MAMIC were taken to a larger RDM committee for discussion.
Benefits of the MAMIC
When developing RDM strategies and supports, partners must reflect on the state and scope of RDM services and supports at their institution and on future needs and desires. A maturity assessment model, like the MAMIC, can help identify gaps, strengths, weaknesses, challenges, and opportunities that exist in the research data landscape. This helps the institution decide where resources and efforts should be directed so they can have supports in place to ensure the success of researchers.
Effective use of this tool creates a complete and representative assessment, but this process requires collaboration and input from a variety of research partners; so a benefit of using the MAMIC is that these types of opportunities for discussion can open the door for relationship building. This supports the institutional RDM landscape and presents opportunities for dialogue, collegiality, and partnership outside of RDM. For example, it may open up lines of communication between IT services and the library’s internal IT unit to allow for greater integration of library services and IT resources.
Bringing together research partners by using a shared tool can illustrate the complexity of RDM and the breadth of efforts across an institution. This can help break down silos and distinguish areas of expertise within the institution, draw connections and interactions, and highlight areas for collaboration and discussions about the institutional strategy and priorities, resource allocation, or budget considerations. Using the same tool over time can also be helpful for benchmarking, to track institutional developments and progress.
On a larger scale, the MAMIC may facilitate conversations between Canadian institutions. Noting where external resources are available or are being developed can help institutions decide where to invest locally. Also, identifying gaps across institutions may offer an opportunity to forge new national initiatives. This can reduce the duplication of effort to solve each gap at an institutional level, which can be time consuming, costly, and require dedicated staff support.
Conclusion
This chapter has presented the MAMIC in two ways: as a tool that RDM practitioners and institutions can use in current or future RDM work, and as a useful example of how Canadian RDM community members can create tools to help everyone work more effectively and efficiently. We identified a need and set out to fill it using the skills and techniques we use elsewhere in our work: conducting environmental scans and literature reviews, developing materials for user groups, gathering user feedback, and working as a team. We also used the resources and people available to us — in particular, the national RDM Network of Experts community and the RDM team at the Digital Research Alliance of Canada — to help develop and disseminate the tool.
Reflective Questions
Choose a category of the MAMIC to reflect on, and then complete the following:
Consider what research partners should be involved in order to get an accurate picture of RDM supports offered in this category at an institution. How would you encourage participation from them?
List four ways the MAMIC can help assess the level of RDM support at an institution.
Key Takeaways
A maturity assessment model is a tool to determine the level of sophistication of a service or product.
Maturity assessment models specific to RDM have been developed by different international organizations and have been used for years to assess RDM support services.
The MAMIC was developed to reflect the needs of Canadian institutions that are creating institutional RDM strategies.
Completing the MAMIC allows research partners to engage in discussion and evaluation about the state of RDM at their institution, to understand the breadth of RDM offerings and support, and to collaborate across divisions.
There are a variety of ways in which completing the MAMIC could be used to help in institutional decisions and discussions around RDM. This can enable research partners to move their institution forward by making evidence-based decisions about how RDM services and resources could develop in the future.
Fry, J., Doiron, J., Létourneau, D., Perrier, L., Perry, C., & Watkins, W. (2017, January 31). Research data management training landscape in Canada: A white paper [R]. http://dx.doi.org/10.14288/1.0372048
Institutional RDM Strategy Template Revision Working Group. (2021). Institutional research data management strategy development template (3.0). Zenodo. https://doi.org/10.5281/zenodo.5745906
Jacob, B., Whyte, A., Meyer, A., D’haenens, S., Hartmann, N. K., & Weiß, N. (2019, October 2). Using RISE, an international perspective [lightning talk].15th International Digital Curation Conference (IDCC), Dublin, Ireland. https://doi.org/10.5281/zenodo.3565440
Jones, S., Pryor, G., & Whyte, A. (2012). Developing research data management capability: The view from a national support service. In: R. Moore, K. Ashley, & S. Ross (Eds.), Proceedings of the 9th International Conference on Preservation of Digital Objects (iPRES), (pp. 142-149). Toronto: University of Toronto Faculty of Information. https://phaidra.univie.ac.at/detail/o:293775
Jones, S., Rans, J., Sisu, D., & Whyte, A. (2014). Reshaping the DCC institutional engagement programme. International Journal of Digital Curation, 9(2), 47-64. https://doi.org/10.2218/ijdc.v9i2.334
Kouper, I., Fear, K., Ishida, M., Kollen, C., & Williams, S. C. (2017). Research data services maturity in academic libraries [B]. http://dx.doi.org/10.14288/1.0343479
Perry, C., Fry, J., & Doiron, J. (2017, June 1). Portaging the landscape: Developing and delivering a national RDM training infrastructure in Canada [presentation]. IASSIST 2017. https://doi.org/10.5281/zenodo.4551708
Fry, J., Dearborn, D., Farrell, A., Khair, S., & Ripp, C. (2021, November 30). RDM maturity assessment model in Canada (MAMIC) (1.0). Zenodo. https://doi.org/10.5281/zenodo.5745493
Rans, J., & Whyte, A. (2017). Using RISE, the research infrastructure self evaluation framework v.1.1. Edinburgh: Digital Curation Centre. www.dcc.ac.uk/guidance/how-guides/RISE
Jane Fry is the Data Services Librarian at Carleton’s MacOdrum Library where Research Data Management is one of her responsibilities. She is also the lead on Carleton’s Institutional RDM Strategy Working Group. As well, she chaired the Training Expert Group under Portage for four years and remains a member of that group today.
Jennifer Abel
Jennifer Abel is the Research Data Management Specialist in the University of Calgary’s Research Services Office, and is coordinating the development of UCalgary’s RDM Strategy. She previously worked as the Training Coordinator for both the Portage Network and the Digital Research Alliance of Canada’s RDM team. She holds a PhD in Linguistics and an MLIS from the University of British Columbia.
Dylanne Dearborn
Dylanne Dearborn is the Research Data Management Coordinator and the Research Data Librarian for Sciences & Engineering at the University of Toronto, in the Map and Data Library. She chaired the Research Intelligence Expert Group with Portage for three years and remains a member of that group today.
Alison Farrell
Alison Farrell is a Research Data Management and Public Services Librarian at the Health Sciences Library at Memorial University of Newfoundland and is a member of the RDM Institutional Strategy working group at Memorial. She was the co-chair for the Portage Institutional Strategies working group, whose mandate was to provide educational materials on developing institutional strategies.
Chantal Ripp
Chantal Ripp is a Research Librarian in the Interdisciplinary Data Team at the University of Ottawa. She is a member of the University’s RDM Advisory Group responsible for developing an institutional strategy. She is also a member of a number of other local and national committees, including the DLI Professional Development Committee and the Digital Research Alliance Data Management Plan Expert Group (DMPEG).
Working with Data
III
Data Cleaning During the Research Data Management Process
7
Lucia Costanzo
Learning Outcomes
By the end of this chapter you should be able to:
Describe why it is important to clean your data.
Recall the common data cleaning tasks.
Implement common data cleaning tasks using OpenRefine.
What Is Data Cleaning?
You may have heard of the 80/20 dilemma: Most researchers spend 80% of their time finding, cleaning, and reorganizing huge amounts of data and only 20% of their time on actual data analysis.
When starting a research project, you will use either primary data generated from your own experiment or secondary data from another researcher’s experiment. Once you obtain data to answer your research question(s), you’ll need time to explore and understand it. The data may be in a format which will not allow for easy analysis. During the data cleaning phase, you’ll use Research Data Management (RDM)practices. The data cleaning process can be time consuming and tedious but is crucial to ensure accurate and high-quality research.
Data cleaning may seem to be an obvious step, but it is where most researchers struggle. George Fuechsel, an IBM programmer and instructor, coined the phrase “garbage in, garbage out” (Lidwell et al, 2010) to remind his students that a computer processes what it is given — whether the information is good or bad. The same applies to researchers; no matter how good your methods are, the analysis relies on the quality of the data. That is, the results and conclusions of a research study will be as reliable as the data that you used.
Using data that have been cleaned ensures you won’t waste time on unnecessary analysis.
Six Core Data Cleaning and Preparation Activities
Data cleaning and preparation can be distilled into six core activities: discovering, structuring, cleaning, enriching, validating, and publishing. These are conducted throughout the research project to keep data organized. Let’s take a closer look at these activities.
1. Discovering Data
The important step of discovering what’s in your data is often referred to as Exploratory Data Analysis (EDA). The concept of EDA was developed in the late 1970s by American mathematician John Tukey. According to a memoir, “Tukey often likened EDA to detective work. The role of the data analyst is to listen to the data in as many ways as possible until a plausible ‘story’ of the data is apparent” (Behrens, 1997). EDA is an approach used to better understand the data through quantitative and graphical methods.
Quantitative methods summarize variable characteristics by using measures of central tendency, including mean, median, and mode. The most common is mean. Measures of spread indicate how far from the center one is likely to find data points. Variance, standard deviation, range, and interquartile range are all measures of spread. Quantitatively, the shape of the distribution can be evaluated using skewness, which is a measure of asymmetry. Histograms, boxplots, and sometimes stem-and-leaf plots are used for quick visual inspections of each variable for central tendency, spread, modality, shape, and outliers.
Exploring data through EDA techniques supports discovery of underlying patterns and anomalies, helps frame hypotheses, and verifies assumptions related to analysis. Now let’s take a closer look at structuring the data.
2. Structuring Data
Depending on the research question(s), you may need to set up the data in different ways for different types of analyses. Repeated measures data, where each experimental unit or subject is measured at several points in time or at different conditions, can be used to illustrate this.
Figure 1.Investigating the effect of a morning breakfast program.
In Figure 1, researchers might be investigating the effect of a morning breakfast program on Grade 6 students and want to collect test scores at three time points, such as the pre- (T1), mid- (T2), and post-morning (T3) periods of the breakfast program. Note that the same students are in each group, with each student being measured at different points in time. Each measurement is a snapshot in time during the study. There are two different ways to structure repeated measures data: long and wide formats.
Table 1.Data structured in long format.
Table 1 shows data structured in long format, with each student in the study represented by three rows of data, one for each time point for which test scores were collected. Looking at the first row, Student One at Timepoint 1 (before the breakfast program) scored 50 on the test. In the second row, Student One at Timepoint 2 (midway through the breakfast program) scored higher on the test, at 65. And in the third row, Student One at Timepoint 3 (after the program) scored 80.
The wide format, shown in Table 2, uses one row for each observation or participant, and each measurement or response is in a separate column. In wide format, each student’s repeated test scores are in a row, and each test result for the student is in a column. Looking at the first row, Student One scored 50 on the test before the breakfast program, then scored 65 on the test midway through the breakfast program, and achieved 80 on the test after the program.
So, a long data format uses multiple rows for each observation or participant, while wide data formats use one row per observation. How you choose to structure your data (long or wide) will depend on the model or statistical analysis you’re undertaking. It is possible you may need to structure your data in both long and wide data formats to achieve your analysis goals.
Table 2.Data structured in wide format.
Structuring is an important core data cleaning and preparation activity that focuses on reshaping data for a particular statistical analysis. Data can contain irregularities and inconsistencies, which can impact the accuracy of the researcher’s models. Let’s take a closer look at cleaning the data, so that your analysis can provide accurate results.
3. Cleaning Data
Data cleaning is central to ensuring you have high-quality data for analysis. The following nine tips address a range of commonly encountered data cleaning issues using practical examples.
Tip 1: Spell Check
Finding misspelled words and inconsistent spellings is one of the most important data cleaning tasks. You can use a spell checker to identify and correct spelling or data entry errors.
Spell checkers can also be used to standardize names. For example, if a dataset contained entries for “University of Guelph” and “UOG” and “U of G” and “Guelph University” (Table 3), each spelling would be counted as a different school. It doesn’t matter which spelling you use, just make sure it’s standard throughout the dataset.
Tip 01 Exercise: Spell Check
Go through Table 3 and standardize the name as “University of Guelph” in the SCHOOL column.
Table 3.Data requiring spell checking.
View Solutions for answers. Data files for the exercises in this chapter are available in the Borealis archive for this text.
Tip 2: Duplicates
Sometimes data have been manually entered or generated using methods that could cause duplications of rows. Check rows to determine if data have been duplicated and need to be deleted. If each row has an identification number, it should be unique for each observation. In this example, there are two observations with an ID number of 3 (Table 4) and both have the same values, so one of these rows of data should be deleted.
Tip 02: Exercise: Duplicates
Go through Table 4 and delete the duplicate observations.
HINT: If using Excel, look for and use the ‘Duplicate Values’ feature.
Table 4.Data with duplicate rows that should be deleted.
With some carefully crafted replacements, it’s possible to get data fairly clean and into a good format by looking for patterns and repetition in a file. In this example, we’re counting the number of bird sightings in Guelph. Looking at the LOCATION column, we need to replace the abbreviations “St” and “ST” with the full spelling of “street” (Table 5). This can be done using the basic Find and Replace function.
Tip 03 Exercise: Find and Replace
Go through Table 5. Find and replace all instances of “ST” and “st” with “Street” in the LOCATION column.
HINT: Use caution with global Find and Replace functions. In the example shown below, instances of ‘St’ or ‘st’ that do NOT indicate ‘Street’ (e.g. ‘Steffler’ and ‘First’) will be erroneously replaced. Avoid such unwanted changes by strategically including a leading space in the string you are searching for (so, ‘spaceSt’). Experiment with the ‘match case’ feature as well, if available. Always keep a backup of your unchanged data in case things go awry.
Text may be lowercase, uppercase (all capital letters), or proper case (only the first letter of each word capitalized). Text can be converted to lowercase for email addresses, to uppercase for province abbreviations, and to proper case for names. In this example, the text case is not consistent in the table. Sometimes names and emails are a mix of uppercase, lowercase, and proper case (Table 6).
Tip 04 Exercise: Letter Case
Convert text in the NAME column in Table 6 to proper case. Then convert text in the EMAIL column to lowercase.
HINT: If using Excel, look for UPPER, LOWER, and PROPER functions.
Spaces and non-printing characters can cause unexpected results when you run any type of sort, filter, and/or search function. Leading, trailing, and multiple embedded spaces or non-printing characters are invisible. They can sneak in when you import data from web pages, Word documents, or PDFs.
Tip 6: Numbers and Signs
There are two issues to watch for:
data may include text
negative signs may not be standardized
You may obtain a dataset with variables defined as strings (these may include numbers, letters, or symbols). Numeric functions, such as addition or subtraction, cannot be used on string variables, so in order to run any sort of quantitative data analysis, you’ll need to convert values in string format to numeric values. Looking at the table of bird sightings (Table 7), there is a column indicating whether the bird is a juvenile. To run quantitative data analysis, you’ll need to convert string values of “no” to the numeric value of 0 and string values of “yes” to the numeric value of 1. Leave the original JUVENILE column for reference and create another column with the numeric values. The original column is used to verify the transformation of the new column and is deleted once the transformation is confirmed to be correct. For this example, the new column, JUVENILE _NUM, contains the numeric values of the string values from the JUVENILE column (Tip 06 Exercise).
Numbers can be formatted in different ways, especially with finance data. For example, negative values can be represented with a hyphen or placed inside parentheses or are sometimes highlighted in red. Not all these negative values will be correctly read by a computer, particularly the colour option. When cleaning data, choose and apply a clear and consistent approach to formatting all negative values. A common choice is to use a negative sign.
Tip 06 Exercise: Numbers and Signs
Create a new column named JUVENILE_NUM as part of Table 7. Record a value of 0 in the JUVENILE_NUM column when “no” appears in the JUVENILE column. Record a value of 1 in the JUVENILE_NUM column when “yes” appears in the JUVENILE column.
There are many ways to format dates in a dataset. Sometimes dates are formatted as strings. If date data are needed for analysis, then at a minimum, change the field type from “string” to “date” so dates are recognized in the analysis tool of choice. With time values, you will need to select a convention and use it throughout the dataset. For example, you can choose to use either the 12- or 24-hour clock to define time in a dataset, but whichever you choose, you should be consistent throughout. You may also need to change the format to ensure that all dates and times are formatted in the same way.
Tip 8: Merge and Split Columns
After closer inspection of the newly acquired dataset, there may be a chance to either (1) merge two or more columns into one or (2) split one column into two or more. Retain the original columns used to merge or split the columns. Then, use the original columns to verify the transformation of the new column and delete the original once the transformation is confirmed to be correct. For example, you may want to split a column that contains a full name into a first and last name (Table 8). Or you may want to split a column with addresses into street, city, region, and postal code columns. Or the reverse might be true. You may want to merge a first and last name column into a full name column or combine address columns.
Tip 08 Exercise: Merge and Split Columns
In Table 8, split the NAME column into two, for first and last names.
HINT: If using Excel, look for functions to “Combine text from two or more cells into one cell” and “Split text into different columns.”
Sometimes data files contain information that is unnecessary for an analysis, so you might want to create a new file containing only variables and/or observations of interest, which will involve selectively removing unwanted columns and/or rows. In this example, the researcher removed the JUVENILE column (Table 9). Or you may need to investigate only certain observations in the file, so you can delete rows in the dataset. In this table, all swallow observations will be deleted. One advantage of this type of cleaning is that programs will run more quickly because the data file is smaller.
Tip o9 Exercise: Subset Data
Create a subset of data in Table 9 to include only observations of juveniles (JUVENILE = 1).
HINT: As always, it is important to keep a copy of your original data.
Cleaning data is an important activity that focuses on removing inconsistencies and errors, which can impact the accuracy of models. The process of cleaning data also provides an opportunity to look closer at the data to determine whether transformations, recoding, or linking additional data is desired.
4. Enriching Data
Sometimes a dataset may not have all the information needed to answer the research question. This means you need to find other datasets and merge them into the current one. This can be as easy as adding geographical data, such as a postal code or longitude and latitude coordinates; or demographic data, such as income, marital status, education, age, or number of children. Enriching data improves the potential for finding fuller answers to the research question(s) at hand.
It’s also important to verify data quality and consistency within a dataset. Let’s take a closer look at validating data, so that the models provide accurate results.
5. Validating Data
Data validation is vital to ensure data are clean, correct, and useful. Remember the adage by Fuechsel — “garbage in, garbage out.” If the incorrect data are fed into a statistical analysis, then the resulting answers will be incorrect too. A computer program doesn’t have common sense and will process the data it is given, good or bad, and while data validation does take time, it helps maximize the potential for data to respond to the research question(s) at hand. Some common data validation checks include the following:
Checking column data types and underlying data to make sure they’re what they are supposed to be. For example, a date variable may need to be converted from a string to a date format. If in doubt, convert the value to a string and it can be changed later if need be.
Examining the scope and accuracy of data by reviewing key aggregate functions, like sum, count, min, max, mean, or other related operations. This is particularly important in the context of actual data analysis. Statistics Canada, for example, will code missing values for age using a number well beyond the scope of a human life in years (e.g. using a number like 999). If these values are inadvertently included in your analysis (due to ‘missing values’ not being explicitly declared) any results involving age will be in error. Calculating and reviewing mean, minimum, maximum, etc. will help identify and avoid such errors.
Ensuring variables have been standardized. For example, when recording latitude and longitude coordinates for locations in North America, check that the latitude coordinates are positive and the longitude coordinates are negative to avoid mistakenly referring to places on the other side of the planet.
It’s important to validate data to ensure quality and consistency. Once all research questions have been answered, it’s good practice to share the clean data with other researchers where confidentiality and other restrictions allow. Let’s take a closer look at publishing data, so that it can be shared with other researchers.
6. Publishing Data
Having made the effort to clean and validate your data and to investigate whatever research questions you set out to answer, it is a key RDM best practice to ensure your data are available for appropriate use by others. This goal is embodied by the FAIR principles covered elsewhere in this textbook, which aim to make data Findable, Accessible, Interoperable, and Reusable. Publishing data helps achieve this goal.
While the best format for collecting, managing, and analyzing data may involve proprietary software, data should be converted to nonproprietary formats for publication. Generally, this will involve plain text. For simple spreadsheets, converting data to CSV (comma separated values) may be best, while more complex data structures may be best suited to XML. This will guard against proprietary formats that quickly become obsolete and will ensure data are more universally available to other researchers going forward. This is discussed more in chapter 9, “A Glimpse Into the Fascinating World of File Formats and Metadata.”
If human subject data or other private information is involved, you may need to consider anonymizing or de-identifying the data (which is covered in chapter 13, “Sensitive Data”). Keep in mind that removing explicit reference to individuals may not be enough to ensure they cannot be identified. If it’s impossible to guard against unwanted disclosure of private information, you may need to publish a subset of the data that is safe for public exposure.
For other researchers to make use of the data, include documentation and metadata, including documentation at the levels of the project, data files, and data elements. A data dictionary outlines the names, definitions, and attributes of the elements in a dataset and is discussed more in chapter 10. You should also document any scripts or methods that have been developed for analyzing the data.
Data Cleaning Software
OpenRefine (https://openrefine.org/) is a powerful data manipulation tool that cleans, reshapes, and batch edits messy and unstructured data. It works best with data in simple tabular formats, like spreadsheets (CSV), or tab-separated values files (TSV), to name a few. OpenRefine is as easy to use as an Excel spreadsheet and has powerful database functions, like Microsoft Access. It is a desktop application that uses a browser as a graphical interface. All data processing is done locally on your computer. When using OpenRefine to clean and transform data, users can facet, cluster, edit cells, reconcile, and use extended web services to convert a dataset to a more structured format. There’s no cost to use this open sourcesoftware and the source code is freely available, along with modifications by others. There are other tools available for data cleaning, but these are often costly, and OpenRefine is extensively used in the RDM field. If you choose to use other data cleaning software, always check to see if your data remain on your computer or are sent elsewhere for processing.
Exercise: Clean and Prepare Data for Analysis using OpenRefine
Go to the “Cleaning Data with OpenRefine” tutorial and download the Powerhouse museum dataset, consisting of detailed metadata on the collection objects, including title, description, several categories the item belongs to, provenance information, and a persistent link to the object on the museum website. You will step through several data cleaning tasks.
Conclusion
We have covered the six core data cleaning and preparation activities of discovering, structuring, cleaning, enriching, validating, and publishing. By applying these important RDM practices, your data will be complete, documented, and accessible to you and future researchers. You will satisfy grant, journal, and/or funder requirements, raise your profile as a researcher, and meet the growing data-sharing expectations of the research community. RDM practices like data cleaning are crucial to ensure accurate and high-quality research.
Key Takeaways
Data cleaning is an important task that improves the accuracy and quality of data ahead of data analysis.
Six core data cleaning tasks are discovering, structuring, cleaning, enriching, validating, and publishing.
OpenRefine is a powerful data manipulation tool that cleans, reshapes, and batch edits messy and unstructured data.
Reference List
Behrens, J. T. (1997). Principles and procedures of exploratory data analysis. Psychological Methods, 2(2), 131.
Lidwell, W., Holden, K., & Butler, J. (2010). Universal principles of design, revised and updated: 125 ways to enhance usability, influence perception, increase appeal, make better design decisions, and teach through design. Rockport Publishers.
About the author
Lucia Costanzo
Lucia Costanzo is the Research Data Management (RDM) Librarian at the University of Guelph. She recently completed a secondment at the Digital Research Alliance of Canada (the Alliance) as the Research Intelligence and Assessment Coordinator. As part of this role, Lucia coordinated the activities of the Research Intelligence Expert Group, which included informing and advising the Alliance RDM Team and Alliance management on emerging developments and directions, both nationally and internationally, in RDM and broader Digital Research Infrastructure ecosystems. Before the secondment, Lucia actively supported, enabled, and contributed to the learning and research process on campus for over twenty years at the University of Guelph. Email: lcostanz@uoguelph.ca | ORCID: 0000-0003-4785-660X
Further Adventures in Data Cleaning: Working with Data in Excel and R
8
Dr. Rong Luo and Berenica Vejvoda
Learning Outcomes
By the end of this chapter you should be able to:
Explain general procedures for preparing for data cleaning.
Perform common data cleaning tasks using Excel.
Import data and perform basic data cleaning tasks using the R programming language.
Introduction
Data cleaning is an essential part of the research process. In the previous chapter, you were introduced to some common, basic data cleaning tasks. In this chapter, we will delve more deeply into data exploration, manipulation, and cleaning using some flexible general-purpose research tools. The tools that we highlight are, in some cases, the same tools researchers use for analyzing their data, and it’s helpful for curators and data managers to be familiar with them.
General Procedures to Prepare for Data Cleaning
Without preparation before the data cleaning process, you may run into critical issues such as data loss. In this section, we will discuss general steps that you should take before the data cleaning process.
Making a Backup
Research data management (RDM) practices recommend creating secure backups of your data to ensure that if it is incorrectly altered during the cleaning process, the original data can always be restored. This backup copy of the original data should not be modified in any situation. You should also keep a record/log of the changes you make. You would be surprised by how many researchers create errors in their original data while they are trying to “improve” it. If a data analyst needs to access the original data, you should either send or share a copy of the data or allow read-only access to the original data.
Understanding the Data
The first step in cleaning data is understanding the data that is being cleaned. To understand the data, begin by doing some basic data exploration (or Exploratory Data Analysis) and get a sense of what problems, if any, exist within the data. Check the data values against their definitions in the metadata file or documentation for issues such as out-of-range or impossible values (e.g., negative age or age over 200). Ensure you have and understand workable data column names. Check delimiters that separate values in text files and ensure your data values don’t embed the delimiter itself. If you didn’t number your observations, you should add a unique record number to individual observations within the dataset so that you can easily find problem records by referencing that number.
Planning the Cleaning Process
Data cleaning must be done systematically to ensure all data is cleaned using the same procedures. This ensures data integrity and allows data to be easily processed during analysis. To create a plan for cleaning a specific field in a dataset, ask yourself the following three questions:
What is the data you are cleaning?
How will you identify an issue within the dataset that should be cleaned?
How should it be cleaned?
Choosing the Right Tools
One of the most important stages of data cleaning is choosing the right tool for a specific purpose. The previous chapter highlighted OpenRefine, a handy, special-purpose data-cleaning tool. Here, we discuss Excel and R, two powerful, general-purpose software tools, and highlight a few of the data cleaning features of each.
Data Cleaning Tools
The data cleaning tool you choose will depend on factors including your computing environment, your level of programming expertise, and your data readiness requirements. You have a wide variety of software and methods to choose from for cleaning and transforming data. We’ll review Excel/Google Sheets and R programming language.
Microsoft Excel/Google Sheets
Excel and Google Sheets are great tools for data cleaning and contain a variety of built-in automated data cleaning functions and features. Excel is widely available for both Windows and MacOS as a desktop program, and Google Sheets is available online. They are similar and easy to learn, use, and understand. They can both import and export the commonly used CSV data file format and other common spreadsheet formats. When exporting, be sure to check the exported data column names for usability, as some statistical packages will have issues if column names contain embedded spaces or special characters. Common data cleaning techniques used in Excel and Google Sheets for editing and manipulation are summarized in the Function table below.
Table 1. Excel functions.
Function
Description
= CONCATENATE
Combines multiple columns
= TRIM
Removes all spaces from a text string except for single spaces between words
= LEFT
Returns the first character or characters in a text string, based on the number of characters you specify
= RIGHT
Returns the last character or characters in a text string, based on the number of characters you specify
= MID
Returns a specific number of characters from a text string, starting at the position you specify, based on the number of characters you specify
= LOWER
Converts a text string to all lower case letters
= UPPER
Converts a text string to all upper case letters
= PROPER
Converts a text string to proper case so that the first letter in each word is upper case and all other letters are lower case
= VALUE
Converts text string to numeric
= TEXT
Converts numbers to text
= SUBSTITUTE
Replaces specific text in a text string
= REPLACE
Replaces part of a text string, based on the position and number of characters specified, with a different text string
= CLEAN
Removes all non-printable characters from a text string
= DATE
Returns the number that represents the date in Microsoft Excel date-time code
= ROUND
Rounds a selected cell to a specified number of digits
= FIND
Returns the starting position of one text string within another text string. FIND is case-sensitive
= SEARCH
Returns the number of the starting position of a specific character or text string within another text string, reading left to right (not case-sensitive)
To understand some of these functions, we will consider a number of common errors seen in imported data, including line breaks in the wrong place, extra spaces or no spaces in and between words, improperly capitalized or all upper case/lower case text, ill-formatted data values, and non-printing characters.
Figure 1.The CONCATENATE and TRIM functions with original and cleaned content side by side.
Figure 1 illustrates combinations of CONCATENATE and TRIM nested in various ways to find the best output configuration for how you want the text to appear.The original spreadsheet files for each figure in this chapter are available in an accessible format in Borealis. It is an example of how you can generate a single line of text from the contents of three rows by nesting two Excel functions. CONCATENATE will merge the three cells into one, but it does nothing about the extra spaces you see in the text. TRIM will remove all spaces except for single spaces between words, but it won’t add needed spaces, so we need to add quotation marks for Excel to add the needed blank spaces in between words.
Figure 2.The LEFT, RIGHT, and MID functions with original and cleaned content side by side.
The LEFT, RIGHT, and MID functions in Figure 2 demonstrate how to process data from certain directions depending on where the text or number you wish to extract are in the string.
Rows 11 and 12 show how to use the MID function to extract numbers from the middle of a text string. The MID function takes three arguments: a reference to the string you’re working with, the location of the first character you want to extract, and the number of characters you want to extract. So MID(A11,4,3) first looks up the contents of cell A11 and finds the string “BUS256XD,” and then returns three characters starting with the fourth character: 256. The data in C11 and C12 are the results of using the MID function in rows 11 and 12.
The LEFT and RIGHT functions only take two arguments: the string and the starting point. These functions then return the rest of the string, going either left or right. C13 and C14 show portions of course numbers that have been extracted from A13 and A14 using the RIGHT and LEFT functions.
Figure 3.The FIND and SEARCH functions with original and cleaned content side by side.
Figure 3 illustrates the difference between FIND and SEARCH. The FIND function in Excel is used to return the position of a specific character or substring within a text string and is case sensitive. The SEARCH function in Excel also returns the location of a character or substring in a text string. Unlike FIND, the SEARCH function is not case sensitive. Both FIND and SEARCH return the #VALUE! error if the specific character or substring does not exist within the text.
Figure 4.The UPPER, LOWER, and PROPER functions with original and cleaned content side by side.
Figure 4 shows how the UPPER, LOWER, and PROPER functions are used to produce the contents for data. The UPPER function changes all text to upper case. The LOWER function changes all text to lower case. The PROPER function changes the first letter in each word to upper case and all other letters to lower case, which is useful for fixing names.
Figure 5. The VALUE and TEXT functions with original and cleaned content side by side.
Excel aligns strings in a column based on how they are stored: text (including numbers that have been stored as text) are left aligned, numbers are right aligned. In Figure 5, the VALUE function converts text that appears in a recognized format (such as a numbers, dates, or time formats) into a numeric value. If text is not in one of these formats, VALUE returns the #VALUE! error. The TEXT function lets you change the way a number appears by applying format codes, which is useful in situations where you want to display numbers in a more readable format. But keep in mind that Excel now “thinks” of the number as text, so running calculations on it may not work or may lead to unexpected results. It’s best to keep your original value in one cell, then use the TEXT function to create a formatted copy of the number in another cell.
Figure 6.The SUBSTITUTE and REPLACE functions with original and cleaned content side by side.
Figure 6 illustrates how the SUBSTITUTE function replaces one or more text strings with another text string. This function is useful when you want to substitute old text in a string with a new string. However, it is not case sensitive. For example, in cell A41, the function will not substitute “t” for the “T” in “Time”. There is a difference between the SUBSTITUTE and the REPLACE functions. You can use SUBSTITUTE when you want to replace specific characters wherever they occur in a text string, and you can use REPLACE when you want to replace any text that occurs in a specific location in a text string.
Figure 7. The CLEAN function with original and cleaned content side by side.
The CLEAN function shown in Figure 7 removes non-printable characters, such as carriage returns (↩) or other control characters, represented by the first 32 codes in 7-bit ASCII code from the given text. Data imported from various sources may include non-printable characters and the CLEAN function can help remove them from a supplied text string. In Excel, a non-printing character may show up as a box symbol (☐). Note that the CLEAN function lacks the ability to remove all non-printing characters (e.g., “delete character”). You can specify an ASCII character using the Excel function CHAR and the number of the ASCII code. For example CHAR(127) is the delete code. To remove a non-printing character, you can simply substitute the offending non-printable character with nothing enclosed in quotation marks (“”).
The exercise below shows the CHAR(19) non-printing character in row 10, which looks like “!!”.
Exercise 1
Generate the cleaning results in column B from data imported in column A by using Excel/Google Sheets functions.
While spreadsheet software like Excel and Google Sheets provide common functions that can assist with data cleaning, it can be very difficult to use them to work with larger datasets. Additionally, if Excel or Google Sheets do not have a specific built-in function, you will require a considerable amount of programming to build that function. The R program can help. R is one of the most well-known, freely available statistical software packages that can be used in the data cleaning process. R is a fully functional programming language with features for working with statistics and data, but you don’t need to know how to program to use some basic functions.
The two most important components of the R language are objects, which store data, and functions, which manipulate data. R also uses a host of operators like +, -, *, /, and <- to do basic tasks. To work with R you type commands at a prompt, represented by “>”.
To create an R object, choose a name and then use the less-than symbol followed by a minus sign to save data into it. This combination looks like an arrow, <-. For example, you can save data “1” into an object “a”. Wherever R encounters the object “a,” it will replace it with the data “1” saved inside, like so:
> a <- 1
R comes with many functions that you can use to do sophisticated tasks. For example, you can round a number with the round function. Using a function is pretty simple. Just write the name of the function and then the data you want the function to operate on in parentheses:
> round (3.1415)

               [1] 3
R packages are collections of functions written by R’s developers. You may need to install other packages (dependencies, packages that other packages are dependent on) up front to get it to work. It is easier to just set up dependencies = TRUE when you install R packages.
Base R is simply a command-line tool: you type in commands at a prompt and see the results displayed on the screen. RStudio, on the other hand, is an integrated development environment (IDE), a set of tools including a script editor, a command prompt, and a results window, as well as some menu commands for commonly used R functions. When people talk about working in R, they usually mean using R through RStudio. Please note that to use RStudio you will need to install R first.
Download and install RStudio Desktop, which is also free and available for Windows, Mac, and various versions of Linux here: https://posit.co/download/rstudio-desktop/.
2. Become familiar with RStudio
Before importing any data, you want to become familiar with RStudio.
The R studio has four quadrants (see Figure 8):
Table 2. Purposes of the quadrants in R Studio.
Section
Purpose
Top Left
This section shows you the script(s) you are currently editing. An R script is a set of R commands and comments. They are commonly used to keep of track of the commands that need to be run and provide explanatory notes on the purpose of the commands through comments.
Top right
The “Environment” tab lists all the variables and functions defined and used in a session.
The “History” tab lists all the commands typed in the R Console (bottom left of RStudio).
The “Connections” tab can help you connect to an external database to access data that is not on your local computer.
Bottom left
The “Console” tab displays a command prompt to allow you to use R interactively, just like you would without RStudio.
The “Terminal” tab opens a system shell to perform advanced functions, such as accessing a remote system.
Bottom right
The “Files” tab lets you keep track of, open, and save files associated with your R project.
The “Plots” tab shows graphs being plotted.
The “Packages” tab allows you to load and install packages to add additional R functions.
The “Help” tab provides useful information about some functions.
The “Viewer” tab can be used to view and interact with local web content.
Figure 8.R Studio quadrants.
You can type R commands in the console at a prompt, just as you would if you were working without RStudio. You can then view the results in the “History” and “Environment” tabs. Your work is not automatically saved when R is closed. You can copy and paste your console to a text file to save it.
For example, you can open RStudio and type the following command in the console (the text after the prompt “>”):
> print("Hello")
R will return the following output:
[1] "Hello"
In addition to working interactively by typing commands at the prompt, you can also create R script files using the RStudio editor shown in the top right quadrant. Script files are text files containing a sequence of R commands that can be run one after another. You can select your commands in the script files and run them one at a time or all together. Writing and saving your commands for data cleaning in a script file allows you to better track your work, and you can more easily rerun code later and across new datasets. Tracking your work in this way is a good RDM practice.
Open a new script by selecting the top left icon:
Before importing your dataset, you should set your working directory to the dataset’s location. From RStudio, use the menu to change your working directory to the directory where you saved the sample data file. In the “Session” menu, choose > Set Working Directory > Choose Directory.
Alternatively, in the console window (or script editor), you can use the R function setwd(), which stands for “set working directory”. Forward slashes (/), rather than backslashes, are in the path. So, if you saved the data to “C:\data”, you would enter the command:
> setwd("C:/data")
3. Importing data
You can import data in different formats using R. CSV files are commonly used for numeric data. While they look like standard Excel files, they are simply text files with columns separated by commas. You can export CSV data from Excel using “save as,” and it is commonly used as a preservation format for data management, as it can be read by many programs.
For the next set of examples, we are going to be working with a sample dataset, sample.csv, that is available in Borealis. Please download and save this dataset to a new folder on your computer. The SPSS and Excel files needed for these examples are also available in Borealis.
To load the CSV file, first create a new script file in the script editor. Type the following command in the script to use R’s built-in read.csv command, and then run the script.
> mydata_csv<-read.csv("sample.csv")
The default delimiter of the read.csv() function is a comma, but if you need to read a file that uses other delimiters, you can do so by supplying the “sep” argument to the function (e.g., adding sep = ‘;’ allows a semi-colon separated file).
> mydata_csv<-read.csv(“sample.csv”, sep=’;’)
Please note that “mydata_csv” in the above command refers to the object (data frame) that will be created when the read.csv function imports the file “sample.csv”. Think of the “mydata_csv” data frame as the container R uses to hold the data from the CSV file.
R commands follow a certain pattern. Let’s go through this one from right to left. In above command, mydata_csv<-read.csv(“sample.csv”, sep=’;’), read.csv is a function to read in a CSV file and has two parameters. The first, sample.csv, tells read.csv what file to read in, while the second, sep=’;’, tells it that the data points in the file are separated by semi-colons. After read.csv parses the file, the assignment operator, <-, assigns the data to mydata_csv, which is an object (data frame) created to hold the data. You can now use and manipulate the data in the data frame.
In R, <- is the most common assignment operator. You can also use the equal sign, =. For more information, use the help command, which is just a question mark followed by the name of the command:
> ?read.csv
To read in an Excel file, first download and install the readxl package. In the R console, use the following command:
> install.packages("readxl")
Please note that sometimes packages are dependent on other associated packages to function properly. By using existing packages, programmers can save time when creating new functionalities by using existing functions that were already implemented. However, it may be difficult to figure out if a package requires another package to function. As such, it is good practice to install packages by including the dependencies statement (TRUE tells R the dependencies should be included). By setting the dependencies parameter to TRUE, we tell R to also download and install all the required packages needed by the package that we are trying to install.
> install.packages(“readxl”, dependencies = TRUE)
After the package downloads and installs, use the library() function to load the readxl package.
> library(readxl)
Note that with the library function, unlike the install.package function, you do not put the name of the package in quotes.
Now you can load the Excel file with the read_excel() function:
> mydata_excel <- read_excel("sample.xlsx")
For more information, use the ?read_excel help command.
Statistical Package for the Social Sciences (SPSS) SAV files can be read into R using the haven package, which adds additional functions to allow importing data from other statistical tools.
Install haven by using the following command:
> install.packages("haven", dependencies = TRUE)
After the package downloads and installs, use the library() function to load the package:
> library(haven)
Now you can load the SPSS file with the read_sav() function:
> mydata_spss <- read_sav("sample.sav")
You can import SAS and Stata files too. For more information, use the ?haven or ?read_sav help commands, or visit the https://haven.tidyverse.org/.
Data can also be loaded directly from the internet using the same functions as listed above (except for Excel files). Just use a web address instead of the file path.
Now consider the following command to import data. Since the dataset does not contain a header (that is, the first row does not list the column names), you should specify header=FALSE. If you want to manually set the column names, you specify the col.names argument. In the command below, we asked read.csv to set the column names to ID, Length, Width, Species, and Site. Using colClasses, we can specify what data type (number, characters, etc.) we expect the data contained in the columns to be. In this case, we have specified to read.csv that it should treat the first and last two columns as factor (categorical data) and the middle two columns as numeric (numbers).
Enter the following command into your script editor and run it:
The data is now loaded into mydata_csv. To view the data we loaded, run the following line:
> mydata_csv
R will return the data from the file it’s read in.
ID Length Width Species Site
1  1    4.1   3.5    setosa    A
2  2   14.9   3.0    set0sa    B
3  3    5.0   3.6    setosa    C
4  4     NA   3.9    setosa    A
5  5    5.8   2.7 virginica    A
6  6    7.1   3.0 virginica    B
7  7    6.3    NA virginica    C
8  8    8.0   7.0 virginica    C
The output above shows five columns of data. The first column specifies the row number and is automatically created by R when the data is loaded. The first row displays the column names that we have specified.
One of the first commands to run after loading the dataset is the dim command, which prints out the dimensions of the loaded data by row and column. This command allows you to verify that all entries have been correctly read by R. In this case, the sample dataset should have eight entries with five columns. Let’s run dim to see if all the data are loaded.
> dim(mydata_csv)
After running the command above, R will output the following:
[1] 8 5
The output tells us that there are eight rows and five columns in the loaded data. This matches our expectation, so all the data have been loaded.
You can also run the summary command, which gives some basic information about each column in the dataset. The summary command returns the maximum and minimum values, the lower and upper quartiles (the lower quartile is the value below which 25% of the data in a dataset fall and the upper quartile is the value above which 75% of the data in a dataset fall), and the median for numeric columns and the frequency for factor columns (the number of times each value appears in a column).
> summary(mydata_csv)
      ID        Length           Width            Species  Site
 1      :1   Min.   : 4.100   Min.   :2.700   set0sa   :1   A:3
 2      :1   1st Qu.: 5.400   1st Qu.:3.000   setosa   :3   B:2
 3      :1   Median : 6.300   Median :3.500   virginica:4   C:3
 4      :1   Mean   : 7.314   Mean   :3.814
 5      :1   3rd Qu.: 7.550   3rd Qu.:3.750
 6      :1   Max.   :14.900   Max.   :7.000
 (Other):2   NA's   :1        NA's   :1
From the output, we can see that there are five columns. Since we asked R to read the “Length” and “Width” columns as numeric, it calculated and displayed summary information about the numbers in those columns, such as the minimum, maximum, mean, and quartiles. The information about each column is displayed in rows under the column’s name. For example, in the “Length” column, you can see that the minimum value is 4.1, and the maximum is 14.9. The 1st Qu. shows the lower quartile, which is 5.4, and the 3rd Qu. shows the upper quartile, which is 7.55.
The NA’s row tells us if there are any missing values. In R, missing values are represented by the symbol NA (not available). From the summary output, there are two missing data: one in the “Length” column and one in the “Width” column.
In the “Species” column, which was read in as factors (or categories), each of the rows displays the frequency with which a value appears in the column. From the output, we can see that there are three instances of setosa, four of virginica, and one of set0sa.
Here it is possible to identify recording errors. Instead of setosa, there is one flower mistakenly entered as set0sa. This kind of typo is very common when recording data, but it’s very difficult to find since zero and the letter “o” appear very similar in most fonts.
R uses a basic function, is.na, to test and list whether data values are missing. This function returns a value of true and false for each value in a dataset. If the value is missing, the is.na function returns a value of “TRUE,” otherwise, it will return a value of ”FALSE.”
Note that the dollar sign ($) is used to specify columns. In this case we are investigating if the column “Length” in the CSV dataset contains missing values. As you can see from the output, there is one missing value, so the function returns “TRUE” for that entry in the column.
Outliers are data points that dramatically differ from others in the dataset and can cause problems with certain types of data models and analysis. For instance, an outlier can affect the mean by being unusually small or unusually large. While outliers can affect the results of an analysis, you should be cautious about removing them. Only remove an outlier if you can prove that it is erroneous (i.e., if it is obviously due to incorrect data entry). One easy way to spot outliers is to visualize the data items’ distribution. For example, type the following command, which is asking R to generate a boxplot.
boxplot(mydata_csv$Length)
Figure 9. Outlier in relation to a boxplot.
Boxplots are useful for detecting potential outliers (see Figure 9). A boxplot helps visualize a quantitative column by displaying five common location summaries: minimum, median, first and third quartiles (Q1 and Q3), and maximum. It also displays any observation that is classified as a suspected outlier using the interquartile range (IQR) criterion, where IQR is the difference between the third and first quartile (see Figure 10). An outlier is defined as a data point that is located outside the whiskers of the boxplot. In the above boxplot output, the circle at the top represents a data point that is very far away from the rest of the data, which are mostly contained in the “box” of the plot.
Figure 10.Interpreting a boxplot.
Another basic way to detect outliers is to draw a histogram of the data. A histogram shows the distribution of the different values in the data. From the histogram below, it appears there is one observation that is higher than all other observations (see the bar on the right side of the plot), which is consistent with the boxplot. The following command will generate a histogram:
> hist(mydata_csv$Length)
Figure 11.Histogram of length.
> summary(mydata_csv$Length)
Min. 1st Qu. Median Mean 3rd Qu. Max. NA's 4.100 5.400 6.300 7.314 7.550 14.900 1
From the summary output, one value, 14.90, for length seems unusually large, although not impossible according to common sense. This requires further investigation. Such outliers can significantly affect data analysis, so it’s important to understand their validity. Removing outliers must be done carefully since outliers can represent real, meaningful observations rather than recording errors.
Now that we have done some preliminary inspection on the raw data, suppose the raw data have several issues that need to be fixed. These issues include:
Redundant “Site” column
Typo in the “Species” column
Missing values in the “Length” and “Width” columns
Outlier in the “Length” column
With these issues in mind, we can move on to the next stage and start cleaning the data.
5. Cleaning the data
First, let’s start by dropping an extra column. Using the data above, suppose we want to drop the “Site” column. As seen in the output of the summary command, “Site” is the fifth column in the dataset. To drop this, we can run the following command:
> mydata_csv <- mydata_csv[-5]
The above command uses the square brackets to specify the columns of the original data. By using a negative number, we tell R to retrieve all columns except for the specified column. In this case, the “Site” column is the fifth column. Since we want to remove the fifth column but keep all other columns, we can use -5 in the square brackets to tell R to fetch all columns except for the fifth column. Then, by reassigning the new data that we fetched to mydata_csv, we’ve effectively deleted the fifth column.
To verify that the column has been successfully removed, we can use the dim command, as seen before.
> dim(mydata_csv) [1] 8 4
From the output, we can see that the data has four (versus five) columns now.
Next, it’s time to clean the typos. In this case, since you know that the typo is set0sa and it should actually be setosa, you can replace all matching cells using the following command:
ID Length Width Species 1 :1 Min. : 4.100 Min. :2.700 set0sa :0 2 :1 1st Qu.: 5.400 1st Qu.:3.000 setosa :4 3 :1 Median : 6.300 Median :3.500 virginica:4 4 :1 Mean : 7.314 Mean :3.814 5 :1 3rd Qu.: 7.550 3rd Qu.:3.750 6 :1 Max. :14.900 Max. :7.000 (Other):2 NA's :1 NA's :1
Note that the equality operator, “==”, selects all instances of “set0sa” (in this case, one instance) and “=” assigns it to be “setosa”. Using two equals signs to test for equality and a single equals sign to set something equal to something else is a common programming convention.
You can see that there are now zero entries in the “Species” column with the name set0sa from the summary() output. The data have been cleaned for this typo.
There are several ways to deal with missing data. One option is to exclude missing values from analysis. Prior to removing NA from the “Length” column, the mean() function returns NA as follows:
> mean(mydata_csv$Length) [1] NA
This is done because it is impossible to use NA in a numeric analysis. Using na.rm to remove the missing value NA returns a mean of 7.314286:
> mean(mydata_csv$Length, na.rm = T)

               [1] 7.314286
Exercise 2
Check if there are any outliers in the “Width” column of sample.csv by using a boxplot, then calculate the mean of length by removing the outliers.
Data cleaning procedures are important foundations for successful data analysis and should be performed before analyzing data. In this chapter, we have only scratched the surface of data cleaning issues and fixes that researchers need in order to create clean data using Excel/Google Sheets and R language. Extensive libraries of data manipulation functions exist, and they offer functionalities that might help you in your data cleaning process. Additional R documentation can be found at the following sites: https://cran.r-project.org/manuals.html and https://cran.r-project.org/web/packages/available_packages_by_name.html.
Key Takeaways
General procedures in preparing for data cleaning are making a backup, understanding the data, planning the cleaning process, and choosing appropriate tools.
Excel functions can be used to perform many basic data cleaning tasks.
The R programming language is a useful and free software package that can be used for more advanced cleaning procedures.
Acknowledgment
The authors thank Kristi Thompson and other editors whose constructive comments have improved this chapter.
About the authors
Dr. Rong Luo
Dr. Rong Luo is a learning specialist in the Academic Data Center at the University of Windsor’s Leddy Library. Rong’s research interests have been focused on statistical modelling, missing data imputation, social survey data analysis, and information literacy skill assessment. She uses both quantitative and qualitative designs for her research projects.
Berenica Vejvoda
Berenica Vejvoda is the Research Data Librarian at Leddy Library where she is responsible for the coordination and management of Research Data Services. She is also responsible for strategic direction and implementation of research data management services for the University of Windsor as part of a campus-wide initiative. Berenica also serves as the Academic Director for the University of Windsor’s Branch Statistics Canada Research Data Centre. Berenica’s research interests focus on social determinants of health for marginalized populations with an intersectional lens as well as data inclusivity principles as applied to research data management.
A Glimpse Into the Fascinating World of File Formats and Metadata
9
Émilie Fortin
Learning Outcomes
By the end of this chapter you should be able to:
Understand what a sustainable file format is.
Properly choose a file format that meets your needs.
Understand the usefulness of metadata.
Identify the different types of metadata.
Introduction
The research data lifecycle always includes a preservation stage, sometimes referred to as archiving or retention. This stage is linked to data reuse because no one can reuse damaged or inaccessible data. The chapter, “Digital Preservation of Research Data,” addresses the issue of digital preservation; this chapter focuses on two elements that enable data retrieval and reuse: file formats and metadata.
File Formats
Pre-assessment
Answer the following questions as honestly as possible (Yes, No):
Are you having trouble opening files that you created more than ten years ago?
Do you think that ten years from now you will have difficulty opening files you created this year?
Do you think a PDF file is a perfect preservation format?
Do you wake up at night wondering if your great-grandchildren will still have digital photos of you?
Do you love interactive apps and want all your projects to be as connected as possible?
If you answered yes to more than two questions, this section should help you.
What is a File Format?
Digital file formats are designed according to predefined rules that outline their structure and organization. These principles are usually listed in a specification document that provides details on the subdivisions, encoding, and internal relationships that allow a format to be constructed and validated. A format specification indicates the boundaries between bit sequences. These bit sequences can represent, for example, a character, an operation to be performed (machine instruction), or a colour selection.
In summary, a file format is a specific and conventional series of 1s and 0s used to recognize a format.
From the moment you use a computer media, no matter what you use it for, keep in mind that you are using, creating, or modifying formats.
What is a Sustainable Format?
No format is truly sustainable. Those that are deemed acceptable for long-term preservation are formats that remain accessible over time despite technological developments. A good format today can become obsolete in two, five, or ten years.
Here are some criteria for judging the sustainability of a format:
complexity
backwards compatibility
encoding
dependency
openness
metadata
property
usage
evolution
protections
Complexity. A format must provide good capabilities, without being too complex, or it will be difficult to maintain over time due to its many features. The complexity of a format can be defined by its readability by humans, its level of compression, and the variety of its functionalities. The more effort needed to decipher a format, the more likely it will not be fully understood.
Backwards compatibility. Is a format known for its backwards compatibility? When a new software version is released, how feasible is it to open formats created with older versions of the software? Are the generations of the same format very different from each other?
Interesting fact: Did you know that Adobe provides backwards compatibility of PDF formats up to version 1.3 (released in 1999) only?
Encoding. In the Western world, formats will likely rely on ASCII or Unicode encoding. If you use other symbols or non-Latin characters, encoding is important because you want the letters and symbols to display properly no matter who opens your files.
Dependency. This is a question of the format’s dependence on its software, but also on a specific technology or hardware, on other files, or on its computer environment. Can the format be opened only by specific software? Is the format a container in which we find other formats (ZIP type compression format, video embedded in a text file, video file with a soundtrack, etc.)? Does the format need to connect to your environment to work (for example, an interactive book that is connected to your phone’s camera)?
Resources external to your file can be lost over time, so the more dependencies a format has, the harder it will be to preserve in its current form.
Openness. An open format is preferable.
Examples of open formats: Office files with an X (e.g., XLSX, DOCX), PDF, TXT, JPG, PNG, CSV.
Interesting fact: Some extensions sometimes hide files in open formats. For example, a script file may have extensions like HTML, XML, SC, but they are actually plain text formats.
Interesting fact: Some open formats have become standards over time. For example, PDF and PDF/a are ISO standards.
Metadata. This refers to the file’s internal metadata. Think about the file properties that you can access in a software application and through your operating system.
Identifying a format is a first step but documenting the content and the container as much as possible within the format is also very useful. The more a digital object is documented, the better it can be understood in the years to come. A file format that can embed metadata is advantageous, because if the file no longer opens, it is sometimes possible to retrieve valuable information thanks to its metadata (e.g., title, creator, software used to save the format). For more details on this, please see the “Metadata” section.
Property. A proprietary format belongs to a legal entity. It may or may not be open. Its evolution is controlled by its owner. These formats are generally attached to specific software. When the formats are non-proprietary, their evolution is controlled by a community of users and they are for the most part open.
Examples of non-proprietary formats: MKV, TXT, XML, CSV, PNG
Examples of proprietary and open formats: Office files with an X (e.g., DOCX, XLSX ), PDF, RAR
Examples of proprietary formats: AutoCAD, PSD, WMA
Usage. If only ten people use a format, even if it is open and non-proprietary, it will disappear. On the other hand, an extremely popular proprietary format is very unlikely to die out in the next few years.
If a closed, proprietary format is adopted as a standard by a library, archive, or research community, there is a good chance that the format will live on thanks to its popularity. However, its development needs to be closely monitored.
Evolution. The format should follow a continuous improvement cycle but avoid excess. Systems change, and software and formats must evolve; a static format is not necessarily better than a format that is in development. However, releasing a series of new versions of a format within a limited time frame can be unwise, as frequent changes threaten long-term accessibility.
Protections. There are several technical file protection measures. For example, encryption and the use of a password are good methods for protecting sensitive data, but they are not compatible with long-term preservation. Just imagine the impact that losing a password can have!
Similarly, certain measures to protect the intellectual property of a file, such as locks on e-books, may compromise access to content.
Interesting fact: Some platforms allow for restricted access to files by applying permissions checks. This method is far preferable to locking the files themselves.
How to Choose a Format for a Research Project?
The criteria that define a sustainable format are important, but it is essential to choose them in ways that meet your project needs. It is not necessary to comply with all the criteria. Also, if your area of research requires you to use a format that does not meet any sustainable format criteria, you don’t need to refrain from using it; just be aware that there will be an impact on data preservation.
Here are some questions you can ask yourself to help you choose the best format:
Do you need to preserve your data long term? If you plan to delete all your data in five years and not share it, think only of your own immediate usage needs.
If you use research instruments/equipment, do you have a choice of format? If so, try to opt for a sustainable format if doing so would have no impact on your research.
Is the data’s appearance or layout important, or just the data itself? If the data layout is not important, you can opt for a simpler format. For example, a textual document stored as a PDF helps preserve the look and feel of a document, but content reuse is complex. However, if the text document is converted to TXT format, the formatting is lost, but the content can easily be reused.
Are the data independent or linked to other data? If your data are linked to equations or other files, you must preserve those links.
Do you need to control for file size? If you are limited on space, you may not have a choice but to opt for compression. Try using lossless compression.
In your discipline, is there a format that is used by most of your colleagues and that is considered essential?
In some cases, it is possible to keep data both in its original format and in a sustainable format, but this duplication must have a purpose. For example, your data may serve two very different communities that do not use the same level of technology. However, you should avoid the confusion that two versions of the same dataset could cause.
Another option could be to keep only the original format and to generate lighter copies of the files when necessary. This option is risky in the sense that it involves a dependency on software to read the original format.
You should also keep in mind that unreadable data in ten years will no longer be useful to anyone, including yourself.
Most national libraries publish a list of recommended formats. I’ve included a number of these lists in the Additional Resources section of this chapter; it may be useful to consult them. The lists include some of the formats that are generally accepted as sustainable in 2023.
Databases
A database involves values, but also a structure and relationships between values. The most commonly used databases at the time of writing are Microsoft Access, Oracle, MySQL, and PostgresSQL. When looking at long-term preservation of databases, one must assess future needs: is the database still in use? Will the preservation of values alone be sufficient? Must the structure of the database and relationships between data also be documented?
Databases are complex to preserve given their structure and the evolution of their content. It is important to define needs before choosing a preservation format.
Some recommended formats include:
Formats with value separators (CSV, TSV, TXT): preserve data, but not relationships or formulas. Especially useful for simple and small databases.
Database Preservation Format (SIARD 1.0 and 2.0): an open format established for preserving databases but only usable for certain types of databases.
Lightweight Relational Database Format (SQLITE): a simple format used for relational databases.
Tabular Data
The main challenge with these formats is dealing with formulas, macros, and embedded content. It should also be remembered that exporting a tabulated file to cloud computing software, or vice versa, can cause losses or errors.
Note that SPSS’s SAV format is sometimes recommended, although its documentation is unofficial and backwards compatibility is not guaranteed.
Some recommended formats include:
Data with Delimiters (CSV, TXT, TSV): simple files, but there is a loss of formulas and cell relationships.
Microsoft Excel (XLSX): documented and open format, but not recommended by some repositories, as it is a complex proprietary format. In some cases it remains unavoidable. If used, be sure to create a file with Office 2013 or later.
OpenDocument (ODS, FODS): usually associated with LibreOffice, a software suite developed as an open equivalent of Microsoft software. Structure based on XML. Version 1.2 is certified as an ISO standard; version 1.3 has achieved standard status.
Text
A text document can be very simple, but it can also bring about some challenges. For example, using cloud-based word processing software makes collaboration much easier, but exporting these documents to save them locally can sometimes affect their formatting and hyperlink functionalities. Also, you should ask yourself which versions to keep; it is irrelevant to preserve all revisions and comments to a text. A solution would be to preserve some intermediate versions along with the final version.
If the text document contains embedded objects, such as an image or a table, the selected format may vary. The choice of fonts can also affect the preservation of a textual document.
The text might also refer to other documents to help contextualize or better explain the content. These relationships are important and must be maintained.
The most appropriate format is the one that will retain the most functionalities from the original document while allowing for long-term access.
Some recommended formats include:
OpenDocument (ODT, OTT): usually associated with LibreOffice, a software suite developed as an open equivalent of Microsoft software. Structure based on XML. Version 1.2 is certified as an ISO standard; version 1.3 has achieved standard status.
Plain text (TXT): no page layout, but easily accessible and does not depend on any program, which is why it is highly recommended for README files.
PDF and PDF/a: common format, often used for long-term preservation. Ideally, make sure to only keep versions 1.3 and later.
Electronic Publication (EPUB): an open format, widely used for digital publishing.
Interesting fact: Commercial EPUB files may contain built-in protections to protect intellectual property by preventing copying and sharing. These digital locks are incompatible with long-term preservation.
Images
Most digital preservation experts agree on the most secure image formats to use. The formats mentioned below are raster files; that is, they consist of a series of dots called pixels.
The quality of a format can vary according to several factors such as resolution (the best known), but also colour space or colour depth. Often, the higher the quality of an image, the larger the file.
The RAW proprietary format is not recommended for long-term preservation. Conversely, an image created with a compressed format (e.g., GIF, JPG, BMP) could be preserved as is. Ultimately, technological, human and financial needs and resources need to be assessed before choosing an image format.
Some recommended formats include:
Tagged Image File Format (TIFF): most used format for preserving images, but heavy.
Joint Photographic Experts Group 2000 (JP2): lighter than TIFF, but less widely used.
Joint Photographic Expert Group (JPG): widely used, but the image is compressed.
Portable Network Graphics (PNG): uses lossless compression. Fairly commonly used, but not always supported by software.
Audio
An audio format is a container with one or more audio data streams.
Several characteristics need to be considered that will influence the rendering and authenticity of the sound: channels, compression, number of bits per sample, number of samples per second, etc. If the original file is already compressed (e.g., MP3, AAC), it may not make sense to migrate it to another format.
Note that MP3 is a compressed format not generally recommended for long-term preservation, but its widespread adoption makes it a fairly reliable format if the original file was created that way.
Some recommended formats include:
Free Lossless Audio Codec (FLAC): file with lossless compression, lighter format than WAVE.
PCM WAVE (WAV): quality format used by several national libraries during digitization.
Broadcast WAVE (BWF): allows the addition of metadata in the files.
Ogg Vorbis (OGG): open format with better compression than MP3, but less popular.
Video
Video formats are complex, ever-changing, and there is no consensus on any one format in the digital preservation community.
Video formats are generally containers with images or streams of video and sound data. Several characteristics (e.g., colour, compression, sound) can influence their long-term preservation. More than one format can be used for a project depending on the different project goals or outputs, which could range from video creation, to editing, to distribution.
The biggest challenge is balancing file weight and file quality.
Some recommended formats include:
MP4 with H.264: compressed format mainly used for broadcasting; very widespread.
QuickTime (MOV) or uncompressed Audio Video Interleaved (AVI) 4:2:2: very heavy formats, but good quality.
Matroska with FFV1 codec (MKV): standardized format not overly compressed.
Material Exchange Format with JPG 2000 (MXF): recommended by some national libraries, well documented, but little used by the public.
Digital Picture Exchange (DPX): very heavy format used when digitizing film stock.
Geospatial Data
Geospatial data are also covered in the chapter, “Geospatial Research Data in Canada: An Overview of Various Projects.” These data usually consist of a series of files that complement each other. They can be intrinsically linked to the geographic information system that uses them. Metadata, coordinate referencing systems, and coordinate precision (i.e., how close an observed and recorded value is to the actual value) must be preserved with the data.
Listing recommended formats for the long-term preservation of geospatial data is almost impossible given their complexity (ie., several types of different structures, many proprietary formats). There is no consensus on this and keeping the original format may be the best solution.
Some recommended formats include:
Geospatial Tagged Image File Format (GEOTIFF): an open format that allows geographic coordinates to be added to an image.
Geographic Markup Language (GML): an open format based on a standard, but it is complex.
Keyhole Markup Language (KML, KMZ): XML language that can be associated with several other files that must also be archived (avoid using hyperlinks). Open and widely used format.
ESRI Shapefile (SHP SHX, DBF, PRJ, SBX, SBN): proprietary, but open and widely used format.
Digging Deeper: How to Identify a Format?
To identify a file format, it is usually sufficient to look at the final section of the file name, which is its extension. For example, the file “my-notes.xlsx” is an Excel file while “my-photo.jpg” is an image. This method has limitations since an extension can be modified, voluntarily or not, or it may be completely unknown. Some operating systems are even configured by default to hide the extension of files, which can complicate the task.
The best way to identify a format is by using its signature. A file signature is a series of bits that are strung together in a predictable fashion at the beginning, end, or at both ends of a file.
A tool like PRONOM, widely used in the digital preservation community, works by saving the start and end signatures of a file (known as Beginning of File (BOF) and End of File (EOF)). This allows a user to retrieve the unique identifier of a format. As an example, the signature x-fmt/398 identifies JPG version 2.0. Knowing a format will be helpful to those who want to view datasets and better understand how to open them.
Raw data from research, devoid of metadata, are interesting, but not meaningful to most people. It is easy to see that there is a large gap between the raw data extracted during a research project and their meaning and, thus, usability for humans.
If a geneticist wants to describe the raw data above, she could add the following description, which would be the first level of metadata:
A second level of metadata would be the description of the dataset that this sequence is a part of: genetic sequencing, in this case, of Carpodacus mexicanus, a species of bird.
This is a nucleotide sequence of Carpodacus mexicanus (clone 6b). (A = Adenine, G = Guanine, C = Cytosine, T = Thymine: nucleic acid bases).
A third level of metadata would make it possible to better characterize the previous metadata by standardizing the nomenclature used, which will facilitate search and retrieval in other resources, such as article databases or institutional repositories:
House finch – Genetics
Nucleotide sequence
A fourth level would link this metadata to other relevant information, such as an image.
The main goal of metadata is to describe and enable retrieval. Any metadata present should facilitate the tasks performed when using general or academic search engines, which are:
Finding: finding resources that match the search criteria.
Identifying: to establish the context of the data and to confirm that the resource that is described corresponds to the resource that is sought or to be able to distinguish between two or more resources with similar characteristics.
Selecting: selecting a resource that is relevant to the needs of the searcher.
Metadata necessary for preservation are those that ensure the authenticity and long-term accessibility of digital resources and that allow recovered files to be accessible, readable, and intelligible. Metadata need to be managed and discovered independent of the systems they were created with.
Metadata Normalization
Some metadata can be standardized, such as the names of those responsible for a research project, the methods of data collection and analysis, variable titles, subjects covered by the research, as well as temporal or geographical coverage. Other types of metadata will adopt less precise description rules. They aim to standardize the display of the resource being described. This includes, for example, the title attributed to a research project or an abstract describing a dataset.
The more metadata are standardized, the more they contribute to the FAIR principles (detailed further in chapter 2, “The FAIR Principles and Research Data Management”) and the more they allow for the Findability, Accessibility, Interoperability, and Reuse of the resources they represent. When describing a resource, whether it is data or a dataset, it is necessary to select the most useful metadata to maximize time and effort.
Several methods can be used to standardize metadata. However, there is often terminological confusion, as certain terms are used to incorrectly describe varying concepts.
Metadata Schemas
To fully understand metadata schemas, imagine an online form with empty fields to fill in. The schema hides behind the form and gives meaning to the information added to each field.
Some schemas specify the syntax with which elements should be encoded, while others, such as Dublin Core and Data Documentation Initiative (DDI), only provide fields for storing information without giving any indication as to how the content should be entered or its syntax.
Let’s take the house finch as an example. A birdwatcher wants to enter a sighting of the bird in a repository that uses the Darwin Core metadata schema. He will need to fill in the following fields:
Fields to fill
Darwin Core elements behind the scenes
Time of sighting
eventDate
Observer
identifiedBy
Scientific name
scientificName
Kingdom
kingdom
Class
class
Order
order
Family
family
Genus
genus
There are many schemas, some are general while others are disciplinary. A standardized schema which is widely used can be machine-readable, which increases the visibility of data and the possibility of its reuse. However, these advantages are lost when creating an in-house metadata schema.
In summary, a metadata schema serves as a structure and a container for information about datasets and, to some extent, adds to its meaning.
Description Rules
Description rules make it possible to standardize, normalize, and structure information relating to datasets. These rules will prescribe the transcription of information, the use of capital letters, as well as element syntax or order. Rules are schema independent and can be used in any data repository.
To illustrate, let’s use the example of the finch-enthusiast birdwatcher. He wants to know if this species has been sighted in his area on a specific date. He looks up three repositories that use the Darwin Core schema. Searching with the date October 10, 2021, he finds results in only one of the repositories. Why? Because repositories use different description rules for dates. One has no requirements, being the repository where the October 10, 2021 entry is found; the other asks for the ISO 8601 standard, which is YYYY-MM-DDTHH:MM:SSZ and where the date is indicated as 2021-10-10; and the last one requires the form DDMMYYYY and where the desired entry is represented by 10102021.
Clear description rules are also very useful for personal names, especially in the case of common names. It’s important to avoid the use of initials, homonyms, or pseudonyms. Depositing data gives visibility to researchers, but to do this, it is necessary to be able to identify, without ambiguity, the person responsible for the data.
A name is sometimes not enough to distinguish between people, and this is why it is recommended to also use Persistent Unique Identifiers (PID), like ORCiD.
Controlled Vocabularies
Controlled vocabularies standardize indexing and make it easier to find and locate information. It is a set of terms recognized, standardized, and validated by a group or community of practice used to index or analyze the content of a resource.
If several terms refer to the same concept, only one of them will be chosen and identified as the “preferred term;” all others, considered as possible synonyms, will be mentioned as “rejected terms.”
Let’s go back to the birdwatcher who, this time, is looking for information on the finch in an English-language data repository. The data in this repository is indexed with free vocabulary, but also with FAST (Faceted Application of Subject Terminology). To retrieve all the information on the species, the birdwatcher searches for the term “finch” and discovers that “house finch” is the term chosen by FAST. With this term, he can successfully search the repository and retrieve all available data.
Thesauri and subject heading directories are the most common and well-known examples of controlled vocabularies. There are encyclopaedic vocabularies, but also specialized vocabularies specific to certain disciplines, e.g., ERIC, a thesaurus that specializes in education, or WORMS, a catalogue of the names of marine organisms.
Several of these vocabularies are multilingual, or process linguistic equivalents, which is a valuable contribution for interoperability.
Digging deeper: Ontologies
An ontology is a theoretical representation of a domain of knowledge with concepts linked by semantic and logical relations. It includes vocabularies and definitions, and specifies how concepts are interrelated. An ontology makes it possible to establish a set of relations and to describe specific situations in a given domain. It also imposes a structure on the domain and limits the possible interpretations of terms. Put simply, an ontology makes it possible to offer a common language to blocks of information linked to each other. It is to metadata what grammar is to language.
One of the main advantages of using an ontology is the interoperability, reuse, and sharing of metadata. The main difference between an ontology and a controlled vocabulary is that the controlled vocabulary proposes semantic relations between the elements that compose it, while the ontology will propose functional relations making it possible to describe situations precisely.
For example, in a controlled vocabulary, “house finch” is the preferred term. It is related to “Carpodacus,” which is the general term, as well as “Mexican finch” and “Carpodacus mexicanus,” which are two rejected terms. In an ontology, “house finch” could be linked through the relationship “habitat” to the terms “suburb” and “semi-desert.” The ontology could also point to the “feeding” relationship to make a link between the finch and other “granivores” and “insectivores.”
Types of Metadata
There are various ways of categorizing metadata. In this chapter, the following groupings will be used: descriptive, structural, technical, access, and preservation metadata. The last three types of metadata in the list are less straightforward to understand. They are introduced below for those interested in gaining more advanced knowledge on the topic.
Beyond these categories, metadata can also be classified by their source (internal, external), their mode of creation (manual, automatic), their status (static, dynamic), their structure (structured or not), and other characteristics. For more information on this, please consult the resources at the end of this chapter.
Descriptive Metadata
As their name suggests, descriptive metadata are used to describe a resource’s content and ensure that it can be found, whether by humans or by machines. The title of a work, the name of its creator, and the date of creation are examples of descriptive metadata found in data repositories, library catalogues, or databases.
In the case of research data, descriptive metadata generally refer to fields to be filled in data repositories. In addition to metadata, in cases where the data are not deposited in the repository, a text file, such as a README file, can be used to support descriptive metadata.
Project metadata describe the “who, what, where, when, and why” of a dataset, which provides context for understanding the purpose of data collection, methodology, and use.
Dataset metadata are more granular. They describe and contextualize the data in more detail, including, for example, variables, units of measurement, and observations. This information may also be present with the data themselves.
The rules to follow for descriptive metadata are not insignificant. The better a dataset is described, the more it will be identifiable and the easier it will be to attribute credit to the right people. In this sense, the use of unique identifiers such as DOIs and ORCiDs as well as controlled vocabularies such as FAST and its French-language equivalent, RVMFAST, makes it possible to disambiguate people and digital objects. Metadata standardization also supports interoperability between systems.
The best way to harness the power of descriptive metadata is to:
use unique identifiers where possible.
use existing metadata schemas well established in your research community.
standardize metadata where possible (names, subjects, geospatial coordinates, dates, etc.), ideally with controlled vocabularies.
follow the advice suggested by repositories for completing their metadata fields, i.e., mandatory fields, recommended fields, and optional fields.
Interesting fact: Many files have descriptive metadata embedded in their format. Have you ever looked at the file properties attributed by a software application or your operating system? You might be surprised! Sometimes a software application automatically fills in the “author” information with the name of the owner of the software or inserts geographic coordinates into the file of a photo taken with a cellphone!
Structural Metadata
Structural metadata help establish links between and within files. It is as much about the physical structure of a file (the links between different pieces of content) as it is about the logical structure of a document (the links between files). For example, you might have an article in a PDF format and the associated graphics in a different file, in DOCX. You might also have information about where text and images are located on a page, and information about page order.
Some of these metadata are generated automatically, others must be entered manually. They can be useful if you have to switch from a complex format to a simple format and doing so would require breaking down your data. You may need to describe the links between your files to represent the original format. This information can be noted in a text file or by using code.
If your files are not independent or they refer to other files, think about the structural metadata. They will allow you to fully understand your data.
Digging Deeper: Other Types of Metadata
Descriptive and structural metadata are fairly easy to understand, even though their exact definitions may be debatable. However, definitions for technical, access, and preservation metadata are more ambiguous. Sometimes these metadata are grouped together under the term “administrative metadata.” The divisions below are used for explanatory purposes only.
Most of the metadata below are created automatically within files and it is not essential to know them. It is possible to modify some of this internal metadata and indeed, some software applications allow their extraction to keep them separate. However, good knowledge of formats and metadata is recommended before attempting to do this.
As mentioned previously, a format change can be positive for the long-term preservation of files. Such a conversion may impact the file’s internal metadata. Extracting these metadata from the original format and keeping them alongside the digital object allows for the provenance and authenticity of the files to be documented.
Technical Metadata
Technical metadata are highly format-specific and mostly always embedded within files. They document the creation of the file (software used, version, operating system, date of creation and last modification, etc.) and the characteristics of the digital objects which vary according to the type of format.
Examples of technical metadata include:
For text: encoding, structure in XML …
For images: resolution, colour profile, encoding depth …
For sound: bitrate, codec, sample rate …
For video: number of frames per second, colour profile, duration …
For web content: format declared in the header, server response collected …
Extracting technical metadata helps prove that a format is what it claims to be. It provides information about an unknown or corrupted digital object.
Access and Use Metadata
Access and use metadata include information that allows the research community to download data and reuse it legally.
To avoid any rights violations, these metadata provide information on the provenance, the possibilities of access (open access, embargo, confidentiality form, etc.) and of use (free, with citation, read-only, etc.). It may also include digital signatures. These metadata make it possible for repository administrators to carry out preservation actions in a legal manner.
Preservation Metadata
Preservation metadata are usually tied to specific metadata schemas like METS or PREMIS and represent the actions performed on files to preserve them.
They include everything related to the integrity and authenticity of a digital object (see the chapter, “Digital Preservation of Research Data,” for more on this topic). Minimally, a checksum should be calculated. With preservation metadata, you can trace all changes made to a file such as format changes, checksum checks, and physical media moves, as well as those who made the changes.
Conclusion
The title of this chapter refers to a fascinating world for good reasons. We have only offered a preliminary survey into the world of file formats and metadata. Be assured, however, that it is not essential to master all the secrets of file formats, controlled vocabularies, or metadata schema to ensure accessible and reusable data in the long term.
The choice of a format depends on several factors, but mainly on the needs and capacities of those who use them.
The best research data cannot be found and understood, including by those who created them, without quality metadata. Quality is preferred over quantity.
View formats and metadata as allies and not obstacles; you may find they are, at times difficult, but always reliable friends!
Additional Readings and Resources
Corti, L., Van den Eynden, E., Bishop, L., Woollard, M., Haaker, M., & Summers, S. (2019). Managing and sharing research data: a guide to good practice (2nd ed., vol. 1). Sage.
Centre de coordination pour l’archivage à long terme de document électroniques. (n.d.). Catalogue des formats de fichiers pour l’archivage. https://kost-ceco.ch/cms/kad_main_fr.html
Bascik, T., Boisvert, P., Cooper, A., Gagnon, M., Goodwin, M., Huck, J., Leahey, A., Stathis, K., & Steeleworthy, M. (2021). Dataverse north metadata best practices guide v 3.0 (Version 3). Zenodo. https://zenodo.org/record/5668945
Canning, E., Brown, S., Roger, S., & Martin, K. (2022). The power to structure: Making meaning from metadata through ontologies. KULA: Knowledge Creation, Dissemination, and Preservation Studies,6(3). https://doi.org/10.18357/kula.169
Digital Research Alliance of Canada. (2021). RDM and metadata for discovery: What’s in it for researchers? [Video]. YouTube. https://youtu.be/4fjPBSKMPlw
Supporting public procurement in Europe – 4 RDA Recommendations for open data sharing now published as ICT Technical specifications. (2017, July 24). RDA. https://www.rd-alliance.org/node/57123
Émilie Fortin has been Research Data Management and Digital Preservation Librarian at Université Laval since 2021. Prior to this, she was the librarian responsible for digital production, preservation and conservation of collections. She completed her Master’s degree in Information Science at Université de Montréal, spending a year at the Haute école de gestion in Geneva. She is involved in the Digital Research Alliance’s Preservation Expert Group as well as the Partenariat des bibliothèques universitaires du Québec (PBUQ) working group on research data management, and is also a regular participant in iPRES conferences on digital preservation. ORCID: 0000-0002-9717-6840
Supporting Reproducible Research with Active Data Curation
10
Sandra Sawchuk; Louise Gillis; and Lachlan MacLeod
Learning Outcomes
By the end of this chapter you should be able to:
Understand the role of active data curation within the broader domain of Research Data Management.
Identify key features of active data management tools, such as versioning, scripting, software containers, and virtual machines.
Assess an example of a reproducible dataset in a software container.
Introduction
This chapter will focus on the interoperable and reusable aspects of the FAIR model (Findable, Accessible, Interoperable, Reusable), which was introduced in chapter 2, “The FAIR Principles and Research Data Management,” providing you with the confidence and skills to engage in active data curation.
Active data curation during ongoing research creates data that are FAIR: Findable, Accessible, Interoperable, and Reusable (Johnston, Carlson, Hudson-Vitale, et al., 2017; Wilkinson et al., 2016). The term active describes curatorial practices that happen during the data collection, analysis, and dissemination stages of research. Data curation involves managing research data that has been selected or is required to be deposited for long-term storage and preservation (Krier & Strasser, 2014). Conventionally, curation is tackled toward the end of a project, often after the analysis is complete. Excellent resources, like the “Dataverse Curation Guide” and the Data Curation Network’s CURATED workflow, provide invaluable guidance on curating once the project has ended its active phase (Cooper et al., 2021; Johnston, Carlson, Kozlowski, et al., 2017). There is value in working on curation as the project is happening. Doing so catches errors before they become catastrophic and gives data a better chance of being well described and contextualized (Sawchuk & Khair, 2021).
This chapter will provide guidance on the tools and techniques that facilitate the curation of research data during the active phases of research. Like Cooper et al. (2021), we know that capacity to provide curation support varies across Canadian institutions, and that the role of libraries is often to provide education and awareness of best practices. The actual day-to-day management of the research and its associated data is the responsibility of the researchers who conduct the work.
We discuss strategies for implementing good data management practices, with a focus on activities that help improve data interoperability and reproducibility. We also consider best practices for the curation of research data, including tools for communication and collaboration. While the tools covered in this chapter are primarily used to support computational research, the reproducibility principles we describe will have applications in all disciplines.
Platforms
Choosing a data storage platform isn’t exactly curatorial. However, the implications of choosing one storage platform over another do have important curatorial consequences.
Storage options are covered more fully in chapter 5, “Research Data Sharing and Reuse in Canada,” but here is a brief review. Your platform choices fit into three categories:
Local storage is either built into or connects directly to your device, and includes hard drives, and USB jump drives.
Network attached storage (NAS) systems connect devices within a local network. Examples include departmental, faculty, and university servers.
Cloud storage is internet-based and provided through a third party. Examples include Dropbox, Google Drive, OSF, and OneDrive.
Table 1 outlines advantages and disadvantages of each of these main platform types. There are use-cases for each, but all else considered, cloud platforms do offer compelling curatorial features.
Table 1. Storage platform comparison.
Advantages
Disadvantages
Local
No internet connection required
Low cost
Protection against unauthorized access
Susceptible to loss, corruption, and damage due to hardware failure, natural disaster (fires and floods), and theft
Does not facilitate collaboration or file sharing
Network
Collaborative workspace
Remote accessibility
Automated backups
Good security
Internet dependent
Inaccessible to external partners
Expensive
Cloud
Automated version control and file recovery
Automated backups
Collaborative workspace
Remote accessibility
Privacy policies vary by provider
Lack of control over data storage location
Risk of hacking, malware, and phishing
Personal health data is subject to legislation preventing storage outside of Canada. Do not store personally identifying participant data on cloud storage platforms that are not institutionally supported.
Guidelines for Data Storage
If appropriate, consider using a cloud platform and backing up your data on an institutional network. Most cloud storage platforms have automatic versioning features. Automation means less work for you and less opportunity for human error. Important files can be copied to institutional networks, which are backed up regularly, further guarding against data loss that could occur on local drives.
Every time you edit in a cloud environment, a new version of your file is saved along with information about the file’s provenance:
who made the edit
when the edit was made
what those edits were
Choose an institutionally supported solution. By choosing an institutionally supported solution, you’ll also have access to local tech support, training, and the reassurance that comes with knowing it’s been evaluated. Choosing a well-supported solution is a good way to increase the probability that your data will be accessible and usable in the long term. In the Canadian context, this might mean using Microsoft Office 365, which many universities support.
Use an electronic lab notebook (ELN) or project management tool. ELNs are online tools built off the design and use of paper lab notebooks. At their most basic, they provide space to record research protocols, observations, notes, and other project-related data. Their electronic format supports good data management, bypassing issues of poor handwriting and data loss due to physical damage. ELNs also provide data security and allow collaboration. This can be especially helpful if you are working in the private sector, or in situations where team members come from multiple institutions. You might look beyond institutional solutions to collaborative tools like the Open Science Framework (OSF), which is free to use, open source, and provides file provenance detail. It can be used as a collaborative data-sharing space, or as an ELN.
Data Security
Address anticipated risks in your Research Data Management (RDM) plan and take care to ensure the measures you outline are feasible to implement and relative to the risk associated with your data. If you are working with personal health data, for example, you will need to exercise more care than someone working with open source code. Similar considerations must be taken when working with data about marginalized or racialized groups. Your choice of storage platform is also important. Data stored on a portable USB stick is susceptible to loss and damage, while data stored in the cloud is susceptible to hacking, malware, and phishing.
Guidelines for Addressing Data Security
Avoid using portable drives and local storage.
Secure your computer and network by installing software updates and antivirus protection, enabling firewalls, and locking your computer and other devices when you are away from them.
Use strong passwords. Strong passwords are unique and complex (long character strings with a combination of symbols, numbers, lower and upper case letters). Unfortunately, they’re also hard to remember. One solution is to use a password manager, such as KeePassX or 1Password, that stores your usernames and passwords in one place. Change your passwords regularly!
Encrypt files and disks if you are working with proprietary or sensitive data. You can use Firevault for Macs and BitLocker for Windows.
If you are working on a cloud platform, use multifactor authentication for file access.
When transferring data, use encryption. OneDrive is an example of a storage platform that allows you to send and receive encrypted files. Globus file transfer is an option for large files, and many large research institutions use Globus for sensitive research data.
Active Data Curation
Active data curation involves organizing, describing, and managing your research files and documentation. How you organize your files is a personal choice. There is no one way to do it, and a workable solution will be one that makes sense to you and your team. Document your decisions, communicate those decisions to all that are involved, and revisit them regularly. If a strategy no longer works, amend it and move on.
You don’t have to come up with an organizational structure on your own! Resources like the TIER Protocol can help get you started.
Guidelines for Active Data Curation
Organizing research files
Have one key person responsible for ensuring logical organization and naming. This person can perform checks at regular intervals to make sure documentation, file naming, and file paths are consistent. They can also be the primary contact for any research assistants who may have questions about organizational practices or data errors.
Keep your organizational scheme, file structure, and naming conventions in a single document: on a printout next to your work computer or in a documentation file with your project work. If they are nearby, they can be used. If they are buried away, they cannot.
Implement clear workflows to ensure work is not overwritten or undone. “Protect your original data by locking it or making it read-only” (Training Expert Group, 2020) and compressing it. Create separate workspaces for different data workers, with a central coordinator or analyst responsible for joining the disparate pieces together. Another option, if the project and timeline allow, is to have people work on a regular, but not overlapping, schedule. Use a Gantt chart or other models to develop a project timeline and manage duties.
Organize with economy. Limit the number of folders you use. This makes it easier to find data and helps with processing time for backups and combining or analyzing large datasets.
Did you Know? Dates in ISO 8601 format are machine-readable and can be sorted chronologically.
Describing files
Use a consistent naming scheme for all files and create a document that describes the naming scheme. This can prevent errors, save on training time for research assistants, and serve as a basis for your data dictionary (described below). It can be helpful to include abbreviations or acronyms of project names, funders, grant numbers, content type, and so on. Include dates (we recommend YYYY-MM-DD format) and be descriptive but brief. Use camel case (CamelCase) or underscores (under_scores) as delimiters. Computer systems do not always understand spaces and special characters.
Versioning should be clear and judicious. Not every edit needs a new version number, but substantive changes to files warrant updated version numbers. Use V01, 02, and so on to make your revision history clear and easy to follow, or use an automatic version control system.
Syntax files are code files with sequences of actions performed by statistical analysis software; they can be generated by the software or coded by the analyst. Perform or record all your actions using a syntax file that lists the actions performed by statistical analysis software. Depending on the specific software you use, syntax files may be called program files, script files, or something similar. Most syntax editors have built-in notation (or commenting) functionality that can help you remember what you did and communicate this process to your co-investigators. Include descriptions of what you have done in syntax files and clean your syntax as you go. This will also be useful if your code is going to be reused for future projects or disseminated on a research data repository.
If using specialized software for data exploration and analysis, determine if documentation about data file processing is automatically generated and supplement as required. Include as much detail as you would need to recreate your workflow. If you intend to revisit your data later, you’ll appreciate the effort you made!
Create your own file naming scheme. Krista Briney’s Filing Naming Convention Worksheet guides you through the process of creating a meaningful plan.
Creating codebooks and data dictionaries
A codebook is a document that describes a dataset, including details about its contents and design. A data dictionary is a machine-readable and often machine-actionable document, similar to a codebook, that generally contains detailed information about the technical structure of a dataset in addition to its contents (Buchanan et al 2021); however, the two terms are often used interchangeably. Codebooks may be automatically generated by the statistical software you use, or you may need to create one yourself. It is good practice to develop the codebook as you go so that data will be standardized. Document any recoding or other manipulation of data. Even if the survey software generates the codebook, you will likely need to add more information. Ideally, your codebook will be simple, including variable names and short descriptions. Though, according to the Inter-university Consortium for Political and Social Research (ICPSR, 2023), the information contained in codebooks may differ across projects and domains.You should include the codebook in the methodology section of a study. As a starting point, document any analysis you’ve done as notation in the syntax file for your analysis. A well-notated syntax file can become the basis for a codebook, or even the methods section of a report, thesis, or publication. Methodological descriptions will vary widely by field of study, but some key things can always be included:
Values and labels for any fields
Include a description of how null values were addressed during analysis.
Basic descriptions or distributions of the results
Omitted or suppressed variables
Relationships between variables, including survey piping (wording automatically inserted by survey software based on previous responses) or follow-up experiments
Figure 1 shows an excerpt of a codebook published by Statistics Canada for the National Population Health Survey. In this example, the codebook contains the name of the variable, the survey question and responses, and a note about the age of the respondents. This codebook also includes the position and length of the variable; this information would also be included in the data dictionary.
Figure 1.Codebook A – National Population Health Survey (NPHS) – 1994-1995 – Supplements (Statistics Canada, 1996).
Going Further
Regardless of the software that you choose to use, good documentation is the key to effective data management and curation. This section will introduce important concepts to consider in the active curation of computational research, including file versioning, scripting, and software containers.
We can take these lessons about active data curation and apply them to the case of computational research. Computers have become so user-friendly that it is easy to overlook their complexity. Researchers can choose from a variety of open source or proprietary software to perform tasks at every stage of their project, from data collection to visualization.
Proprietary software, such as SPSS or Microsoft Excel, is akin to a “black box” where data goes in and data comes out, with little indication of what has happened inside (Morin et al., 2012). Depending on the end-user agreement, it may be disallowed or impossible to inspect the code. Proprietary software is often easier to use than open source software, and it may or may not be free (Singh et al., 2015). Open source software is often free, but it may also be more complex to use (Cox, 2019). This complexity is balanced with the ability to inspect the source code, and depending on the software license, make changes to the program itself (Singh et al., 2015).
Software is a set of textual instructions that executes, or runs, using a computer. The instructions are subject to rules articulated by the specific coding language in which the software is written, and the execution of that code is dependent on the computing environment, which includes components like hardware and operating system (Possati, 2020).
Programmatic File Versioning
Active data curation, as discussed earlier in this chapter, involves more than creating straightforward folder hierarchies and using consistent file naming practices. You must also manage the content of the files in a systematic and transparent way, with an eye for reuse. You can accomplish this programmatically with the use of automatic version control features, which are found in many cloud-connected document managers, such as Office365 and Google Docs. The assessment activity at the end of this chapter is hosted on a version control platform known as GitHub, which is commonly used by people who write and develop code.
Version control, or versioning, means keeping track of the changes that are made to a file, no matter how small. When files are saved using automatic version control, both the content and the revisions are automatically recorded, allowing users to return to all previous saved versions of the file (Vuorre & Curley, 2018). Each time you save a file, every single change to the file is recorded, and the file is saved as a new version without the need to rename the file. This allows you to “go back in time” to see how the file was developed, as all the changes in the file will be identified.
Repositories such as Dataverse and Zenodo include version information in their generated citations, which makes it easy for authors and secondary users to identify which version of a dataset or manuscript they have used.
The focus in this chapter has primarily been on projects where the data are created by researchers themselves. In projects that involve secondary use of data, it is essential to pay special attention to provenance. Arguillas et al. (2022) have published an excellent guide on curation and reproducibility, which includes a discussion on this important topic.
Scripting: For Making Analysis Reproducible and Automating Data Management Processes
Automating research workflows, such as data import, cleaning, and visualization, allows you to execute computational experiments with limited manual intervention. Automation relies on scripts, which are sets of computational routines written with code (Alston & Rick, 2021; Rokem et al., 2017). Scripts should be accompanied by detailed documentation describing each step in the routine so that the provenance of an experiment can be understood. Provenance in computational research shares the same meaning as archival provenance; it is a record of the source, history, and ownership of an artifact, though in this case the artifact is computational.
While automation and provenance-tracking facilitate reproducibility and reuse for researchers and reviewers outside of the project, the biggest beneficiary will always be the original research team (Rokem et al., 2017; Sawchuk & Khair, 2021). Detailed documentation helps identify errors and provides valuable context for training new team members. Automation allows experiments to be run and rerun with minimal effort, which is especially useful when datasets have been amended or updated.
In some cases, automation and provenance can occur in the same place. As we discussed earlier, syntax files include the commands used to manipulate, analyze, and visualize data; these files can be further edited to include descriptive comments about the rationale and the analysis. Syntax files can then be bundled with the data and output files, allowing other users to evaluate and reuse the entire project.
Electronic code notebooks are another tool that incorporates automation and provenance-tracking in one linear document. A code notebook, such as Jupyter Notebook (https://jupyter.org), is an interface that encourages the practice of literate programming, where code, commentary, and output display together in a linear fashion, much like a piece of literature (Hunt & Gagnon-Bartsch, 2021; Kery et al., 2018).
Good documentation is essential for reproducible research, regardless of who might be doing the reusing (Benureau & Rougier, 2018). It is good practice to include descriptive annotations with all computational assets used in a project to provide valuable context throughout all stages of the research lifecycle.
Sharing Code: Electronic Notebooks and Software Containers
Code that works on one computer is not guaranteed to work on another. Differences among hardware, operating systems, installed programs, and administrative privileges create barriers to running or reading the code that has been used to conduct data analysis. Some researchers use proprietary file formats that can only be accessed through purchase or subscription to specific software. In addition, those conducting and managing a research project will likely have varying degrees of coding literacy, which can lead to inconsistencies in documentation and the inclusion of errors (Hunt & Gagnon-Bartsch, 2021). While sharing research data and code to a repository that facilitates versioning is good, you should take concrete steps during the active phase of a research project to encourage reproducibility and reuse.
There are a number of technical solutions that facilitate the sharing of code, which range in complexity on a spectrum from static to dynamic. The static approach to sharing code is to simply upload the raw code to a repository with a well-documented README file and a list of dependencies, or requirements, for the computing environment. The dynamic approach involves packaging the data, code, and dependencies into a self-contained format known as a container (Hunt & Gagnon-Bartsch, 2021; Vuorre & Crump, 2021).
A software container is like a self-contained virtual computer within a computer. Software containers can be hosted on a web service, such as Docker, or a USB stick. They include everything required to run a piece of software (including the operating system), without the need to download and install any programs or data. Containerization facilitates computational reproducibility, which occurs when the computational aspects of a research project can be independently replicated by a third party (Benureau & Rougier, 2018). For a project to be truly reproducible, all research assets — from the data to the code and the analysis — must be included. For this reason, software containers include detailed information about the computing environment used to conduct the research (Hunt & Gagnon-Bartsch, 2021). This includes information about the type of computer and operating system (e.g., Mac OS Monterey v12.3, Windows v11, Linux Ubuntu v21.10); the name and version of any commercial software used in data collection or analysis or, alternatively, the coding language used to create the software; and the names and version numbers of any dependencies that support the software.
A dependency is an additional software library that can be downloaded from the internet and used for specific programmatic tasks. For example, users of the coding language Python can go online and download entire packages of prewritten code that facilitate specialized operations, such as mathematical graphing or text analysis. Dependencies are written and maintained by people outside of the project, which means that versions may be updated frequently or not at all. Some dependencies have a large user base and come with a lot of documentation, while others don’t. It is up to the researcher to verify that the code does what it says it will, and that there are no errors or bugs that will impact the data or the resulting analysis (Cox, 2019). It’s essential that you carefully document dependencies (and their versions) in a project for reproducible research, as even small changes between versions can break the code, or worse, output incorrect results.
One of the most common ways to write code for software containers is through the use of an electronic code notebook. Containerizing a code notebook allows users to analyze and alter the code to test the output and the analyses. End-users can experiment with the code without worrying about breaking it or making irreversible changes, and they do not have to worry about security issues related to software installations.
Conclusion
The active curation of research data leads to better research, as good curation saves time and reduces the potential for errors. Using standard workflows, organizing and labelling research assets in a consistent way, and providing thorough documentation facilitates reuse for the primary research team and for secondary users. Standardization enhances discovery for data in repositories, which allows for the inclusion of datasets in systematic reviews and meta-analyses, ultimately increasing citation counts and the profile of the research team.
While the suggestions in this chapter are considered best practices, the best RDM is any management at all. Each project will come with its own unique challenges, but attention to active data curation will ensure that the documentation is sufficient for data deposit and discovery.
Active data curation helps researchers ensure their data is accurate, reliable, and accessible to those who need it. Research data that is properly managed and maintained remains useful and accessible over time.
Data management practices, such as versioning and scripting, help to improve data accuracy and security. Automating the description, organization, and storage of research data saves time and prevents errors.
Tools that enable reproducible computation and analysis, such as electronic lab notebooks and software containers, provide opportunities for research to replicated and verified. By making data and analysis methods openly available, researchers can demonstrate the rigour and reliability of their research and allow others to scrutinize their work.
Reference List
Alston, J. M., & Rick, J. A. (2021). A beginner’s guide to conducting reproducible research. The Bulletin of the Ecological Society of America, 102(2), 1–14. https://doi.org/10.1002/bes2.1801
Arguillas, F., Christian, T.-M., Gooch, M., Honeyman, T., Peer, L., & CURE-FAIR WG. (2022). 10 things for curating reproducible and FAIR research (1.1). Zenodo. https://doi.org/10.15497/RDA00074
Benureau, F. C. Y., & Rougier, N. P. (2018). Re-run, repeat, reproduce, reuse, replicate: Transforming code into scientific contributions. Frontiers in Neuroinformatics, 11. https://doi.org/10/ggb79t
Buchanan, E. M., Crain, S. E., Cunningham, A. L., Johnson, H., Stash, H. R., Papadatou-Pastou, M., Isager, P. I., Carlsson, R., & Aczel, B. (2021). Getting started creating data dictionaries: How to create a shareable data set. Advances in Methods and Practices in Psychological Science, 4(1), 1-10. https://doi.org/10.1177/2515245920928007
Cooper, A., Steeleworthy, M., Paquette-Bigras, È., Clary, E., MacPherson, E., Gillis, L., & Brodeur, J. (2021). Creating guidance for Canadian Dataverse curators: Portage Network’s Dataverse curation guide. Journal of EScience Librarianship, 10(3), 1-26. https://doi.org/10/gmgks4
Cox, R. (2019). Surviving software dependencies: Software reuse is finally here but comes with risks. ACMQueue, 17(2), 24-47. https://doi.org/10.1145/3329781.3344149
Hunt, G. J., & Gagnon-Bartsch, J. A. (2021). A review of containerization for interactive and reproducible analysis. ArXiv Preprint ArXiv:2103.16004.
Johnston, L., Carlson, J. R., Kozlowski, W., Imker, H., Olendorf, R., & Hudson-Vitale, C. (2017). Checklist of DCN CURATE steps. IASSIST & DCN – Data Curation Workshop.
Kery, M. B., Radensky, M., Arya, M., John, B. E., & Myers, B. A. (2018). The story in the notebook: Exploratory data science using a literate programming tool. Proceedings of the 2018 CHI Conference on Human Factors in Computing Systems, 1–11.
Krier, L., & Strasser, C. A. (2014). Data management for libraries: A LITA guide. American Library Association.
Morin, A., Urban, J., Adams, P. D., Foster, I., Sali, A., Baker, D., & Sliz, P. (2012). Shining light into black boxes. Science, 336(6078), 159–160. https://doi.org/10/m5t
Possati, L. M. (2020). Towards a hermeneutic definition of software. Humanities and Social Sciences Communications, 7(1), 1–11. https://doi.org/10.1057/s41599-020-00565-0
Rokem, A., Marwick, B., & Staneva, V. (2017). Assessing reproducibility. In J. Kitzes, D. Turek, & F. Deniz (Eds.), The practice of reproducible research: Case studies and lessons from the data-intensive sciences. University of California Press. http://www.practicereproducibleresearch.org/core-chapters/2-assessment.html#
Sawchuk, S. L., & Khair, S. (2021). Computational reproducibility: A practical framework for data curators. Journal of EScience Librarianship, 10(3), 1-16. https://doi.org/10/gmgkth
Singh, A., Bansal, R., & Jha, N. (2015). Open source software vs proprietary software. International Journal of Computer Applications, 114(18), 26-31. https://doi.org/10/gh4jxn
Vuorre, M., & Crump, M. J. C. (2021). Sharing and organizing research products as R packages. Behavior Research Methods, 53(2), 792–802. https://doi.org/10/gg9w4c
Vuorre, M., & Curley, J. P. (2018). Curating research assets: A tutorial on the Git Version Control System. Advances in Methods and Practices in Psychological Science, 1(2), 219–236. https://doi.org/10/gdj7ch
Wilkinson, M. D., Dumontier, M., Aalbersberg, Ij. J., Appleton, G., Axton, M., Baak, A., Blomberg, N., Boiten, J.-W., da Silva Santos, L. B., Bourne, P. E., Bouwman, J., Brookes, A. J., Clark, T., Crosas, M., Dillo, I., Dumon, O., Edmunds, S., Evelo, C. T., Finkers, R., Gonzalez-Beltran, A., … Mons, B. (2016). The FAIR Guiding Principles for scientific data management and stewardship. Scientific Data, 3. https://doi.org/10/bdd4
About the authors
Sandra Sawchuk
Sandra Sawchuk is the data services and user experience librarian at Mount Saint Vincent University Library and Archives. She has an academic background in the digital humanities, and her research interests include data rescue and reuse. She recently co-authored a paper on computational reproducibility, and she is currently participating in a two-year SSHRC Partnership grant to improve access to Canada’s historic census data. ORCID: https://orcid.org/0000-0001-5894-0183
Louise Gillis
Louise Gillis is the Research Data Management Librarian at Dalhousie University Libraries. In her role, Louise facilitates RDM best practice through support of tools such as DMP Assistant and Dataverse. She is a current member of the Council of Atlantic Libraries’ Digital Preservation and Stewardship Committee as well as the Portage-Alliance’s Data Repository and Storage Working Group. As a past member of Portage- Alliance’s Dataverse Curation Guide Working Group, she co-authored a curation guide for Scholars Portal Dataverse. ORCID: https://orcid.org/0000-0001-8250-5886
Lachlan MacLeod
Lachlan MacLeod is the Copyright and Research Data Management Coordinator at Dalhousie University Libraries. Lachlan has worked in the Dalhousie Libraries providing support for copyright services, data and statistical support, research data management, and library assessment. He was previously employed by the Atlantic Research Data Centre (Statistics Canada). He has training and experience in social science research methods, research data management, and data support for researchers. ORCID: https://orcid.org/0000-0002-2702-9810
Digital Preservation of Research Data
11
Grant Hurley and Steve Marks
Learning Outcomes
By the end of this chapter you should be able to:
Identify threats to the long-term accessibility of digital research data.
Develop a plan for the preservation of a given dataset in the context of a defined Designated Community (DC) and its expected use case.
Determine whether possible preservation actions positively contribute to the long-term accessibility of a given dataset.
Introduction
Digital preservation is commonly defined as “the series of managed activities necessary to ensure continued access to digital materials for as long as necessary” (Digital Preservation Coalition, 2015). Whether these materials were born-digital or digitized from another source, this goal remains the same. Although digital preservation is a relatively new field (at least compared to physical preservation!), the preservation of research data has been a part of its study since the beginning. In fact, one of the formative documents of most modern approaches to digital preservation, the Open Archival Information System(OAIS) model, was developed by a consortium of space agencies to help deal with the problem of access to historical space mission data.
The goal of this chapter is to introduce some of the basic concepts of digital preservation, with a focus on practical approaches to common problems and solutions that you may be faced with as you look at preserving research data for the long term.
Threats to Objects Over Time
Maybe one of the easiest ways to understand the risks to digital objects (including research data) over time is to put ourselves in a scenario. Imagine that you’ve come across a stack of old 5.25-inch floppy disks that you believe contain some sort of useful data: research logs from a predecessor of yours or historical data from your field of study or anything else you can imagine. It doesn’t matter — the only thing that matters is you want what’s on those disks!
However, the drives that read this type of disk are no longer standard issue with computers. In fact, they can be difficult to find in working condition. This illustrates our first threat: media obsolescence . Our storage media — in this case the floppy disks — require certain configurations of hardware and software in order to be read. When the necessary hardware is no longer available (or difficult to obtain), the media can no longer be used and is said to be obsolete.
For the purposes of this module, let’s assume that we were lucky and able to get our hands on a working 5.25-inch floppy drive. We put our first disk in the drive and double-click it in Finder or Windows Explorer and … what? Why is it saying the disk contains no data? It could be a couple of things. Maybe the disk indeed contains no data, or we’ve fallen prey to a second threat: media degradation — that is, the “decay” of the media and its contained information over time. Most types of digital media have a limited shelf life and, once they’re gone, it can be difficult or impossible to recover the data.
However, maybe the data are still there but we’re not able to read them. They were probably written on an older computer, and it’s possible that the originating system wrote the data to the disk in a way that is different from what our modern computers expect. Without software to help our modern computer read the disk, we may not be able to determine what files exist, what they are named, or where one file ends and another begins. These are all functions of a data structure called the file system.
But let’s assume that we’re able to browse the file system of the disk, either because it was written in a way that our computer understands or because we installed something that helped us do that. We could run into another problem: the files themselves may not be intelligible to the applications we use in our day-to-day computing environment. Perhaps the files were created using an old database program or were encoded in some format that was intended to be accessed only with a proprietary viewer program — one that is no longer available. This and the preceding file system problem are examples of format obsolescence.
Finally, if we are able to access the disk and the files it contains, read files off the disk, and understand how those files are decoded, we may still be missing crucial information about the data. If they are observational data, we may be missing information about when and where and how they were gathered. If they’re image data, we may be missing information about what the images depict. For any data, we may be missing information about who created them and whether there are outstanding intellectual property restrictions on the data. Depending on our use case, we may not care about these questions, but if we’re interested in rigorous academic work, we probably do care, and this loss of provenance is the final problem we can identify in this scenario.
Worried yet? The good news is that we are not the first people to encounter these problems. In fact, there’s an entire field of digital preservation dedicated to identifying, avoiding, and rectifying many of these problems. Before we talk about how to address these problems, let’s look at some of the basics.
The Goals of Digital Preservation
According to the Digital Preservation Coalition (DPC) (2015), digital preservation is defined as “the series of managed activities necessary to ensure continued access to digital materials for as long as necessary.” Let’s walk through the components of this definition to explain the broad goals of digital preservation.
We’ll begin with “digital materials” since these are the subject of digital preservation activities. What are digital materials? The word materials suggests a physical form, and digital materials always have a physical instantiation somewhere, whether they are stored on a 5.25-inch floppy disk, a server, an external hard drive, a USB flash drive, or a CD. Each of these storage methods encodes information in some manner, whether through magnetic fluctuations (servers, floppy disks, and many external hard drives), charged cells (flash drives), or pits (CDs). This first layer of mediation is followed by more — considerably more than one usually finds with analogue records. For example, take a textual document like a memorandum. In paper format, there are two immediate levels of mediation: the physical sheet of paper (Is it intact and complete? Or is it damaged?) and the text written on it (Is it visible or faded? What language is it written in?). An equivalent digital memo in Microsoft Word’s DOCX format must be first retrieved from a storage medium as a series of bytes, which, when grouped together, make a bitstream with a discrete beginning and end. Usually, more than one bitstream is required to compose an individual file. This is the case with the DOCX format, which is made up of a number of XML text files and folders grouped together into a ZIP package. It’s easy to forget that we call a digital file a file because it is composed of a series of smaller pieces of information, like a paper file would contain individual documents. In other cases, multiple individual files may be accessed independently but need to be run together for the intended output, such as scripts used to process input data; or a collection of text files in HTML, CSS, and JavaScript format plus images and PDFs that together make a website. At the simpler end of the spectrum, a single bitstream makes up the entirety of one plain text file.
In either case, the bitstreams must then be interpreted according to a particular structure: the file format. A file format is “a convention that establishes the rules for how information is structured and stored in a file” (Owens, 2018, p. 47). File formats link bitstreams and file systems with software. Given a particular file format, operating systems then enable the installation of particular pieces of software to read, interact with, and save files in that format. They also have the advantage of supporting exchange — since each file in a particular format is structured in the same way, it’s understandable to different applications or systems that wish to open a file in that format. But a file format is a human construction: “all conversations about formats need to start from the understanding that they are conventions for how files are supposed to be structured, not essential truths” (Owens, 2018, p. 120). Some file formats, especially those tied to one piece of software, are not accessible without that software in place and “lock in” users to a particular commercial product. File formats also change over time in step with software and user requirements: software in one version may be incompatible with a file format in an older version. Specialized software (used in research fields like health sciences, social science, or biology), even if not commercially sold, may nevertheless use unique file formats or run on different versions of software that are not well documented or supported.
Software requires a physical computer to run on, composed of hardware pieces such as memory, processors, and storage space. An operating system (OS), such as Windows, Mac OSX, or Linux, is a piece of software that controls all of those components, plus additional ones like input devices (keyboard, mouse), output devices (display, printer), storage, and networking. Operating systems also control access to the computer’s file system, which determines the rules for how and where data are stored and retrieved from a storage medium. Due to the specific implementations of each OS, certain software may run only on specific OSs or be limited to specific versions of one.
Next, let’s look at the idea of “continued access,” which is affected by the level of openness, such as whether materials are available for free use online, by request, or restricted to particular individuals or community members based on cost, privacy, copyright, or other restrictions. Continued access can be threatened by issues such as loss due to a subscription cancellation or a service provider who has gone out of business. As such, digital preservationists need to maintain information about provenance and rights to access digital objects over time. The de facto standard for this information is the PREMIS metadata standard maintained by the Library of Congress, which provides a framework for recording detailed information about the actions conducted to maintain digital materials over time.
Finally, the DPC definition acknowledges that not all digital materials will be maintained forever: “for as long as necessary” is more realistic. Some materials have immediate value, but that value may fade over time; other materials must be deleted as governed by privacy legislation or rules for conducting ethical research. In an ideal world, the digital preservationist hands off their maintenance work to others to continue it. This is the second meaning of managed as described above: the work of digital preservation must take place within a structure, institutional or otherwise, that will outlast reliance on particular individuals.
Digital Preservation Versus Curation
If digital preservation is a set of maintenance processes with the goal of maintaining access over time, then a subsequent question arises: given all the human and technical resources required, what should be preserved? The subject of determining preservation priorities — which identifies the materials an organization chooses to put resources into preserving and which it does not — falls into the broader area of digital curation and, specifically, appraisal as part of the curation process. Appraisal, as outlined in Jonathan Dorey, Grant Hurley, and Beth Knazook’s Appraisal Guidance for the Preservation of Research Data, involves the determination of value. In the case of research data, which are typically deposited by a creator with an organization, the question becomes, does this set of files possess adequate future value to merit acquisition and preservation? If your organization has a mission to preserve materials for the long term, then you will need access to the right subject or domain knowledge to make these value judgements. You may also call upon collections development strategies or policies to determine if a candidate dataset is within the scope of your organization’s priorities. In addition, specific digital preservation expertise may be needed to identify whether the materials can be preserved, the types of preservation interventions required, and the resources needed to do the work. This process is a technical appraisal. Once the value of a dataset is established, subsequent curation activities may focus on improving the materials through quality checking, running code, and improving documentation and metadata. You may also need to identify individual files in a dataset that should not be retained or, conversely, missing files that need to be collected. A thorough list of these types of activities are offered by the Data Curation Network’s CURATE(D) workflow and the Dataverse Curation Guide, prepared by the Digital Research Alliance of Canada.
In line with the DCP definition of digital preservation being “for as long as necessary,” the choice to retain a dataset is not permanent: datasets may be revisited through a reappraisal process to ensure they continue to hold value to the organization and its community.
Designated Communities
Given the many possible choices when identifying preservation interventions for a specific set of materials an organization has decided to keep, preservationists may ask how to decide what steps to take. The Open Archival Information System (OAIS) standard contains a useful concept that aids in this work: the idea of a “Designated Community.” In OAIS, this is defined as follows:
An identified group of potential Consumers who should be able to understand a particular set of information. The Designated Community may be composed of multiple user communities. A Designated Community is defined by the Archive and this definition may change over time (CCSDS, 2012, p. 1–11).
Many librarians and archivists have struggled with this concept, since narrowing their activities to a specific group can be seen as conflicting with their professional duty toward broad and accountable public access (Bettivia, 2016, p. 5). Defining a Designated Community does not preclude preserving materials for everyone, but it does force the preserver to consider needs when making preservation decisions, including the outcomes of preservation interventions, the metadata available to users, and the common set of services enabling access (Marks, 2015, p. 16). This means doing “preservation for someone rather than preservation of something” (Bettivia, 2016, p. 3). Many institutions have implicit Designated Communities, such as faculty members, students, and staff at an academic institution, citizens of a town or territory, or employees of a private organization, even if they possess a broad public mandate. Defining a Designated Community forces these assumptions to be made explicit. Primary, secondary, and tertiary Designated Communities may also be assigned, with decreasing levels of specificity, to capture the widest possible set of members without making impossible promises to preserve all materials on behalf of “the world.”
When doing preservation for identified communities, the information being preserved must remain independently understandable to members of that Designated Community. OAIS defines “independent understandability” as “a characteristic of information that is sufficiently complete to allow it to be interpreted, understood and used by the Designated Community without having to resort to special resources not widely available, including named individuals” (CCSDS, 2012, p. 1–12). This means that materials should be usable by community members without outside help. As the curator, you need to understand what knowledge the members of the Designated Community will have and provide materials that will be accessible to them. In a Research Data Management (RDM) context, it’s common to assume a level of expertise related to the domain or discipline in which the data are produced. For example, a social science data repository would assume that members of its primary user community (social science researchers) are able to use statistical analysis software, so preserving and providing tabular data in raw format for use in R or other software would be sufficient. If the repository desires to be usable by non-experts, it may be necessary to provide other options for access, such as an interactive visual interface for querying tabular data. In this way, at some layers of the preservation and access infrastructure, “there is a commonality of services, and at some point subject-specificity may dictate a need for different approaches to serve different Designated Communities” (Bettivia, 2016, p. 6). At the end of the day, as Nancy McGovern’s (2016) Digital Preservation Management Model Document observes, “A digital archive may be dark, dim, or lit, but the absolute proof of preservation is in the capability to provide meaningful long-term access.” Or, if the digital materials can’t be used, then they haven’t been usefully preserved.
Significant Properties
Having established the concept of Designated Community, we can now turn to another important concept, one that flows directly out of the Designated Community and their needs: significant properties. The Digital Preservation Coalition (2015) Glossary defines significant properties as “characteristics of digital and intellectual objects that must be preserved over time in order to ensure the continued accessibility, usability and meaning of the objects and their capacity to be accepted as (evidence of) what they purport to be.”
Significant properties are important because they are derived from the specific perspectives and needs of the DC. In particular, they are the properties of a given data object that meet the DC’s needs. These significant properties will vary depending on the data object and, even within the scope of a single object, can be as diverse as the Designated Communities that may access it. That being said, in almost all cases, there are a number of significant properties that are identified as important.
One of these key significant properties is format. As mentioned above, digital objects often need specific pieces of software in order to be accessed, and the software’s ability to perform relies on its ability to interpret how the meaning of the data are encoded in the file — the file format. Different types of research data, such as tabular data, text documents, images, and audio or video recordings, may utilize different file formats to store information accurately and efficiently.
Another significant property of research data is their metadata, which can include information about the data’s creator, methodology, coverage, and other relevant details. Accurate and comprehensive metadata are essential for understanding the context and meaning of the data as well as for enabling proper citation and attribution. Within the research data realm, these metadata can be quite specialized, as the data are as well. For example, historical survey data used to support social science research may be described in the DDI metadata standard, which allows for the robust description of potentially relevant details, such as survey population, sampling methodology, and so on. A dataset gathered as part of an astronomy project will likely have little use for these same fields but will require a host of other ones — perhaps relating to telescope orientation, weather conditions, and others. For more about metadata and for a discussion about the important considerations when selecting long-lived file formats, please see chapter 9, “Insights Into the Fascinating World of File Formats and Metadata.”
In addition to these technical properties, research data may have other significant properties related to their content or context. For example, data may be part of a larger research project or study or may be linked to other datasets or materials. It’s important to consider these relationships and connections when preserving research data to ensure that the data can be understood and used in the context in which they were created. It’s harder to generalize about how these significant properties are stored because it can depend on the context of the researcher or group that gathered the data or the repository in which the data are found. Some of the questions you may want to ask in looking at these properties include but are not limited to the following:
Is this dataset part of a series?
Does this dataset have other versions?
Are these data in support of a specific publication?
Are these data a subset of a larger dataset?
Although significant properties can be tricky to identify at first, the most important thing to remember is that they are an expression of the needs of the Designated Community. So, when in doubt, consult with a member of the DC or at least think about what aspects of the data are necessary to ensure the data are usable by that community.
Digital Preservation in a Research Data Context
Preservation Actions
This section now turns from conceptual frameworks to the daily practice of digital preservation through the identification, performance, and evaluation of preservation actions.
Four broad categories of commonly performed preservation actions are discussed below:
Checksums and bit-level preservation establish integrity and a baseline of assurance that materials remain intact and complete over time. Bit-level preservation requires organizations to identify robust strategies for preservation storage and is associated with preventing problems around media obsolescence and media degradation.
Technical metadata are commonly extracted from individual files or bitstreams, which can help inform the management of the files and bitstreams over time. File format identifications are the most common value extracted for this purpose. These actions help ameliorate risks associated with format obsolescence and loss of provenance.
File format validation takes inputs from the process of identification and, for certain formats, evaluates whether the file in question meets the basic standards for structure and quality as defined for that format. This process relates to format obsolescence but can also help identify potential media degradation.
Finally, normalization and migration actions can be taken in order to ensure data are not locked into a forgotten or proprietary format. Again, this speaks to the problem of format obsolescence.
While this list does not include all possible digital preservation activities, these functions are among the actions the most commonly run on a day-to-day basis using particular tools and processes. They consist of the hands-on work of digital preservation, whether enacted manually or, more commonly, through scripted tools or preservation processing software. When evaluating a repository’s functional ability to preserve digital materials, identifying the presence (or absence) of these functions is paramount.
Checksums, Bit-Level Preservation, and Preservation Storage
Bit-level preservation is often considered the most basic set of actions an organization can do to support long-term preservation. This approach is focused on ensuring that files retain fixity (that is, they remain intact and unaltered in terms of the ordering of bits in the file) and that files are stored in multiple locations to protect against accidental loss, modification, or corruption. Bit-level preservation does not guarantee any form of future usability/accessibility based on the contents or format of the files in question. It simply provides the assurance that files are intact. The basic set of actions is as follows: When processing and storing data for preservation, the preserver runs a checksum algorithm against files being uploaded and records the results. On a varying schedule, the preserver runs a checksum check against the same times at a later date. This second check (and all subsequent ones) are called fixity checks. If the output of the second check matches the first, then the materials still have fixity. Ideally, the results of each check along with the date and time are stored in a database or other location each time a fixity check is run.
Checksums are unique numeric or alphanumeric strings of varying potential lengths produced by checksum-generating algorithms, like CRC, MD5, SHA1, and SHA256, based on the contents of a file. When the contents of the file are altered in any way, the checksum value will change, indicating that the file no longer has integrity and should be replaced with another copy. While CRC, MD5, and SHA1 are not considered secure for cryptographic purposes, they are still commonly used for detecting integrity issues. See Matthew Addis’s guide Which Checksum Algorithm Should I Use? for a good discussion of this topic. Indeed, checksums are a core component of many computing infrastructures. The key is to identify when and how they are run. Files are most likely to lose integrity during transport from one system to another, such as uploading files to remote preservation storage over the web. Ideally, a local checksum on your computer is run first and compared with the results of a fixity check on arrival at its destination. Keep in mind that various automated tools will do most of this work for you; files stored in the BagIt format using tools implementing the Python BagIt Library are a commonly used example.
The second important component of a bit-level preservation strategy is having multiple copies. If you identify an integrity issue, the ideal solution is to replace the “bad” copy with an intact version. Hence, having more than one copy, ideally in more than one location, enables you to quickly mitigate integrity issues that might arise. The types of preservation storage methods can vary widely based on the resources available to a preserving organization. For some, separate copies on external hard drives, or the use of RAID drives, or local network storage (ideally backed up) may be all that is possible. Organizations doing preservation work on a larger scale may use tape storage systems. And third party services, such as cloud storage or other replicated storage networks, are available for the needs of memory institutions. The storage section of the National Digital Stewardship Alliance (NDSA) Levels of Digital Preservation Matrix is most useful for making decisions about how many copies to make and where to keep them, which ranges from keeping two copies in separate locations (but in the same geographic area) to “at least three copies in geographic locations, each with a different disaster threat” (National Digital Stewardship Alliance, 2019). Note that the NDSA Levels do not need to apply to all materials equally; many organizations apply different preservation storage strategies to different classes or genres of digital materials. See also Schaefer et al.’s (2018) “Digital Preservation Storage Criteria” framework for evaluating different preservation storage options.
File Format Identification
Identifying file formats is usually the first step a digital preservationist takes after ensuring the integrity and safe storage of the materials to be preserved. Knowing the format (and sometimes the specific version of that format) will help you decide how that file should be accessed and maintained over time. As a result, understanding file formats is a special source of concern within the RDM community. Researchers are encouraged to export their final data files in nonproprietary formats, and institutions like the Data Archiving and Network Services (DANS) from the Netherlands have designed file format preferences for inclusion in their repository.
Since it is necessary to reliably identify file formats, there are processes to help with that. You can usually figure out the file format from its extension; however, proprietary, obsolete, or specialized file formats may not be as identifiable, and systems often enable users to change extensions without changing the contents of the file. The key is to find a tool that identifies a file format by its signature. The signature is a series of bytes that occur in a predictable manner at the beginning and often the end of a file. For it to be a reliable marker, every instance of that file format should include this signature. Some file formats, such as plain text files, lack signatures, so inferences about the formatting of that text need to be made from the file’s content and structure. Tools that identify file format signatures commonly query the PRONOM database maintained by the UK National Archives, which includes an extensive listing of signatures associated with different file formats and versions. New formats are frequently added to PRONOM. MIME type identifications, which are commonly used by Internet browsers, email clients, and other software to identify file types, can use signatures but may also fall back on extensions. MIME types do not identify specific file format versions but can be useful when the more demanding threshold of signature-based identification fails. Signature-based file format identification tools include Siegfried (maintained by Richard Lehane) and FIDO (maintained by the Open Preservation Foundation).
File Format Validation
Once a file format has been identified, additional actions can flow from this information. File format validation is the process of checking if a file format meets the specifications that have been designed for that format. Not all file formats have published rules, but when they do, you can check whether any instance of a file is a “good” representation of that format. In the parlance of preservation, two questions are asked of a file: “Is it well formed?” and “Is it valid?” A well-formed file obeys the syntactic rules of its file format: it follows the basic structural rules as set out by its file format standard. Second, for a file to be valid, it must first be well formed. This means it meets higher-level semantically defined rules for the minimum quality of that file format, such as a minimum amount of image data present in a TIFF file. As Trevor Owens (2018) notes, “many everyday software applications create files … that are to varying degrees invalid according to the specifications” (p. 120). In the context of research data, the applicability of validation will depend on the format at hand and the issues identified: does it have a specification published, and is there a tool available to check the file against that specification? Perhaps more importantly, if a file is found to be invalid, or valid but not well formed, what is the subsequent action? If a file is found to be fully corrupted, or the issues identified have a significant impact on the usability of the file, then it may be desirable to return to the creator and ask them to remediate the issue. In other cases, preservationists record validation information in metadata but do not act upon it. Paul Wheatley (2018) documents a useful set of questions to evaluate validation errors: Is the file encrypted? Is it dependent on external components you don’t have? Is it significantly damaged? Is the file in the format you think it is? Validation can help identify these issues at many stages. Some of these questions may be answered during the curation phase where a data curator is actively checking files for their quality, completeness, and usability. A subsequent preservation workflow may then simply record validity in the metadata output in service of a validation check again in the future. Tools for file format validation include JHOVE (maintained by the Open Preservation Foundation for a range of formats) and veraPDF for PDF/A files.
File Format Conversion: Normalization and Migration
File format conversion is perhaps the most active process we’ll discuss in this section. Rather than gathering information about the files, conversion of files into alternative formats actively affects the contents of the files themselves. As noted above, this action can take place before files reach a repository, such as when researchers or other creators are encouraged to export their files in specific nonproprietary or otherwise preservation-friendly formats. Based on the results of file format identification, it may also take place while processing files to be placed in preservation storage. File format conversion also has the potential to impact significant properties or even the informational contents of a file and should be undertaken with an assurance that the resulting file in a new format still meets the needs of the Designated Community. Repeated testing and validation of conversion outputs with a variety of sample files is key.
Normalization and migration are different processes but end with the same result. Normalization is the process of converting files to a standard set of formats, as defined by the archive or repository, upon receipt or ingest. The idea is that the repository then has to manage only a subset of file formats into the future. Migration is when a repository converts files to a secondary format at some later date, usually at scale, in response to an identified risk, such as a format that is no longer supported. During both processes, a new copy of the file is created in a different format, which also must be managed by the repository. The original copy is usually retained to prevent accidental information loss as a result of the conversion. While preservation normalization was a default for many repositories in the past, more are carefully evaluating when normalization should occur to ensure that they are minimizing the environmental and financial impact of creating more copies than required.
Normalization and migration for preservation must be distinguished from these same actions for the purposes of access. Access normalization or migration is used to provide access copies to the Designated Community based on their needs. For example, a large TIFF file containing a map might be normalized into a JPEG for easier access online.
Tools for file format conversion are many and varied based on the specific format at hand. For example, common tools used in automated workflows include ImageMagick for images and FFmpeg for audio and video.
Evaluating Preservation Actions
At the File and Collection Level
Evaluating the results of preservation actions for individual files or collections at different levels of aggregation means running an action, such as file format identification or normalization, and inspecting the output. Typically, this is conducted on a test basis until the outputs are identified as acceptable, at which point more automated and scalable approaches take over for the final version. For file format identification and validation, the question is whether the result is as expected. For example, NVP files, which are produced by the NVIVO software for qualitative data analysis, are not yet identifiable using a tool like Siegfried because there is no description of this format in PRONOM. The preservationist must decide if additional tools should be implemented to identify these files or if they are comfortable waiting for a future update to PRONOM, at which time they would rerun the identification process. If a file is not well formed but can be opened and viewed as expected, then the error flagged by the tool may not require deeper triage. It’s also important to evaluate the results of normalization and migration actions. Does a particular conversion tool produce a result that meets the needs of the Designated Community based on informational content as well as presentation? If not, additional tools and strategies, such as emulation, may be required. For example, converting MS Office documents, such as PowerPoint presentations, to PDFs requires access to the original fonts used unless they were embedded in the original file. Lacking access to these fonts, the layout and appearance of the PDF version may be different than the original. Is this important to the member of the Designated Community who is accessing the file, or is the informational content sufficient? Having access to members of the Designated Community via advisory groups, or querying members of the user community can help make these evaluations.
At the Software and System Level
Based on the above examples, you can see how thinking about outputs at a granular level impacts decisions made system-wide. Implementing one tool to solve one set of problems then affects other relevant files in the repository. While preservation actions may be run individually, on a file-by-file basis, it’s more common for preservationists to rely on workflow tools designed to automatically run a series of linked actions at scale. A second job of the preservationist is to assess the functionality and impact of workflow software, including whether it can perform the required preservation actions in addition to validating the results. Some organizations may create custom, in-house scripts or tools for performing preservation actions, others may rely on open source or commercial software developed by third parties. However, for individual preservation actions, most preservation workflow tools (including commercial software) will use many of the open source tools mentioned above, such as Siegfried and JHOVE. One example of such software is Archivematica, an open source workflow application designed to produce preservation-worthy packages of data for long-term storage. Archivematica includes processes to create and validate checksums; perform file format identification, validation, and normalization for preservation and access; and connect with storage systems to deposit files for long-term storage. It packages preservation metadata using the METS and PREMIS XML standards. Defining the preservation priorities of the institution and understanding the collections it wishes to preserve can inform decisions about which preservation-supporting tools to implement and how to configure those tools. Making these determinations leads to defining preservation strategy and planning.
At the Strategy Level
Methods to link tools like Archivematica with systems and software for uploading research data have also been created. For example, an integration between the Dataverse software platform (research data repository software) and Archivematica enables preservationists to select and process research datasets independently of the repository software, meaning that they can store and manage research data deposited to a Dataverse collection as part of a larger preservation strategy at their institutions. For more information on the Dataverse software platform and Archivematica, see Meghan Goodchild and Grant Hurley’s paper, “Integrating Dataverse and Archivematica for Research Data Preservation.” In contrast, hosts of Dataverse installations may also offer preservation functionality. For example, the Borealis application (which is an instance of a Dataverse installation hosted in Canada) includes a bit-level preservation strategy that involves regular integrity checking and replicated storage. Another job of the preservationist is to evaluate what kinds of actions are required across the collections stewarded by the institution. For example, an institution may be comfortable relying on a basic, bit-level preservation strategy for data that it is stewarding for a short period of time or for which it does not consider as core to its institutional collections. Others might define an appraisal or accessioning policy that identifies the requirements for datasets to be processed into preservation storage. Both approaches might be used in combination for different collections: lower-risk, lower-value materials might require only a bit-level strategy, whereas materials with higher value to the institution might require a more advanced approach using Archivematica. The same questions also apply to types of preservation storage selected as discussed in this chapter’s section, Checksums, Bit-Level Preservation, and Preservation Storage. Preservation planning at this level requires the definition of policies, plans, and other documentation. See Christine Madsen and Megan Hurst’s “Digital Preservation Policy and Strategy: Where Do I Start?” for a useful introduction to this topic.
Conclusion
Research data that are stored digitally are subject to a number of threats to their ability to be accessed in the long term. These threats can include degradation of the files themselves or the loss of knowledge necessary to access the digital objects or to understand them once accessed. Happily, there are a number of standards and practices that have been developed to mitigate these risks. Such interventions can be both technical and policy-based, but all require two things. First is some degree of thoughtful planning, as it can be difficult or impossible to reverse engineer the knowledge necessary to understand a digital object should such be forgotten. Second is an understanding of the Designated Community — the group for whom the data is being preserved. This knowledge allows preservationists to choose appropriate actions to ensure data remain understandable, meaningful, and authentic for its intended users.
Reflective Questions
What are some threats to the longevity of research data over time? Do these threats differ depending on the type of data being considered?
Can you envision a scenario where an institution might choose to take some preservation actions but not others? For example, why might an institution engage in the generation and verification of checksums but not do any file format normalization?
Think of an example dataset with which you are familiar. Then think of the users who might want to access this data. What questions are users likely to ask about the data, and why? Is it to help them know what piece of software they would need to open the files in the dataset, or is it about understanding where the data came from and how they were gathered?
Now think about the same users ten years in the future. Do you think a member of this future group would be asking the same questions, or might their concerns be different? If so, how?
Key Takeaways
Common threats to data include the following: media obsolescence, media degradation, format obsolescence, and loss of provenance.
Possible preservation actions include the following: checksums and bit-level preservation, technical metadata extraction, file format validation, and normalization and migration.
When evaluating preservation actions, consider (1) what risks you are addressing and (2) the cost-effectiveness of the action.
The effectiveness of preservation actions may vary depending on whether you are looking at files or collections, a system or repository, or an organizational-level scale
Dorey, J., Hurley, G., & Knazook, B. (2022). Appraisal guidance for the preservation of research data. Appraisal for Preservation Working Group for the Digital Research Alliance of Canada. https://zenodo.org/record/5942236
Goodchild, M., & Hurley, G. (2019). Integrating Dataverse and Archivematica for research data preservation. In M. Ras, B. Sierman & A. Puggioni (Eds.), iPRES 2019: 16th international conference on digital preservation (pp. 234-244). https://osf.io/wqbvy
Lavoie, B. (2014). The Open Archival Information System (OAIS) reference model: Introductory guide (2nd Edition). Digital Preservation Coalition Technology Watch Report.
Madsen, C., & Hurst, M. (2019). Digital preservation policy and strategy: Where do I start? In J. Myntti & J. Zoom (Eds.) Digital preservation in libraries: Preparing for a sustainable future (pp. 37-47). ALA Editions Core, American Library Association.
Reference List
Bettivia, R. S. (2016). The power of imaginary users: Designated communities in the OAIS reference model. Proceedings of the Association for Information Science and Technology, 53(1), 1-9.
Grant Hurley works as the Canadiana Librarian at the Thomas Fisher Rare Book Library where he is responsible for curating the library’s extensive Canadian print and manuscript collections. From 2016 to 2022, Grant led a portfolio of shared digital preservation infrastructure and services as the Digital Preservation Librarian at Scholars Portal, including the Permafrost service, the Scholars Portal Trustworthy Digital Repository, and the Borealis Canadian Dataverse Repository. He also serves as a Sessional Instructor for the Faculty of Information at the University of Toronto for the class “Digital Archives Workflows.” In 2021, he was awarded the Archives Association of Ontario’s Alexander Fraser Award for exceptional service to the archival community.
Steve Marks
Steve Marks is the Digital Preservation Librarian at the University of Toronto Libraries, where he’s responsible for the overall care and feeding of the Libraries’ digital objects. Previously, Steve has held positions at York University, University Health Network, and at Scholars Portal. At Scholars Portal, Steve was responsible for the successful certification of Scholars Portal as a Trustworthy Digital Repository, and stood up and acted as the first administrator for Scholars Portal Dataverse, now known as Borealis.
Data Management Planning for Open Science Workflows
This chapter will look at the hot topic of open science from the Research Data Management (RDM) perspective of supporting open data in the Social Sciences and related disciplinary contexts. We’ll discuss a mixed methods (qualitative and quantitative) Data Management Plan (DMP)exemplar to help you plan for an open science workflow. There are also open topics that resonate with other chapters in this textbook because open science workflows and Research Data Management for the purpose of data sharing and reuse are closely related. At the end of this chapter, we’ll address intellectual property (IP) as it defines data ownership, copyright, licensing, and permissions and therefore impacts options for practising open data and open science workflows.
The DMP presented as a case study in this chapter is taken from the real-world example of the Meaningful Data Counts (MDC) research project with principal investigators (PI) at both the University of Ottawa and Kiel University, Germany. The purpose of the MDC international research partnership is to improve the understanding of the role that datasets play in scholarly communication. The project generates empirical evidence on open data practices, including research data reuse and citation, which is essential to the development of meaningful data metrics and can help to elevate research data to first-class scholarly outputs. From the MDC project, we learn about data sharing motivations and behaviours. The mixed methods approach of the research offers a helpful case study that demonstrates, in practice, what an open science workflow looks like in a DMP. This DMP has been shared as a model and is one of the exemplars that is built into the Digital Research Alliance of Canada DMP Assistant. The DMP Assistant is an online tool, freely available to all researchers, that develops a DMP through a series of key data management questions, supported by best practice guidance and examples.
A researcher’s decision to share data or to engage in open science practices often depends on disciplinary norms. This chapter focuses on open science workflows and data sharing in the social sciences and related fields. These principles and practices are widely transferrable to other fields that work with quantitative and qualitative data methods. However, it is important to note that open science is defined differently across disciplinary contexts. For example, this chapter does not cover practices specific to biomedical fields, such as registration for clinical trials, systematic reviews, or other study types (requiring registration), and the use of study reporting guidelines.Nineteen open science practices in biomedical fields were identified in a recent Delphi study. The authors would like to thank David Moher and the Centre for Journalology at the Ottawa Hospital Research Institute for ongoing conversations about open science practices across disciplines. Cobey, K. D., Haustein, S., Brehaut, J. Dirnagl, U., Franzen, D. L., Hemkens, L. G., Presseau, J., Riedel, N., Strech, D., Alperin J. P., Costas, R., Sena, E. S., van Leeuwen, T., Ardern, C. L., Bacellar I. O. L, Camack, N., Correa, M. B., Buccione, R., Cenci, M. S., … Moher, D. (2022). Establishing a core set of open science practices in biomedicine: A modified Delphi study [pre-print]. medRxiv 2022.06.27.22276964. https://doi.org/10.1101/2022.06.27.22276964
The next sections begin with a few definitions before moving into the case study example (DMP Exemplar) and applied best practices for open science workflows using an interdisciplinary mixed methods approach. The final section addresses intellectual property considerations that are key to ethical practices of working with open data.
What Is Open Science?
You may have heard the term open science used in different and sometimes contradictory contexts as numerous practitioner approaches, policies, articles, and mandates abound. This umbrella term is understood by different people in different ways and is discussed from different standpoints, each with its own assumptions, goals, and claims. Taking the MDC research project as a case study for how Research Data Management best practices can support an open science workflow, we’ll define open science from the standpoint of a researcher, or practitioner, as “the movement to make scientific research, data and dissemination accessible to all levels of an inquiring society” (FOSTER, n.d.). FOSTER is a European project dedicated to fostering the practical implementation of open science. Because there are so many ways to “do” open science FOSTER uses a taxonomy approach to map the broad field of activities and outputs related to these practices. For example, open science practice includes open access to publications, makes data openly available and reusable, uses open tools, engages in citizen science, and has open methods for evaluation of research.
The full range of possible open science activities and outputs often is reduced to discussions of open access publications, but open science aims to make the entire research process transparent and accessible, not just the final publication! Further, the importance of disciplinary norms in shaping different ways of actually “doing” open science in real life is often overlooked. This is problematic because different disciplines have different norms and avenues for making publications open and for sharing data. Researchers reuse open data for a variety of purposes. Existing datasets can serve as a basis for a new study, for classroom teaching on computational methods, to calibrate instruments, as a model, or as algorithm inputs. For this reason, RDM best practices recommend that researchers deposit data in repositories because this infrastructure is more reliable for long-term storage and maintenance of persistent identifiers (e.g., DOIs) that help other people find and cite the dataset. However, researchers also share data via personal websites, person to person, or through data availability statements in articles.
This chapter draws from an interdisciplinary mixed methods approach to sharing data that can be broadly applied across multiple disciplinary areas, but there are many other applications of open practices that can be explored in other disciplinary areas.
What Are Open Data?
FOSTER (n.d.) defines open data as “online, free of cost, accessible data that can be used, reused and distributed provided that the data source is attributed.” However, accessibility is only one part of the open data equation; data need to be prepared in a usable format (Fecher & Friesike citing Boulton et al., 2011). This is where Research Data Management best practices enable the usability of open data through the FAIR principles, as discussed in chapter 2, “The FAIR Principles and Research Data Management” (Wilkinson et al., 2016). Data should be findable, accessible, interoperable, and reusable — with an emphasis on machine interoperability. Making the data FAIR is only one part of the solution that Research Data Management best practices uphold; data sharing and reuse also requires context provided via supplementary information, such as literature, data documentation, and metadata.
Not all data can be open. Data with privacy concerns, such as confidential data with personal information, have to remain restricted. Research Data Management best practices can foreground an array of open science approaches while finding a balance between data that are as open as possible, but as closed as necessary.
The sharing and reuse of (open) data is an important concept in support of open science, with a preference for open data, when ethically appropriate. Perceived benefits of sharing and reusing data mirror the potential benefits of open science: to make research more reproducible and transparent, to save time and money, and to bring previously siloed data together in new ways. The UNESCO Recommendation on Open Science highlights the transformative potential of open science and its importance when addressing some of the most challenging problems of today, such as climate change, health issues, poverty, and rising inequalities.
The next sections will outline the MDC case study and DMP Exemplar, where the application of these principles of open science and documentation practices are described. Documentation practices, including a DMP, enable collaboration with other people who need to understand and make sense of data so the data can be reused appropriately.
Case Study: The Meaningful Data Counts Project
The MDC research project is a helpful case study for RDM best practices because the project both studies open data practices across disciplines, and practises open science using a social sciences mixed methods (qualitative and quantitative) approach: bibliometric, survey responses, and interviews.
The MDC project is part of the larger Make Data Count initiative, which drives the adoption of the building blocks for open data metrics: standardized data usage and data citation practices at repositories and publishers. MDC reports empirical evidence on data usage and data citation behaviour to improve the understanding of the role that datasets play in scholarly communication. Data sharing and citation patterns are studied across academic disciplines and researchers’ career stages. MDC also looks at underlying motivations researchers have to share or cite datasets — or not to do this. MDChas found that there are many motivations and ways for researchers to reuse and cite data. Although there is a great variety of data citation practices, most respondents to a survey conducted in the course of the project reported that they cite data, often for reasons motivated by “ideal” research practices, such as acknowledging intellectual debt, helping others to locate and access data, and supporting the validity of their own claims (Gregory et al., 2023). Conversely, barriers to sharing data include researchers’ fear of being scooped, fear of errors being exposed in their research, perception that the effort of preparing and publishing datasets is not worth the potential benefits; and belief that data sharing is not applicable to their own research (Tenopir et al., 2020).
The MDC project implements an open science workflow in order to report on challenges experienced by team members engaging in open science practices, such as sharing and citing research data. As much as possible, an open science workflow makes the research process transparent to people outside the original research team through sharing of research plans, processes, code, preliminary results, and data.
A key part of the MDC’s open science practice was the development of a detailed Data Management Plan in collaboration with the RDM librarian at the University of Ottawa, which has been shared as a model DMP endorsed by the Digital Research Alliance of Canada. As you learned in chapter 1, “The Basics,” a DMP is a document that describes how the data for a research project will be handled, from collection through organization and analysis to eventual disposal or deletion. DMPs are living documents that can be updated throughout the life of the project; this iterative approach pairs well with the goal of enabling ethical data sharing. Research Data Management best practices are central to academia embracing open science and are increasingly required to meet the goals of open science (Tenopir et al., 2020). The Tri-Agency Research Data Management Policy, for example, supports the FAIR (Findable, Accessible, Interoperable, and Reusable) guiding principles for Research Data Management and stewardship, and the three federal research funding agencies (SSHRC, NSERC, and CIHR) currently build data sharing into the grant application process in the “Knowledge Mobilization” section. It is expected that, to be successful, future grant applications will require a clearly articulated DMP.
This DMP for MDC describes how the project manages different types of data that the research team collects and analyzes. The DMP is one of the methods that the team uses to document the project workflow in order to communicate ethics protocols, file transfer and storage procedures, metadata standards, and software code between different team members working remotely. Anton Ninkov, a postdoctoral research team member tasked with data management responsibilities, observed that documenting workflow is “about thinking about the project as a bigger thing than an individual task. It’s about the movement of the whole project, which my work is just one component of” (personal communication, February 15, 2022).
MDC datasets include a bibliographic analysis of data citation patterns in a corpus of 8,643,593 datasets in DataCite (Ninkov et al., 2022), survey responses from more than 2,500 researchers reflecting upon data sharing and data citation practices across disciplines, and semistructured interviews with researchers that provide further insight into their motivations for sharing/citing data — or for not doing so. The DMP discussed in the next section outlines a plan to manage all the datasets produced through bibliometrics analyses, surveys, and interviews, with the intention to share the data with an open license throughout the lifecycle of the project — and not only at the time of publication.
Best Practices for a Data Management Plan in Support of an Open Science Workflow
A DMP is a great opportunity to emphasize open science practices, such as data sharing and reuse, but it can also support other components of an open science workflow. By linking the workflows documented in your DMP to other components of the research project, you are making sure that your research will be shared widely at multiple phases of the project, and that the data, which underpin the research findings reported in a publication, are transparent and replicable throughout — not only at project completion. Many researchers focus on the planning aspect of a DMP, writing out a plan at the start of the project and ignoring it after. But research is rarely linear, and plans often need to change. Creating subsequent versions can be incredibly useful as well, from the perspective of project planning and capturing the evolution of your research process.
Open science emphasizes data sharing and reuse throughout research projects, not only at the final stage of publication.
Open science workflows can be used for a myriad of research methods — mixed methods, quantitative, and qualitative — and across all disciplines.
Updated versions of your DMP capture the evolution of your research methods and workflows.
MDC’s open science practices foregrounded the development of a comprehensive Data Management Plan. Version 1 of the plan, created at the beginning of the project, describes how the team of international researchers will manage different types of data that researchers will collect using a mixed methods (qualitative and quantitative) approach. DMPs are a living document, and the MDC team has recently updated their DMP, in keeping with open science best practices: review data documentation periodically and confirm that it accurately reflects research methods and data management processes followed by the research team. Version 2 of the DMP is deposited in the same repository.
Revising the DMP contributed to efficient project management. As principal investigator, Stefanie Haustein found, “Some sections prescribed by the DMP Assistant template did not apply to our research project after all” (personal communication, February 15, 2022). The default DMP Assistant template (as of 2022) asked researchers to address long-term preservation; however, Haustein reflected, “Long term preservation isn’t as relevant to us, as we assume that the technology such as the APIs (application programming interfaces) and the relevance of the data will have changed in 20 years from now” (personal communication, February 15, 2022). Revising the DMP encouraged a review of the research team’s workflow, including the work of members who joined the team after the first version was published. This review captured changes in data collection/processing that needed to be reflected in the documentation. The documentation of these methodological workflows is important as an open science best practice because, in order for shared data and related findings to be understood or replicated by people outside a research team, there must be some context on how the data were collected, structured, and analyzed.
Both versions of the DMP were created using the Digital Research Alliance of Canada’s recommended tool, DMP Assistant, in collaboration with the RDM librarian at the University of Ottawa. The team also contributed a template for open science workflows to the DMP Assistant, which guides research teams through the best practices to include in funder-required DMPs. The MDC DMP has been peer reviewed, published, and distributed as a national example of best practice in writing a DMP for an open science workflow, a mixed methods approach, and an international research partnership. All training resources created by Digital Research Alliance of Canada are licensed under CC BY-NC 4.0 and are free to share and adapt for your own needs.
This section outlines some of the best practices that were written into the MDC DMP in order to document processes and enable collaboration within the research team or with other people who need to understand and make sense of the data so the data can be reused appropriately. We list a few here but encourage you to consult the “Guidance” sections of the full DMP Exemplar or template for details.
Responsibility and Resources
Allocate adequate human resources for data stewardship responsibilities in your budget and in advance of data collection. The principal investigator is usually in charge of maintaining data accessibility standards for the team. Assign people to structure data, document data, and field questions about accessing information or granting access to the data.
Create an onboarding document to ensure that all team members adopt the same workflows. Logical file structures, informative naming conventions, and clear indications of file versions all contribute to better use of your data during and after your research project. Using a file naming convention worksheet can be very useful.
Document your process and revise your Data Management Plan if it changes: Consult regularly with members of the research team to capture potential changes in data collection, processing, and publishing that need to be reflected in the documentation.
Documentation and Metadata
Document workflows with a README file accompanying all datasets. Good data documentation includes information about the study, data-level descriptions, and any other contextual information required to make the data usable by other researchers.
Use open file formats or industry-standard formats (e.g., those widely used by a given community) whenever possible.
Use a metadata schemaspecifically for open datasets or any of the many other general and domain-specific metadata standards. Dataset documentation should be provided in one of these standard, machine-readable, openly accessible formats to enable the effective exchange of information between users and systems. DataCite has developed a set of core metadata fields and instructions to make datasets easily identifiable and citable.
Ethics and Legal Compliance
Open science workflows prioritize being “as open as possible and as closed as necessary.” Consider which types of data need to be shared to meet institutional or funding requirements and which data may be restricted because of confidentiality, privacy, and/or intellectual property considerations outlined in your ethics protocol.
Request the appropriate consent from research participants so that their data may be shared. Your statement of informed consent may identify certain conditions clarifying the uses of the data. Inform your study participants if you intend to publish an anonymized and de-identified version of collected data, and make sure they understand that by participating, they agree to these terms.
Use open licenses, such as CC BY, to promote data sharing and reuse. Licenses determine how your data can be used by others. Consider including a copy of your end-user license with your DMP (addressed further in the next section).
Knowledge Mobilization
Help others reuse and cite your data. Did you know that a dataset is a scholarly output that you can list on your CV, just like a journal article? If you publish your data in a data repository (e.g., Zenodo, Borealis, Dryad), they can be found and reused by others. Unique Digital Object Identifiers (DOIs) make it easier to identify and cite datasets.
Use social media, e-newsletters, bulletin boards, posters, talks, webinars, discussion boards, or discipline-specific forums to gain visibility for your published data, promote transparency, and encourage data discovery and reuse. Cite your datasets the same way you cite other types of publications.
What Makes Open Data? Restrictions on Sharing Data
The MDC case study makes the connection between data sharing and Data Management Plans as they work together in support of open science practices across a research project. This section addresses the legal and contractual terms that allow or restrict access to the sharing and reuse of data as they flow through digital infrastructures. Following an overview of the privacy considerations in the MDC project, this section focuses on intellectual property considerations when determining data ownership and sharing research data.Parts of the section on intellectual property are an adaptation of M. Brunet, J. Hatherill & C. Ripp. 2021. Open Access to Knowledge Part 2: Sharing Your Research Data, University of Ottawa Library, CC BY 4.0, http://hdl.handle.net/10393/43309 and M. Brunet & T. Rouleau. 2021. Copyright and Research Data at uOttawa – FAQ, University of Ottawa Library, CC BY 4.0, https://copyright.uottawa.ca/sites/copyright.uottawa.ca/files/copyright_and_research_data_faq.pdf. While the discussion of IP and licensing data responds to a Canadian context, the MDC DMP clearly states how access will be restricted to data with privacy concerns in the context of an international research project. It also states how data that have been anonymized will be shared using an open license, which will enable reuse of the dataset.
A license is a permission from the copyright owner to allow someone else to use their work (in this case, data in some form) for certain purposes and under certain conditions. The copyright remains with the copyright owner (Canadian Intellectual Property Office, 2019). Once you have determined if the data are protected by copyright and, if so, who owns them and whether it is possible to share the data openly, there are a variety of open licenses that can be applied to indicate that openness. Open licenses are used by copyright owners to indicate which rights they wish to keep while also communicating how others can use their work without having to ask for permission every time. When a copyright owner decides to apply an open license to their work, they keep their copyright but make their work free of some of the usual constraints related to sharing, remixing, and reusing the work legally so long as the conditions of the license are respected. These open licenses are a simple and legal way to communicate that permission to potential users. Many repositories make it possible to select an open license easily and incorporate that information in the metadata.
While data sharing is a cornerstone of open science, it may not always be advisable, safe, or even legal to share data. Open science best practices prioritize respecting ethical and legal restrictions on access to data as a balance to broader goals of sharing, publishing, and reusing data. To follow this best practice, you will need to consider which types of data need to be shared to meet institutional or funding requirements and which data must be restricted because of confidentiality, privacy, and/or intellectual property considerations outlined in your ethics protocol. Indeed, before making data available publicly and openly, it is essential to determine whether doing so is ethically and legally permitted. The safety and privacy of participants, Indigenous data sovereignty, and the confidential or proprietary nature of the data may limit your ability to share them. In relation to data ownership, copyright status also needs to be clarified.
In our case study, the MDC DMP declares that all final data and publications will be published using an open access model. To achieve this goal, the international, multi-institutional partnership must also comply with the RDM policies of its host institutions, which take into account relevant legislation, industry standards, and best practices. Specifically, the data workflows will reflect the University of Ottawa’s legal and ethical considerations and the Canadian Tri-Council Policy Statement: Ethical Conduct for Research Involving Humans(TCPS 2) (2022) but may also refer to the University of Kiel’s integrity and ethics in research policy if the TCPS 2 doesn’t provide enough guidance. The Co-PI is affiliated with European institutions; therefore, research methods will comply with the EU’s General Data Protection Regulation (GDPR), which is stricter than Canadian equivalents.
The research team has stored sensitive data on a secure server in Canada, with access limited to only the PI and Co-PI for the entire project. Other team members were granted temporary access while they worked on data collection and anonymization of sensitive data. Collection of qualitative and personal data followed formal ethics approval from the University of Ottawa’s research ethics board and required explicit and informed participant agreement for data sharing following the Recommended Informed Consent Language for Data Sharing (ICPSR, n.d.). Social media and other public web data were collected and managed in line with the Association of Internet Researchers’ Ethical Guidelines 3.0 document (franzke et al., 2019). Any data determined to be sensitive will be stored securely with password protection and encryption. Data will be anonymized in reporting, except where explicitly agreed otherwise. When the data have been anonymized, they can be shared as Open Data with a Creative Commons Attribution (CC BY) 4.0 International license. If CC BY is not possible, the team will use the more restrictive Creative Commons Attribution-NoDerivatives (CC BY-ND) license.
Can I Share Data? Determining Data Ownership
You may wonder why the research team must assign a license to their data to make them open. Are data even protected by copyright? Because copyright protects the original expression of ideas or facts fixed in a tangible medium, it’s easy to conclude that data are like facts, so not protected. Indeed, raw or factual data that are not interpreted generally do not enjoy copyright protection. However, a compilation of data can be protected because of the judgment, skill, or effort applied when determining which data to include and/or their arrangement (making the data an “original expression”). Also, if the data are literary, musical, dramatic, or artistic works, they can be protected by copyright. Table 1 below summarizes the types of data that could be protected by copyright.
Table 1: Data types and copyright protection.
Not Protected by Copyright
Could Be Protected by Copyright
Raw data (i.e., a number or measurement)
Data representations (e.g., tables and graphs)
Datasets
Data compilations
Databases
Purchased data (with conditions of use)
Literary, musical, dramatic, or artistic works (e.g., photos)
If it is determined that the data are protected by copyright, then who owns them? If you are in possession of data generated or supplied by a third party, even if they were accessible for free, it does not mean that you own any existing copyright. Always look for a license or terms of use. Copyright ownership can vary by type of data (as summarized in Table 2).
Table 2: Data types and copyright ownership.
Primary Data
Data collected for your own purposes, from an experiment or research you have conducted and which you have fixed in a tangible medium
If copyright exists, you are probably the owner, but you should check the agreements or contracts related to your research project to confirm
Secondary Data
Data collected for other purposes from experiment(s) or research conducted by others
If copyright exists, it is likely owned by others
Tertiary Data
Synthesis of data from experiment(s) or research conducted by others
Articles, reports, etc. written by others for which you do not own the copyright
There may be factors external to your research team or project that could determine whether data are protected by copyright and who owns them, including the following:
policies or contractual arrangements between researchers and affiliated institutions (e.g., employment contracts, collective agreements)
disciplinary conventions or practices in authorship attribution
policies of the agency or organization that is funding the research in whole or in part
license conditions or terms of use of purchased data — acquiring data from a third party does not mean that copyright has been transferred to you or that you are authorized to share the data
All parties involved in a research project should clarify data and copyright ownership issues early on. The various and sometimes overlapping statuses of data collectors or researchers, even within one institution or organization, are significant factors in determining who owns the copyright on research data. It is crucial to clarify copyright ownership because protected data cannot be made more open without the permission of the owner.
Three main types of open licenses are used for data:
Creative Commons licenses
Open Data Commons licenses
Software licenses
Two Creative Commons designations are often used for data and are offered as options in data repositories:
CC0 (Public Domain): This designation is used to indicate that the copyright owner is waiving their rights to recent content. When data are in the public domain, there are no restrictions on their use and attribution is not required. In some data repositories, such as Borealis, CC0 is the license by default.
Creative Commons licenses apply to both the contents of a database and the database itself. Creative Commons does not recommend using licenses with the NonCommercial (NC) or NoDerivatives (ND) conditions for data because they severely restrict scholarly and scientific use.See Creative Commons Frequently Asked Questions about data and CC licences, https://wiki.creativecommons.org/wiki/Data#Frequently_asked_questions_about_data_and_CC_licenses. Although we don’t recommend limiting the reuse of data to noncommercial purposes, you could apply a Creative Commons Attribution-NonCommercial license. However, it is important to note that this condition generally applies to the use as opposed to the user. It would likely not prevent a commercial entity from using the data if it does not resell them or use them as the basis for a product or service that will be sold for profit.
While not available in all data repositories, the Open Knowledge Foundation offers three open licenses used specifically for databases:
Note that Open Data Commons licenses apply to databases only and not to the individual contents within a database.
Software licenses are some of the earliest open licenses and are also used in data repositories. They can be applied to the software or to the code, as well as to the associated documentation files:
Table 3 below offers a comparison of these open licenses based on what they allow and the need for attribution, from the perspective of a user of licensed data (not the creator).
Table 3: Comparison of Creative Commons, open data commons, and software licences.
€ Sublicensing means that derivatives can be shared under a different license
Conclusion
This chapter discussed data management planning as an RDM best practice that can support open data and data sharing as integral parts of an open science workflow in the social sciences and related disciplinary contexts. Individual researchers choose to make their data openly available for many different reasons, including increased citation of their work, but the collective goals of the open science movement are to make research more reproducible and transparent, to save time and money, and to bring previously isolated/siloed data together in new ways. Through the Data Management Plan in the case study, Meaningful Data Counts, you have learned the value of a DMP in overall project planning with open science goals in mind. The DMP ensures consistent and ethical management of all datasets produced by multiple research team members through bibliometrics analyses, surveys, and interviews; it also ensures that the data will be shared throughout the lifecycle of the project — not only at the time of publication. Key components of data sharing outlined in the DMP include depositing datasets in a recognized repository using an open license. Open licensing grants permission from MDC to other researchers to reuse their work, and the data repository ensures researchers can find the datasets and cite them appropriately. In the final section of this chapter, you learned that, in addition to privacy considerations, before making data open, you must ascertain whether the data are protected by copyright and, if so, who owns them. Once it is determined that the data can be shared openly, choosing an open license that allows for modifications encourages reuse for scholarly and scientific purposes. Not all data can be open data, but, if you wish to adopt the principles of the open science movement through data sharing and deposit in repositories, a DMP can help you standardize and communicate the steps to follow across the research team and to the wider disciplinary community.
Open science is a movement to make scientific research, data, and dissemination accessible through open access to publications. It supports making data openly available and reusable, using open tools, engaging in citizen science, and having open methods for evaluation of research.
Researcher motivations for data sharing and data citation often depend on disciplinary norms, but all researchers who publish and cite data participate in a process of elevating research data as a first-class research output with equivalent status to other research outputs.
Crafting a Data Management Plan (DMP) with an open science workflow is a good way to meet funder requirements for the effective management of research data during a project, with a goal of enabling ethical data sharing.
By linking the workflows documented in your DMP to other components of the research project, you ensure that your research will be shared widely at multiple phases of the project, and that the data that underpin the research findings reported in a publication are transparent and replicable throughout the project (not only at completion).
DMPs are living documents, and it can be helpful to revisit and update your DMP throughout the research project. Creating subsequent versions is a useful way to capture the evolution of your research process.
In addition to ethical considerations, before making data open, the existence and ownership of copyright need to be clarified; if applicable, obtain permission before depositing data in an open repository.
Once it is determined that the data can be shared openly, choose an open license that allows for modifications as much as possible: a “no derivatives” condition will severely restrict use for scholarly and scientific purposes and limit the benefits of making the data open.
Reference List
Boulton, G., Rawlins, M., Vallance, P. & Walport, M. (2011). Science as a public enterprise: The case for open data. The Lancet, 377(9778), 1633–1635. https://doi.org/10.1016/S0140-6736(11)60647-8
Brunet, M., Hatherill J., & Ripp, C. (2021). Open access to knowledge part 2: Sharing your research data. University of Ottawa Library. http://hdl.handle.net/10393/43309
Cobey, K. D., Haustein, S., Brehaut, J. Dirnagl, U., Franzen, D. L., Hemkens, L. G., Presseau, J., Riedel, N., Strech, D., Alperin J. P., Costas, R., Sena, E. S., van Leeuwen, T., Ardern, C. L., Bacellar I. O. L, Camack, N., Correa, M. B., Buccione, R., Cenci, M. S., … Moher, D. (2022). Establishing a core set of open science practices in biomedicine: A modified Delphi study [pre-print]. medRxiv 2022.06.27.22276964. https://doi.org/10.1101/2022.06.27.22276964
Fecher, B., & Friesike, S. (2014). Open science: One term, five schools of thought. In S. Bartling & S. Friesike (Eds.), Opening Science: The evolving guide on how the internet is changing research, collaboration and scholarly publishing (pp. 17–47). Springer International Publishing. https://doi.org/10.1007/978-3-319-00026-8_2
franzke, a. s., Bechmann, A., Zimmer, M., Ess, C., & the
Association of Internet Researchers (2020). Internet research: Ethical guidelines 3.0. https://aoir.org/reports/ethics3.pdf
Gregory, K., Ninkov, A. B., Ripp, C., Roblin, E. Peters, I., & Haustein, S. (2023). Tracing data: A survey investigating disciplinary differences in data citation [pre-print]. Zenodo. https://doi.org/10.5281/zenodo.7555266
Ninkov, A., Gregory, K., Ripp. C., Morissette, E., Harper, L., Peters, I., Tayler, F., & Haustein, S. (2022). Research data management plan for the meaningful data counts project (v.2). Zenodo. https://doi.org/10.5281/zenodo.6473351
Tenopir C., Rice, N.M., Allard, S., Baird, L., Borycz, J., Christian, L., Grant, B., Olendorf, R., Sandusky, R.J. (2020). Data sharing, management, use, and reuse: Practices and perceptions of scientists worldwide. PLOS ONE,15(3): e0229003. https://doi.org/10.1371/journal.pone.0229003
Wilkinson, M. D., Dumontier, M., Aalbersberg, Ij. J., Appleton, G., Axton, M., Baak, A., Blomberg, N., Boiten, J.-W., da Silva Santos, L. B., Bourne, P. E., Bouwman, J., Brookes, A. J., Clark, T., Crosas, M., Dillo, I., Dumon, O., Edmunds, S., Evelo, C. T., Finkers, R., … Mons, B. (2016). The FAIR Guiding Principles for scientific data management and stewardship. Scientific Data, 3(1), 160018. https://doi.org/10.1038/sdata.2016.18
About the authors
Felicity Tayler
Felicity Tayler, MLIS, PhD is the Research Data Management Librarian at the University of Ottawa and Research Associate of the Humanities Data Lab. She is a co-applicant on the SSHRC-funded SpokenWeb Partnership, which foregrounds a coordinated and collaborative approach to literary historical study and digital development, with diverse collections of spoken recordings from across Canada and beyond. As a member of the Digital Research Alliance RDM National Training Expert Group, Tayler was the lead author on the bilingual OER, Data Primer: Making Digital Humanities Research Data Public/ Manuel d’introduction aux données : rendre publiques les données de recherche en sciences humaines numériques. Also a visual artist and curator, Tayler has produced exhibitions and published scholarly writing exploring co-publishing relationships in literary and artistic communities. ORCID: 0000-0001-8865-2836
Mélanie Brunet
Mélanie Brunet is a librarian at the University of Ottawa, first in copyright services and now in open education. She raises awareness about textbook affordability and open educational resources at uOttawa and has been a member of CARL’s Open Education Working Group since 2019, leading its Francophone Open Education task group. She co-edited the OER by Discipline Guide: University Ottawa, a tool to help professors and students get acquainted with OER in their disciplines. Mélanie holds a Master of Information and a PhD in History from the University of Toronto.
Kathleen Gregory
Kathleen Gregory is a postdoctoral researcher at the University of Vienna and the Scholarly Communications Lab in Canada. She is also an affiliated researcher at the Center for Science and Technology Studies (CWTS) at Leiden University. Dr. Gregory’s research focuses on data practices in scholarly and science communication, particularly practices of data management and curation and examining what those practices afford.
Lina Harper
Lina Harper is a data curator working with FRDR and the Borealis community at the Digital Research Alliance of Canada. She holds a BA in Women’s Studies and Communications (Concordia University) and has written a thesis for a master’s in information studies (University of Ottawa). Also a co-chair of the Curation Events Working Group at the Alliance, Lina’s interests lie in information science and design, community engagement, digital humanities and equity. lina.harper@alliancecan.ca | ORCID: 0000-0002-8735-7621
What are sensitive data? The Sensitive Data Toolkit for Researchers (Sensitive Data Expert Group of the Portage Network, 2020a) defines sensitive data as “information that must be safeguarded against unwarranted access or disclosure” and gives several examples. However, defining sensitive data this way raises the question: Why should this information be safeguarded? Looking at their examples can help us figure this out, as they include things like personal health information and other information deemed to be confidential, some geographic information (e.g., locations of endangered species), or data protected by institutional policy. What these examples have in common is risk — that people will have their confidentiality violated, that endangered species will be disturbed or hunted, that a policy will be broken. So, you might say that sensitive data are data that cannot be shared without potentially violating the trust of or risking harm to an individual, entity, or community.
In this chapter, we’ll talk about working with sensitive data within Canadian federal and provincial policy landscapes. (Indigenous data have ethical and ownership implications and are covered in their own chapter.) We’ll conclude by outlining options for safe preservation, sharing, and appropriate archiving of sensitive data.
Human Participant Data
In Canada, at the federal, provincial, and institutional levels, various legal, policy, and regulatory frameworks govern sensitive data involving humans. In most cases, these regulatory requirements are designed at a high level to protect human participants’ privacy and confidentiality. In this way, the regulatory frameworks related to sensitive data are relevant to the category of human participant data.
The Privacy Policy Landscape in Canada
It’s not always easy to know which privacy laws are applicable in each situation. The most important privacy regulations for research data are typically located at the provincial or territorial level of governance because universities fall outside of the scope of the two main federal-level privacy laws (Office of the Privacy Commissioner of Canada, 2018). However, some sensitive information, such as medical records, may be collected by university-affiliated researchers in partnership with private or public organizations, so these may fall under the federal Privacy Act, which applies to governmental organizations, or under the Personal Information Protection and Electronic Documents Act (PIPEDA), which applies to private sector commercial entities. The Canadian government has a helpful tool to determine which legislation applies to scenarios involving different types of sensitive information.
At the national level, Canada’s three federal funding agencies (also the agencies, Tri-Council, or Tri-Agency) have a policy statement on the ethical conduct for research involving humans (Tri-Council Policy Statement: Ethical Conduct for Research Involving Humans –TCPS 2) which stipulates the parameters related to privacy, justice, respect, and concern for the welfare of participants. The TCPS 2 also provides oversight for the governance of Research Ethics Boards (REBs), which are responsible for reviewing proposed research projects that rely on human participants. Contrary to the U.S., which has a federal law (HIPPA) that governs medical information, in Canada, the management of health records or clinical data is legislated at the provincial and territorial level. All provinces and territories have at least one privacy law that can be applied to research.
Traditionally, Canadian and other Western legal systems enshrine the rights of individuals (and by extension, corporations) to privacy, ownership over information, and protection from direct harm by research. However, data can be used to harm groups or communities — for example, to stigmatize racialized groups or sexual and gender minorities. (See Ross, Iguchi and Panicker, 2018.) Such harms are not adequately addressed in existing Canadian legislation and policy. An alternative model is ownership, control, access, and possession (OCAP®), a research protocol developed to protect First Nations interests, stewarded by the First Nations Information Governance Centre. OCAP® is “a set of specifically First Nations — not Indigenous — principles” and is not intended to be used in other contexts (First Nations Information Governance Centre, n.d.). However, the principles of considering community interests first can be applied to research with marginalized communities generally. To read more about Indigenous models of ethical research, please see the chapter “Indigenous Data Sovereignty.”
Several provinces are updating privacy laws, which will affect the management of research data involving human participants. For example, Québec adopted Law 25, (also referred to as the Privacy Legislation Modernization Act), to strengthen consent requirements, oversight, and compliance. Law 25 is modelled after the European Union’s General Data Protection Regulation (GDPR), widely considered the most protective privacy legislation in the world. Potential impacts of Law 25 include requiring consent for each specific secondary use of the research data, introducing the “right to be forgotten” (Wolford, 2018), and requiring a formal privacy impact assessment prior to transferring an individual’s data outside of Québec (Office of the Privacy Commissioner of Canada, 2020). We’ll discuss consent in more detail later in the section titled, “Consent Language and TCPS 2.” For now, the explanation of this legal shift is that, previously, researchers could ask for a “blanket” consent to use participants’ information (e.g., a sample from a patient in a clinical trial could be used for other studies without detailing those specific studies). However, Law 25 does not allow a blanket consent for future research. It requires a researcher to get consent every time the researcher wants to use the sample for a new purpose. Although Law 25 is specific to Québec, it provides a model regarding privacy law reform and could have sweeping implications for research data involving human participants.
Risk and Harm
Risk of violating confidentiality is created when information can isolate individuals in a dataset as distinct and can be matched to external information to identify them through reasonable effort. The level of harm this may inflict on a research participant depends on the population and topic of the data. Generally, the highest levels are easier to identify and define (e.g., if someone’s personal health information were made public). Children are considered a vulnerable population because they can’t give their own consent, so research involving children holds a high potential for causing severe harm if information were breached. Topics considered socially taboo also place research participants at higher risk of critical harm. Although the definitions of socially taboo topics vary across cultures and can be situational, the following are considered extremely sensitive, which raises the level of potential harm that a research participant could experience if their data were breached:
drug or alcohol use (including cigarettes)
details of sexual activity/STD status
private family issues
relationship/domestic violence
loss or death in the family
victimization status
criminal/delinquent behaviour
health-related questions/medical conditions/mental health questions
Vulnerable populations, such as the following, have a higher potential for harm from a data breach regardless of the research topic:
Indigenous Communities
racialized communities
lower-income groups
children/teens
politically oppressed communities
Research involving humans from vulnerable populations and/or focusing on sensitive topics may require additional safeguards in terms of data storage and security. When research participants give permission for their identifying information to be shared (e.g., oral history interviews in which participants want to share their stories) or when information is collected from public sources where there is no reasonable expectation of privacy (e.g., lists of board members) then data may be shared without concern for disclosure. Otherwise, data need to be assessed for disclosure risk and shared only if risk falls below an acceptable threshold. There are a common set of curatorial and statistical measures to quantitatively assess and reduce the risk of a breach of confidentiality. The first step includes an analysis of the uniqueness of each individual’s data within the larger dataset.
Identifiers
Many people consent to have their information used for research purposes but don’t want their identities disclosed. Research data may contain direct identifiers, such as contact information of participants, student numbers, or other directly identifying information. Research data without direct identifiers still may have the potential to violate confidentiality due to indirect identifiersor quasi-identifiers — personal details that could in combination lead to disclosing the identity of an individual. These data can include surveys or interviews of participants who have consented to have the information they provide used for research purposes. Human participant data can also include information extracted from medical records, tax-filer records, social media, or any other sources of information on people.
Direct Identifiers
Direct identifiers place study participants at immediate risk of being re-identified. These include things like names and phone numbers but also less obvious details. For example, the U.S. Health Insurance Portability and Accountability Act (HIPAA) treats any geography containing less than 20,000 people as a direct identifier. Exact dates linked to individuals, such as birth dates, are also considered personally identifying.
The HIPAA has a list of 18 personal identifiers, while a set of guidelines from the British Medical Journal includes a list of 14 direct and 14 indirect identifiers based on international guidelines. From these and other sources, we have compiled the following list of direct identifiers for Canadian research. These should always be removed from data before public release unless research participants have agreed to have their identities shared (partial exceptions noted):
Full or partial names or initials
Dates linked to individuals, such as birth, graduation, or hospitalization (year alone or month alone may be acceptable)
Full or partial addresses (large units of geography, such as city, fall under indirect identifiers and need to be reviewed)
Full or partial postal codes (the first three digits may be acceptable)
Telephone or fax numbers
Email addresses
Web or social media identifiers or usernames, such as X handles (formerly Twitter)
Web or Internet protocol numbers, precise browser and operating system information (these may be collected by some types of survey software or web forms)
Vehicle identifiers, such as licence plates
Identifiers linked to medical or other devices
Any other identifying numbers directly or indirectly linked to individuals, such as social insurance numbers, student numbers, or pet ID numbers
Photographs of individuals or their houses or locations, or video recordings containing these; medical images or scans
Audio recordings of individuals (Han et al., 2020)
Biometric data
Any unique and recognizable characteristics of individuals (e.g., mayor of Kapuskasing or Nobel prize winner)
In addition, any shared digital files, such as photographs or documents, should be checked for embedded information, such as username or location. (see Henne, Koch and Smith, 2014.)
Indirect Identifiers
It’s clear why direct identifiers pose a risk to confidentiality — if you have someone’s address or insurance number, it may be possible to violate their confidentiality. But what are indirect identifiers and why are they a problem? Indirect identifiers (also known as quasi-identifiers) are characteristics that do not identify individuals on their own but may, in combination, reveal someone’s identity. A variable should be considered a potential identifier (direct or indirect) only if it could be matched to information from another source to reveal someone’s identity.
It’s not possible to compile an exhaustive list of quasi-identifiers, but the following should always be considered:
age (can be a direct identifier for the very elderly)
gender identity
income
occupation or industry
geographic variables
ethnic and immigration variables
membership in organizations or use of specific services
These variables need to be considered alongside any contextual information about the dataset — for example, survey documentation or published research may make it clear that the participants in the research lived in a particular area or worked in a particular profession.
The remaining variables in a dataset are nonidentifying information (not likely to be recognized as coming from specific individuals or not showing up in external databases). This can include opinions, ratings on Likert scales, temporary measures (such as resting heart rate), and others. These are not part of the confidentiality assessment but still need to be considered in the overall risk assessment. An issue with non-identifying variables is the level of sensitivity of the data — a dataset with confidential health information or a survey that asks sensitive questions about past behaviours needs to be treated with more care than a dataset of product ratings.
A set of records that has the same values on all quasi-identifiers is called an equivalence class. An equivalence class of 1 represents an individual who is unique in the dataset. Such a person may be at risk of being identified and is called a sample unique. If a study contains a complete sample of some population (e.g., everyone employed at a particular place) then this person is also a population unique on those characteristics (and their identity may be obvious to anyone familiar with the population). Correspondingly, members of a large equivalence class — one with 10, 20, or 50 members — are indistinguishable from each other and may not be identified based on their quasi-identifiers, so are not considered to be at risk of re-identification.
Now you know what quasi-identifiers are and that they can be used to narrow down the identity of survey respondents. So, what do you do about them? You could just delete them from the data the same as you do with direct identifiers, but doing so will seriously impact the ability of future researchers to use a dataset. Instead, you need to assess the quasi-identifiers to determine the level of risk.
As a first pass, a data curator might look at the variables in isolation and consider them in context with other information about the data. Quasi-identifying variables containing groups with small numbers of respondents (e.g., a religion variable with three responses of “Buddhism”) may be high risk. Unusual values (e.g., more than six children) can also pose high risk. These can be assessed by running frequencies on the data. However, the size of identifiable groups both in the survey and in the general population needs to be considered. There may be only one person from Winnipeg in your random-digit dialing survey, but if your survey doesn’t narrow it down any further, that person is safe.
A commonsense approach to data de-identification is to describe a person using only the values of the demographic variables in a dataset:
“I’m thinking of a person living in Ontario who is female, married, has a university degree, and is between the ages of 40 and 55.”
This person does not appear to be at risk — unless contextual information provides additional clues. For example, if this were a survey of professional hockey referees.
Unusual combinations of values for variables can pose difficulties. Age, education, and marital status may not seem to be identifying — but what if the dataset contains someone in the Under-17 age group who gave their marital status as divorced or their education as university graduate? That person could be recognizable and is an example of a hidden extreme value that would not show up if you ran frequencies on all the variables in the dataset. The more indirect identifiers in the data, the higher the probability of there being hidden unusual combinations, and the harder it is to check for them. What’s needed is a formal way of assessing the quasi-identifiers and quantifying the level of risk. This process is called statistical disclosure risk assessment.
Statistical Disclosure Risk Assessment
There are different techniques to gauge and limit the risk of re-identification, but the best known is k-anonymity, a mathematical approach to demonstrating that a dataset has been anonymized. It was first proposed by computer scientists in 1998 (Samarati and Sweeney) and has formed the basis of formal data anonymization efforts since then. The concept is that it should not be possible to isolate fewer than k individual cases in your dataset based on any combination of identifying variables — k is a number set by the researcher; in practice, it’s usually 5.
Imagine a survey of workers at a tool and die factory has three demographic variables: age group, gender, and ethnic group. If an individual in the dataset is not a visible minority, is male, and is between 25 and 30, then for the data to have k-anonymity with k=5, there must be at least four other individuals in the dataset with the same set of characteristics. This also must be true for every other individual in the dataset; each person must have at least four data twins.
In Figure 1, cases 1, 6, and 13 form an equivalence class of k=3. Each case in the equivalence class has two data twins. Even if an attacker knew that an individual was in the dataset and was able to match their characteristics against the data, they would not be able to tell which of the three cases was the target individual. Case 14 has no data twins — it is a sample unique.
Figure 1. Attribute disclosure. Green: class with k=3. Yellow: class with k=1.
To achieve k-anonymity with a k of at least 5 in a dataset, use data reduction techniques, including global data reduction and local suppression. Global data reduction is making changes to variables across datasets, such as grouping responses into categories (e.g., age in 10-year increments). Local suppression means deleting individual cases or responses (e.g., deleting the “marital status” response of the participant under 17 years old rather than regrouping the otherwise nonrisky variables “marital status” and “age”).
k-anonymity is intended to guarantee data anonymization — that every record in the anonymized data will be indistinguishable from k minus 1 other records in the same dataset. However, research participants aren’t usually told that no one will know which line of the data file holds their confidential information. They are told their answers will be kept confidential. Even if a person’s record isn’t unique in the data, it may still be possible to figure out some confidential information about them.
Within a few years of k-anonymity being published as a solution to the privacy dilemma, researchers pointed to a serious possible flaw: the homogeneity attack. When values of sensitive attributes are the same for all members of an equivalence class (set of data twins), an attacker may be able to infer the attributes of survey respondents without identifying them. Let’s return to that sample survey of workers. Figure 2 shows you the demographic variables and one sensitive attribute, a question about whether the workers are in favour of forming a union. Cases 1, 6, and 13 still form an equivalence class with k=3. So even if you know which people match those characteristics, you can’t tell which person matches which case. But these three people answered the union question the same way. You now know how all of them answered this question. Confidentiality has been violated.
Figure 2. Equivalence classes. Green: class with k=3. Yellow: class with k=1.
Extensions of k-anonymity, such as p-sensitive k-anonymity and l-diversity (Domingo-Ferrer and Torra, 2008), have been developed to deal with the attribute disclosure issue. However, implementing these is difficult and tends to degrade the research value of the dataset. Let’s consider one of the simpler variants.
A dataset has l-diversity when each group of records sharing a combination of demographic attributes has at least l different values for each confidential variable. In our example dataset, every group of data twins would need to include both “yes” and “no” responses to the union question, since 2 would be the maximum possible value for l for this question. And this would have to be true for some value of l for every confidential answer in the dataset. Now imagine a typical survey with dozens of questions — and each needs to be considered for l-diversity for each equivalence class. So, techniques like l-diversity are only practical to implement in datasets with very few variables.
The greatest threat of a homogeneity attack occurs when a dataset is a complete sample of some population. Imagine the dataset from the workplace survey is only a 25% sample of the population. This means there may be other people who hold the same values on quasi-identifiers as cases 1, 6, and 13, but they’re not in the dataset, so their views on forming a union are unknown. Assuming there’s no way of knowing whether an individual is in the data, being in this equivalence class no longer reveals anyone’s opinions. This is a reasonable assumption where a dataset is a small sample of a larger population and k-anonymity has been satisfied. Conversely, if a dataset is a complete sample of a population or contains a large fraction of it, it needs to be treated with extreme care — it’s almost impossible to be certain that such a dataset has been de-identified.
Hidden Identifiers
When testing for risk, consider the size of a dataset (number of participants and number of variables). With large datasets, attackers may be able to use machine learning approaches. Personal rankings and ratings are considered nonidentifiers; however, Zhang et al. (2012) describe a case where an artificial learning system was trained on a large collection of profiles containing movie rankings and was able to infer with some reliability which accounts had multiple users. It’s easy to imagine other attacks using related approaches — for example, comparing public book reviews on a site such as Goodreads to survey responses that include rankings of books used for trauma-informed book-based therapy. Thompson and Sullivan (2020) demonstrated another approach where unexpected variables could be used to potentially re-identify survey respondents, this time using an attack incorporating geographic information. They demonstrated that a variable showing distance from the nearest major city could be combined with the information that a survey respondent lived on a First Nations reserve to pinpoint the location of some respondents. This would be difficult to do by hand but was easy with a computer.
Cases like these demonstrate why there can never be a simple rules-based mechanic for de-identifying datasets. You’ll always need to consider the data in context with external information or data sources that may overlap with your data population and share some of the same information. Risk of re-identification happens when external information that an attacker may reasonably have access to can be linked to information in an archived dataset, and each dataset needs to be considered individually.
De-identifying Qualitative Data
We usually use statistical methods of anonymizing data on structured data, such as data in a spreadsheet. However, qualitative data are often stored and analyzed in unstructured formats (e.g., interview, focus group, or oral history transcripts in text, audio, or video format, or ethnographic observations detailed in field notes, etc.). It’s still possible to anonymize unstructured qualitative data types, and there are software programs and digital tools that may facilitate or automate this process to certain extents (for an excellent overview, see this panel talk on de-identifying qualitative data, available at: https://www.youtube.com/watch?v=MbKw3LR2rVo).
Sometimes a research participant inadvertently identifies themselves when responding to interview questions or discussing their lived experiences. For example, in a study in which a librarian interviews other librarians at universities, if someone names their institution (McGill) and job title (Research Data Management specialist) in their response, this combined information can reveal their identity. The challenge with qualitative data is that identifying information will not be contained in predetermined categories (e.g., age, religion, gender) so you may not be able to predict how much identifying information is in a dataset prior to data collection and analysis.
A researcher could delete identifying information, similar to approaches with structured data, but contextual information is often vital in qualitative studies, so more often a researcher will assign categorical codes to replace identifying information. The Finnish Social Science Data Archive (FSD) recommends using square brackets to denote cases where de-identification in a transcript has occurred, to avoid commonly used punctuation (Finnish Social Science Data Archive, 2020). For example, a researcher may replace a name with [Participant 1]. Or a specific location, such as Pohénégamook (a small village in Québec), may be replaced with [village]. If geographic context is important, then the code can be changed to reflect a general area rather than a specific village, such as [the Bas-Saint-Laurent region].
When redacting qualitative information or replacing detailed information with categories, document these decisions and the category definitions in a codebook that accompanies the dataset. For example, the researcher may decide to remove names of villages when the population of the village is less than 1,000 inhabitants. This requires a well-documented justification and definition for potential future reuse of the dataset.
Interview transcripts should be anonymized even if the researcher doesn’t intend to publish the data. This reduces the risk of harm in the case of a breach. Anonymization should be irreversible, and when anonymizing, researchers should consider both potential harm to participants if identifiable information were made public as well as the researcher’s ability to analyze the data at the necessary level of nuance. If the purpose of a research project is to analyze a sensitive topic, it might not make sense to de-identify the data, and the data may require additional safeguards.
Consent Language and TCPS 2
When curating human participant data, you must know what safeguards participants were offered and under what conditions any approving REBs permitted the research to take place. In Canada, ethical guidelines for human research participants are outlined in the TCPS 2 policy. At most institutions, the REB will scrutinize consent language more than any other component of an application to ensure participants’ privacy and confidentiality are preserved and that participants are informed about the scope and manner of their participation in the research. In accordance with TCPS 2 guidelines, consent forms should contain the following information:
that their participation is voluntary
that participants may withdraw from the research even after the study is underway
a concise description of the study as well as the potential risks and benefits to participants, all in plain language (e.g., avoiding jargon) — especially important in studies that involve vulnerable populations; socially taboo topics; coercion (e.g., an incentive); and/or deception, in which a participant is not fully aware of the purpose of the research
whether the data will be available to other researchers or to the public, under what conditions, in which specific repository,* and in what format or including what information (e.g., whether it may contain direct or quasi-identifiers)
*REBs may require that researchers identify the repository that will host or publish a data deposit containing human participant data. For example, an REB may require that data are stored or published only in repositories with servers located in Canada or only in a repository with access control (i.e., the ability to restrict access to specific individuals).
Consent forms should include language regarding the eventual deposit or publication of human participant data because researchers may intend to or be required to (e.g., by funders or journal mandates) make their data available following the publication of related research. Otherwise, if a researcher needs or wants to share data, they may be obligated to re-consent participants (amend the consent forms and ask participants to again consent to the study), which may prove difficult or impossible if all direct identifiers have been permanently anonymized.
Some resources provide a template or suggested language for consent forms and REB applications regarding the storing and sharing of human participant data. Digital Research Alliance of Canada (the Alliance) has a Sensitive Data Toolkit for Researchers (Sensitive Data Expert Group of the Portage Network, 2020b) with language you can use in consent forms to explain the following to participants: the difference between anonymity and confidentiality; barriers to withdrawing from the study; parameters for data reuse, including oversight processes (e.g., setting up data-use agreements or requiring potential future research projects to obtain REB permission prior to access to the data); whether the data could be used for other purposes outside of the original research topic; and whether the data or a version of them will be made available to the public. The following example for publishing data following the completion of a study shows some boilerplate language that can be adapted for use in cases where data is likely to be shared. The following example for publishing data following the completion of a study shows some boilerplate language that can be adapted for use in cases where data may need to be shared. The Sensitive Data Toolkit for Researchers (Sensitive Data Expert Group of the Portage Network, 2020b), has many additional examples of this type of language for different circumstances.
Funding agencies and publishers often ask researchers to make their data accessible upon completion of their study. Making research data available to others allows qualified researchers to reproduce scientific findings and stimulates exploration of existing datasets. To ensure confidentiality and anonymity, any shared data would be stripped of any information that could potentially identify a participant.
The Qualitative Data Repository (QDR), based out of Syracuse University in New York, also has informed consent guidance related to qualitative studies, such as interviews or oral histories, where direct identifiers may be retained in the published dataset (Qualitative Data Repository, n.d.b). The QDR also has templates for the publication of archival materials and for getting consent from participants to release de-identified or identifiable data (Qualitative Data Repository, n.d.a). The following is from QDR for the deposit of potentially identifiable information:
Data generated from the information you provide in our interaction may be shared with the research community (most likely in digital form via the internet) to advance scholarly knowledge. Due to the nature of the information, full de-identification of those data might not be possible. As a result, other measures will be taken before sharing. I plan to deposit the data at REPOSITORY X, or at a similar social science domain repository. Your data will BE MADE AVAILABLE UNDER THE FOLLOWING ACCESS CONDITIONS. Despite my taking these measures it is not possible to predict how those who access the data will use them.
The Data Curation Network offers a comprehensive guide to curating human participant data, including how to review consent language. The data curation primer on human participants provides guidance on questions to ask as a repository owner or curator, including the consenting process, consent language, and whether there are gaps between the dataset and the consent language.
Other Categories of Sensitive Data
Human participant data are often considered to be the same thing as “sensitive data,” but some categories of sensitive data do not involve human participants and are equally important. When researchers collaborate with industry partners to develop technologies and inventions, data may be considered “trade secrets” and must be safeguarded according to contractual obligations (Government of Canada, 2021). Although in theory the pursuit of profits as a primary goal is antithetical to academic endeavors, these partnerships provide resources and infrastructure that would otherwise not be available via universities or public funding sources. For example, COVID-19 vaccines were rapidly developed because of partnerships between university researchers and private pharmaceutical companies.
Here are some other categories of sensitive data:
intellectual property
dual-use data
data subject to import/export control
third-party licensed data
locations of endangered species
Intellectual property concerns may arise when data are associated with a pending patent application or research that could be patented or with other copyrighted information. Rights holders can decide whether to grant access or reuse of the data. When intellectual property is connected with potential revenue, it’s not typically released openly or shared. Here are some important considerations regarding intellectual property: who owns the data, the terms of use (or license) for the data, and any conditions for using or reusing the data. Chapter 12, “Planning for Open Science Workflows,” discusses intellectual property considerations in more detail.
Dual-use means data developed for civilian purposes may be used in military applications. For example, when facial recognition technology is developed for a smart phone, the underlying dataset could be used to train similar machine learning models to track political dissidents or deploy weaponized drones. Technical information about critical infrastructure is another example of sensitive data that are defined as dual-use. Canada has regulations and assessment procedures to determine whether research is dual-use and the subsequent level of safeguarding required.
Data that are subject to export/import control (controlled goods), are related to dual-use data in that they are data that have implications for military or intelligence use that may cross the Canadian border (Government of Canada, 2017). There are specific definitions of controlled goods involving weapons that come from the United States. These regulations exist to ensure that researchers are not participating in trafficking weapons or weapons technology whether intentionally or unintentionally.
Third-parties are any entity besides the researcher and the institution. A third party’s use of data requires a license from the data owner. For example, demographers may purchase datasets from Statistics Canada under terms that the data may be used by and shared with only other researchers at the same institution. Data-use agreements stipulate who can access the data, for what purpose(s), and when; where these data may be stored; whether any part of the data can be deposited; and whether the data should be destroyed or retained upon completion of the study. In most cases, these agreements prohibit the researcher from depositing or publishing the underlying dataset used for their research.
Location information about endangered species is a category of sensitive data because of the potential for malicious actors to use the information to harm these species. Consider a project where a researcher places digital geolocation tags on endangered rhinoceroses to track their movements. Poachers who gain access to this data could use it to pinpoint and hunt rhinoceroses, which is an extinction-level threat for this species.
Researchers don’t have to be as concerned about identification of participants when working with these additional categories of sensitive data, but they must be more concerned about safeguarding and cybersecurity measures, legal liabilities and responsibilities, and compliance. Research Data Management (RDM) for these types of data involve encrypted or password protected access (e.g., multifactor authentication, transmitting data securely via a Virtual Private Network (VPN)), secure data storage and backup, avoiding the use of personal devices to interact with the data, and performing a robust security audit to identify potential avenues for a breach.
The Alliance is currently working on a multiyear pilot project to partner with Canadian universities and support the implementation of infrastructure for controlled access to sensitive data. The technology must comply with institutional, provincial, and federal policies and laws and must rely on infrastructure located in Canada. The controlled access project has developed a tool incorporating zero-knowledge encryption so that sensitive datasets can be transferred from a secure repository environment to researchers and vice versa. Zero-knowledge means that the administrators of a system do not have the key to decrypt files on their system. The encryption keys for the data are stored in an independent platform. A researcher who wants access to a sensitive dataset would download the encrypted data from the repository and then receive the password from the key management platform.
Many institutional data repositories at Canadian universities have access to an installation of Dataverse, with many of them using the Borealis Dataverse installation at Scholar’s Portal. Borealis terms of use prohibit sensitive data from being deposited. However, the consortium responsible for the development and maintenance of Borealis has determined that they will defer to REBs to define whether a dataset is sensitive or not. Even though “sensitive” is not a binary – data can be more or less sensitive – defining sensitivity for data deposit may involve complex calculations. Repositories may accept anonymized datasets containing human participants and may not define these as sensitive.
To preserve and share sensitive data, sometimes a researcher will retain data locally but publish a metadata record in their institutional Dataverse collection so other researchers can discover data and procedures for accessing them. Libraries can support this by creating a protected space isolated from the network for secure preservation and backup, where data may be deposited for long-term storage. The library would need to work with the depositing researcher to make sure appropriate access protocols are in place. Suggested deposit language is provided in the following box:
Deposit Form: Terms of Deposit, Retention, Sharing, and Reuse
The depositor grants the library the right to store and securely manage the data, including transforming, moving between platforms, and creating backup copies as necessary for preservation.
indefinitely or until withdrawn
until the following date, after which the data must be deleted
Can a record of this dataset be shared in <local archive> so that people can discover these data? If yes, please provide any restrictions on what documentation should be shared.
Indicate how and under what condition these data can be shared with researchers outside the original research team. Note that your original consent form, if applicable, must allow this reuse.
Data can be shared only with the explicit permission of the following person or persons (e.g., depositor, members of original research team, data review committee, etc.).
Please identify persons and provide contact information.
Data can be shared by request if certain conditions are met (e.g., approval by research ethics board, completion of a secure Data Management Plan explaining how data will be kept secure during reuse project, signing of conditions document).
Please detail ethical restrictions for reuse — include, if applicable, a copy of the original consent form with the data deposit.
Conclusion
When calculating risk and harm, researchers must consider institutional, provincial, federal, and funder policies, laws, and regulations as well as disciplinary norms and contractual obligations. Consider also that harm may be experienced by multiple interested parties, including participants, the institution, the researcher, the community, the nation, and any other affiliated entities.
For this reason, many institutions formally classify sensitive data and define levels of risk and harm on a scale (e.g., very high, high, moderate, and low). Institutions must consider local factors and governance in defining levels of risk, which leads to some concerns. For example, many institutions classify research data and enterprise/administrative data in the same scheme, which makes it difficult to know how to apply risk levels to a given context — as in the University of British Columbia (2018), which classifies all electronic information in the same way with only a generic reference to research data. Other universities have guidelines that incorporate specific examples relevant to research, such as the University of Calgary (2015), which includes “identifiable human subject research” as an example of their highest risk level. Harvard University (2020) has a system dedicated to distinguishing levels of risk and harm for research data, including “data that would put the subject’s life at risk” in their highest category, which is defined as “sensitive data that could place the subject at severe risk of harm or data with contractual requirements for exceptional security measures.”
Libraries provide the tools, information, and education so researchers can preserve and share their data ethically and responsibly. But the researcher or principal investigator (PI) is responsible for conducting due diligence related to risks.
Reflective Questions
In Canada, what is the primary ethical policy related to human participant research data?
List three direct identifiers and three quasi-identifiers of human participant data.
A graduate student is conducting fieldwork on an endangered turtle species along the St. Lawrence River in Québec. In a spreadsheet stored locally on their computer, they track turtles and record the following information about their sightings: latitude and longitude, proximity to the nearest industrial site, and number of turtles present. To what extent is this researcher working with sensitive data?
De-identification is the process of removing from a dataset any information that might put research subjects’ privacy at risk.
Sensitive data are data that cannot be shared without potentially violating the trust of or risking harm to an individual, entity, or community.
Identifying information is any information in a dataset that, separately or in combination, could lead to disclosing the identity of an individual.
Statistical Disclosure Risk Assessment is the process of mathematically assessing quasi-identifiers in a dataset to demonstrate that the data have been anonymized.
In rating the risk level of a dataset, always consider the following: details within the dataset that have the potential, individually or in combination, to re-identify individuals; information external to the dataset that could be matched to data in the dataset or that reveals additional information about the study population; the level of harm that releasing the data could cause to individuals or communities.
The most important privacy regulations for research data are located at the provincial/territorial level, as universities fall outside the scope of the main federal privacy laws. The Privacy Act applies to government organizations and the Personal Information Protection and Electronic Documents Act (PIPEDA) applies to private sector commercial entities. Researchers working with these organizations or using data collected by them (e.g., health records) need to be aware of these pieces of legislation. Provinces and territories in Canada have at least one privacy-related law that could be applied to research, so familiarize yourself with the law where you live. At the national level, the Tri-Council (also the agencies or Tri-Agency) policy statement on the ethical conduct for research involving humans (TCPS 2) is the most important framework governing research conduct.
Henne, B., Koch, M., Smith, M. (2014). On the awareness, control and privacy of shared photo metadata. In N. Christin & R. Safavi-Naini. (Eds.), Financial Cryptography and Data Security. FC 2014. Lecture Notes in Computer Science (pp. 77-88). Springer. https://doi.org/10.1007/978-3-662-45472-5_6
Krafmiller, E. & Prasad, R. (2021, June 16). Sharing sensitive data [Conference presentation]. Dataverse Community Meeting 2021, virtual. In Sharing sensitive data.https://www.youtube.com/watch?v=q3irpQ4rOyU,
Ross, M. W., Iguchi, M. Y., & Panicker, S. (2018). Ethical aspects of data sharing and research participant protections. American Psychologist, 73(2), 138-145. http://dx.doi.org/10.1037/amp0000240
Domingo-Ferrer, J. and Torra, V. (2008). A critique of k-anonymity and some of its enhancements. Third International Conference on Availability, Reliability and Security, ARES, IEEE, 990-993. https://doi.org/10.1109/ARES.2008.97
Sensitive Data Expert Group of the Portage Network. (2020a). Sensitive Data Toolkit for Researchers Part 1: Glossary of Terms for Sensitive Data used for Research Purposes.https://doi.org/10.5281/zenodo.4088946
Sensitive Data Expert Group of the Portage Network. (2020b). Sensitive Data Toolkit for Researchers Part 3: Research Data Management Language for Informed Consent.https://doi.org/10.5281/zenodo.4107178
Thompson, K., & Sullivan, C. (2020). Mathematics, risk, and messy survey data. IASSIST Quarterly, 44(4), 1-13. https://doi.org/10.29173/iq979
Zhang, A., Fawaz, N., Ioannidis, S., & Montanari, A. (2012). Guess who rated this movie: identifying users through subspace clustering. Proceedings of the Twenty-Eighth Conference on Uncertainty in Artificial Intelligence, 944-953. https://dl.acm.org/doi/10.5555/3020652.3020750
About the authors
Dr. Alisa Beth Rod
Dr. Alisa Beth Rod is the Research Data Management Specialist at the McGill University Library. Alisa holds an MA and PhD in Political Science from the University of California, Santa Barbara and a BA in Bioethics from the American Jewish University. Prior to joining McGill, Alisa was the Survey Methodologist at Ithaka S+R and then the Associate Director of the Empirical Reasoning Center at Barnard College of Columbia University. She has an extensive background collecting and working with human participant data in the context of survey research, qualitative methods, and GIS.
Kristi Thompson
Kristi Thompson is the Research Data Management Librarian at Western University, and previously held positions as data librarian at the University of Windsor and data specialist at Princeton University. She has a BA in Computer Science from Queens University and an MLIS from Western University. Kristi supports research projects, administers data archiving software, works with Western’s Research Ethics boards, and is involved at a national level with developing research data infrastructure. She co-edited the book Databrarianship: the Academic Data Librarian in Theory and Practice and has published on topics ranging from data anonymization algorithms to intergenerational psychology. kthom67@uwo.ca | ORCID 0000-0002-4152-0075
Managing Qualitative Research Data
14
Dr. Joel T. Minion
Learning Outcomes
By the end of this chapter you should be able to:
Identify what distinguishes qualitative data from other forms of research data.
Understand the iterative processes by which qualitative researchers generate and manage data.
Describe ways Research Data Management could better encompass qualitative data and the needs of qualitative researchers.
Advocate for greater inclusivity of all types of research data in Research Data Management principles, policies, strategies, and practices.
Introduction
Sound data management is essential to research excellence. Most higher-learning institutions support initiatives in this area, but few such efforts focus on qualitative data or its researchers. Attend the average training session and you’ll be forgiven for thinking that Research Data Management (RDM) applies primarily to data involving numbers or geospatial images. While exceptions exist (e.g., the First Nation Principles of OCAP® — ownership, control, access, possession), acknowledgement of qualitative research data often feels like an afterthought. This is probably because qualitative data are highly descriptive, typically text or voice based, and collected solely from humans, which makes such data particularly identifiable. Qualitative data also require researchers to account for social context and relationships, and are commonly generated by studies involving sensitive topics and marginalized communities. Such challenges mean qualitative research data seldom fit neatly into prevailing RDM frameworks.
In this chapter, we’ll consider why this area of RDM remains underexamined and how deficiencies might be addressed. The content reflects what I have learned over 25 years spent variously as a librarian, qualitative health researcher, data manager, and educator in Canada and Europe. Like many of my qualitative colleagues, I struggle to fit myself into existing RDM principles, policies, strategies, and practices. There are few experts on this topic and only limited resources, so this chapter is not a how-to guide.
There are many forms of qualitative data and myriad ways in which they can be generated, analyzed, organized, archived, shared, and in some cases, reused. We’re going to discuss where the management of qualitative data fits within the research process. If you’re a researcher, this means exploring how to think about and organize your data more effectively. If you’re a librarian, archivist, or other type of data specialist, the discussion should augment your information management skills with a stronger understanding of how qualitative data come to be.
The chapter is divided into three sections: (1) the nature of qualitative research data, (2) how such data reflect the qualitative research process, and (3) RDM-related challenges when collecting qualitative data. Finally, we’ll discuss how to improve the management of qualitative research data.
The Nature of Qualitative Data
Qualitative data are created and analyzed in ways dissimilar to quantitative and digital humanities data. This doesn’t mean that different types of research data are mutually exclusive or cannot work together. Many researchers use multiple methods in their research, such as combining interviews with psychometric testing to answer a question, like “How is clinical depression experienced by individuals caring for a partner living with early stage dementia?” Such approaches illustrate the interconnectedness of different types of research data.
What Makes Research Data Qualitative?
Qualitative data share no single philosophy or set of methodological principles. They are data generated by research examining social aspects of the human condition using descriptive methods rather than measurement. Researchers can engage with and observe individuals in a multitude of ways to understand how people interact and make sense of their world in different settings: at home, work, in the community, while receiving healthcare, and so on. Qualitative research has its roots in the social sciences, particularly anthropology, sociology, and psychology, though researchers from other disciplines also work from a qualitative perspective. For example, researchers in nursing commonly use qualitative data to examine patients’ lived experiences.
Qualitative data can be collected during a single point of contact or through interaction over an extended period. What is captured is always filtered through the researcher and their experience and interpretation of interactions with participants. In this way, the researcher becomes an integral part of the data. Qualitative data are important because they provide information that cannot otherwise be measured or counted, such as how Afghani refugees make sense of government services when arriving in Canada or what it’s like to compete as a Paralympian or why some people are drawn to alt-right movements.
What Do Qualitative Data Look Like?
The most common ways to generate qualitative data are interviews, focus groups, and observations (e.g., you could interview refugees one on one about their experiences, hold focus groups with athletes, or watch what happens during an alt-right gathering). These are often used because they are relatively straightforward to learn and practice at a basic level. Other methods include oral histories, participant diaries, photography/videography, document analysis, artifacts (e.g., food, clothing), and open-ended survey questions.
These methods can be used in combination, resulting in interconnected datasets. A researcher interested in how climate scientists collaborate may conduct observations at a conference, where they also interview attendees and gather presentation handouts. Qualitative researchers often keep reflexive journals to reflect on their place within a project, to capture emergent ideas, and to identify new lines of inquiry. Researchers may also turn to social media for data, such as examining online discussions where people interact independent of the researcher. While a qualitative lens is increasingly applied in this way, the focus of this chapter is on data collected by a researcher.
Exercise: Working with Less Common Forms of Qualitative Data
Imagine you are the data librarian at a university. A graduate student asks for advice on how to manage data collected for a study of people undergoing treatment for cervical cancer. The methods will involve interviews combined with photovoice, an approach about which you know little. Skim the paper below and identify questions to ask about the photographs being collected and how these might be managed.
Wang, C., & Burris, M. A. (1997). Photovoice: Concept, methodology, and use for participatory needs assessment. Health Education & Behavior, 24(3), 369-387. https://doi.org/10.1177/109019819702400309
While qualitative data come in a variety of forms, text is by far the most common. Interviews and focus groups are typically audio-recorded using hand-held devices, with recordings then transcribed for analysis.
The Complexity of Transcribing
Transcription is time consuming and challenging to do without proper equipment (e.g., good headphones, specialized software). Many qualitative researchers outsource this work, though doing so can raise concerns about cost and a possible need to transfer data out of Canada.
The process also requires researchers to decide how much detail to transcribe. Is every “umm,” “err,” or false start to be captured (often referred to as “full verbatim”)? Or is the goal simply to produce a readable version of what was said (“verbatim”)? Such decisions are critical because different forms of qualitative analysis require specific levels of transcription.
Finally, all transcripts must be verified for accuracy prior to analysis. This involves listening to each recording while reading the transcript to catch mistakes and omissions.
Video recording is less common, in part because some participants find it more intrusive, so it may require a higher level of buy-in before people agree to take part. Video can also be more demanding to analyze. Observational data is usually captured using handwritten, typed, and/or audio field notes depending on circumstance and version (e.g., handwritten in the field with dictated audio notes created and transcribed later).
Less common forms of qualitative data vary widely in how they are handled. Hard copies, like meeting minutes or conference handouts, likely require scanning prior to storage and analysis. Participant diaries may need to be typed before they can be analyzed. Digital photographs can be stored in different formats depending on a researcher’s needs and preferences, while artifacts may be photographed or worked with in their original form using notes.
How Qualitative Data Become New Knowledge
Effective management of qualitative data requires understanding the analytic process. A biologist measuring fish populations in northern lakes will probably use a software program (e.g., SPSS, Stata, R) to analyze their data statistically, but how does a sociologist extract meaning from an interview transcript? Most often, doing so involves working inductively upwards from the data to identify higher order concepts and meanings. The goal is to look beyond what was said, heard, observed, photographed, and so on, to recognize ideas crosscutting an entire dataset. With text-based data, analysis may involve coding and use of qualitative data analysis software (e.g., NVivo, Quirkos). While software can handle large volumes of data, the programs themselves do not analyze data. That’s the researcher’s job. Furthermore, not all qualitative researchers code or use software. Some prefer using paper copies of transcripts, highlighters, pens, and index cards.
In some respects, data can be the most straightforward part of the qualitative research process. After all, transcripts from different focus group studies generally look the same: pages of text capturing what was said and by whom. The content, however, will reflect who was conducting each study and why. An anthropologist and a psychologist are likely to approach the same topic differently and ask contrasting questions. Data only take on meaning when they are analyzed. This process is complex because there is no single ontology, epistemology, theory, or mode of analysis crosscutting all forms of qualitative research. Researchers work from their own perspectives, so the same data could be interpreted in different ways depending on who is conducting the analysis and to what end.
Understanding Qualitative Research
To effectively manage qualitative data, you need to understand how qualitative research takes place. We’ll consider qualitative research practices from a data perspective. The aim is to link qualitative data to three key elements in the research process: how research teams are structured, the implications of such structures for data generation, and the place of participants in qualitative research.
Unlike its quantitative counterpart, which frequently turns to well-established processes (e.g., randomized clinical trials in medical research, validated survey instruments in psychology), qualitative research is more evolutionary and flexible. For instance, interview questions can evolve significantly into new, follow-up lines of inquiry across discussions with multiple participants. It’s even possible to add or remove data types once a study is underway (which would be the case, for example, if photographs prove not to be as useful as anticipated). Such decisions are never taken lightly, but that such changes are possible is characteristic to qualitative research.
Qualitative Research Teams
There can be considerable variation in the composition of research teams that use qualitative approaches to collect data. The range includes the following:
A researcher or graduate student (e.g., someone with a small grant to conduct 20 interviews about how single parents manage childcare concerns)
A group of researchers within a university or department (e.g., a senior academic and two postdoctoral fellows using focus groups and city planning documents to study proposed changes in urban traffic patterns)
A larger team from different disciplines at multiple universities (e.g., six mid-career researchers from energy engineering, business, and organizational psychology using observations and interviews to explore communication networks in teams installing offshore wind farms)
An international, multidisciplinary group of researchers collaborating across countries and field sites (e.g., three dozen researchers, graduate students, clinicians, and patient partners studying the impact of long COVID-19 on health outcomes in Canada, the United States, and the United Kingdom using interviews, analysis of medical records, and a longitudinal survey)
Over their careers, researchers may be involved in several such arrangements, though most will likely develop a preference or specialized skill set for one or two approaches in particular.
Any time a study team involves more than one researcher, there will almost certainly be relational hierarchies and contrasting levels of expertise, which translate into differing roles and responsibilities. As in quantitative research, a principal investigator (PI) is the researcher who leads a project and who may be supported by one or more co- or sub-investigators. The PI holds authority for a study and is accountable to institutions, funders, and ethics boards for how a project unfolds. In large teams, the PI may have little direct involvement in day-to-day research activities, including data generation and management. Early career researchers (e.g., graduate students, postdoctoral fellows) are frequently responsible for collecting, processing, organizing, and securing data.
The Relationship Between Research Teams and Data
The structure of a study team has implications for how qualitative research is conducted and what data are generated. Two elements in the relationship between teams and data are worth highlighting.
The first concerns the iterativenature of qualitative research and how this affects the data. Qualitative data are often analyzed from the moment they are collected, meaning data now influence data to come. For example, a researcher will use what they learn in one interview to determine what to ask in the next. Changes could be minor (e.g., a question reframed to make it clearer) or substantial (e.g., an entire line of questioning is added or dropped). Larger studies often rely on peer debriefing throughout data collection to generate new insights, address practical challenges, and enhance researchers’ skills. In this way, qualitative data are collected in a reflexive, progressive manner.
The second element in the relationship involves the division of roles and responsibilities within teams and how these can imprint on data. Because qualitative data are closely tied with the circumstances of their collection, who collects the data will impact what is collected. Unless details about the collection process are captured, qualitative data can lose their capacity to support rigorous analysis. For instance, focus group transcripts require particulars about the participants (e.g., age, profession, level of education) as well as field notes about the tone of the discussion and how participants interacted (e.g., rolled eyes are not caught on audio recordings).
Allowing each researcher on a team to capture and process their own contextual data introduces potential variation and possible omission of critical details. One way to avoid this is to assign a few people to serve as data stewards (ideally more than one in case that person leaves the project) who help ensure data management (e.g., file naming, folder structures) is consistent.
Exercise: Capturing Context
Congratulations! You’ve just been hired as a postdoctoral fellow for a study involving the observation of verbal and behavioural exchanges in Canadian courtrooms. The aim is to explore differences in interactions involving judges, lawyers, plaintiffs, and defendants from visible minority populations. The project team comprises a PI, one co-investigator at another university, two other recent PhD graduates located elsewhere, a study coordinator, and one master’s student.
The study will require up to 600 hours of observations by four team members in five cities. Because none of you will be able to speak to or record anyone being observed, data collection is limited to handwritten fieldnotes that each researcher will type and share afterwards.
The team has discussed which exchanges they are most interested in capturing. It becomes apparent, however, that the data collectors also need to capture context details more consistently. Your task in this exercise is to identify: (1) which information researchers should be recording beyond the exchanges themselves, (2) how such information might be collected systematically, and (3) how to link the contextual data to the courtroom data.
An audit trail is another practice helpful in qualitative research. This documentation tracks activity and decision making throughout the life of a project, detailing what took place, when, and why. Some of this will be captured in the data itself, but on larger projects a separate document accessible by multiple team members can be critical. The information recorded connects what is taking place at the team level to data generation in real time. For example, an audit trail helps a team avoid trying to recall when and why they decided midway through a project to introduce a new field site or data collection method. Unfortunately, there are few standards on how to create and manage such documents in qualitative research. As we will see in the final section, bringing together researchers and data/information specialists can address such challenges.
The Social Dimension of Qualitative Research
No overview of the qualitative research process is complete without acknowledging study participants. Qualitative research is relational, meaning researchers often interact directly with individuals taking part in a study. This relationship may be fleeting, as in the case of one-off interviews conducted by phone, though even these connections can require efforts to develop rapport with individuals during recruitment. Relationship building is critical in studies where contact is substantial and prolonged, and when researchers are interacting with individuals from marginalized or stigmatized communities, who otherwise may be hesitant to take part in research for fear of disclosure or out of fear that their data will be used against personal or community interests. While ethical oversight governs some aspects of these relationships, they can be complex for researchers in very practical ways. How close is too close? Can the researcher believe what they are being told? Is a key informant representative of a community — or are they an outlier? Addressing such concerns requires researchers to think critically about their role in the research process and the impact this can have on the data.
Data Generation
Qualitative data generation has its own challenges. Researchers must adhere to requirements (e.g., ethical, institutional, professional) governing what they can and cannot do, and studying humans in naturalistic settings can be messy. We’ll talk about governance of qualitative data generation and consider three specific issues that impact how data are gathered: participant recruitment, field site location, and the evolving relationship between study participants and their data.
Governance of Data Generation
In qualitative research, data are never generated without permission or some form of exemption. Besides the informed consent of participants, the most important authorization comes through ethics approval, whereby researchers submit study particulars to an independent ethics body, detailing among other things what data will be gathered, how it will be organized and stored, and how people will make informed decisions on whether to contribute data. For studies involving humans, researchers in Canada (including graduate and undergraduate students) usually need to complete the TCPS 2: CORE-2022 course before applying for ethics approval. This training details researchers’ obligations when collecting and handling data as well as the rights of study participants.
Once a study receives ethics approval, researchers must do what they said they would do. Any modifications (e.g., changes in recruitment methods, expansion of the data collected) require submission and approval of an ethics amendment prior to being implemented. Ethics approval also sits alongside other data-related requirements, such as those maintained by universities (e.g., how long data must be stored). Data generated outside of such precepts is unusable.
Sometimes data collection doesn’t require ethics approval, such as when a qualitative study is conducted as a service evaluation or quality improvement initiative. This approach may be the case in health research that doesn’t involve the public and is of low risk to participants (e.g., clinicians) — for example, in a study of physiotherapists about their experiences treating clients who use wheelchairs. Screening tools may be used to determine whether a full ethics review is required (e.g., ARECCI). Data generation for service evaluations is generally less rigid (e.g., informed consent may not be required) but seldom less rigorous. The data typically look like those from any other qualitative study and are analyzed and reported in much the same way.
Common Challenges
Data generation does not always unfold smoothly. Two challenges, recruitment and field site location, are well known, while a third is still evolving: participants’ relationship with their research data.
Recruitment
Without participants, there can be no qualitative data. How individuals are recruited into a study and tracked becomes reflected in their data. Potential participants must first be identified, a process that can be demanding and slow. Study samples may need to be balanced along factors such as age, sex, or education. Capturing how recruitment unfolds can help make sense of the data. Which details are recorded will vary by study, but they will likely include the following:
who has been contacted, how many times, and how they have responded
date(s), time(s), and details of data collection (e.g., researcher name, field location)
state of the data (e.g., being transcribed, being anonymized, ready for analysis)
restrictions on how data can be used (e.g., if a participant does want to be quoted directly)
whether recontact is permitted
All recruitment records must be kept confidential and separate from the data to prevent re-identification. While conventionally not seen as data, recruitment details can be a critical form of metadata. For example, such information can highlight when a key informant entered a study or whether an interview was with a teacher or teacher’s assistant. This level of detail is not always captured in the data.
Field Site Location
A second challenge in data generation is field site location. Qualitative researchers routinely go where participants are, which can present a variety of obstacles. Picture yourself as a researcher in an unusual location (e.g., a remote Arctic community, an urban tent encampment, or a hospital emergency department at 2:00 a.m.) and ask yourself:
How will I capture data? (e.g., audio-recorder, pen and paper, photographs)
What if my chosen approach fails? (e.g., batteries run out, a pen will not write in cold weather)
How can I digitize, secure, and/or back up my data? (e.g., scan fieldnotes, remove files from audio recorders, copy data to the cloud)
Can I transfer data for processing? (e.g., sending recordings to a transcriber requires a reliable Internet link)
How do I share data with other team members or my academic supervisor?
Will data need to be translated? How can I ensure confidentiality and integrity throughout this process?
While quantitative researchers may encounter similar problems, their qualitative counterparts only collect identifiable and potentially sensitive human data, which can make field site challenges particularly difficult to address.
Exercise: Collecting Data Far from Home
Dr. James Cummings is a British sociologist who conducted an ethnographic study of gay men’s experiences in Hainan, China. In a newspaper article, he reflected on the challenges of working with research participants who needed to keep aspects of their lives invisible. Read the article and consider Dr. Cummings’s experience generating and managing research data. What obstacles would he have faced? How might these be similar or different for a researcher studying similar communities in a Canadian setting? How might RDM practice be improved to better support this type of field site?
Data are no longer seen as something over which participants have little control. Some research participants (e.g., those taking part in a professional capacity, such as clinicians or public officials) ask to review and amend their data before giving consent for its use. Because such requests are not common, tracking changes made to the data (e.g., edits to an interview transcript) can be tricky, and there are few best practice guidelines.
This connection between participants and their data is shifting significantly. There has been a growing ethical argument that individuals who take part in research have a right to be informed of any findings arising from their data. Questions have also been raised about making qualitative data available for secondary analysis. How much say should research participants have in how their data are used now or in the future? And what are the ethical, legal and social implications (ELSI) for researchers in accommodating such choices?
One approach is the use of dynamic consent, which allows research participants to remain engaged (if they wish) with their data over longer periods of time and to revisit their original decisions about consent. Where interview transcripts are archived in a repository or data library (e.g., Borealis in Canada, the Qualitative Data Repository at Syracuse University, or the UK Data Service) access is frequently restricted given the identifiability of the material. Dynamic consent allows future researchers to recontact former study participants for permission to reuse their data in new ways. Patients and families involved in some fields of research (e.g., rare diseases) are often interested in maximizing use of their data if such efforts improve the likelihood of a medical breakthrough. While dynamic consent is used primarily for quantitative data, the underlying concept reflects broader shifts in the relationship between research participants and all forms of data.
Qualitative Research Data Meets RDM
This final section returns the discussion to where we started: acknowledging the need for RDM principles, policies, strategies, and practices that speak specifically to qualitative data.
The Processing of Interview Data
Qualitative data do not arrive ready for analysis. They almost always require considerable processing, and each step can create additional versions of the same underlying data, so RDM practice can be almost as iterative as the research it supports.
In the following worked example, the table tracks modifications to a single interview between the time a discussion is recorded to when the data are ready to be analyzed (in this case, coded using NVivo software). Each row represents the creation of a new file.
Table 1.The iterations of a qualitative interview.
Data File
File Name
Observations
Complications
Audio-recording
(data as originally captured)
CG_CLIN_INT_P14
Highly identifiable data that are seldom shared beyond study team
Data may be broken into 2+ files if interview is interrupted or long; two similar recordings may exist if back-up recorder is used
Transcript — original
(version received from transcriber)
CG_CLIN_INT_P14_o
Likely to contain multiple transcription errors
May require re-formatting for consistency if different transcribers are used
Transcript — verified
(version after being checked against original recording)
CG_CLIN_INT_P14_v
Track changes useful but can result in sub-versions (i.e., tracked, accepted)
Variation more likely if same person does not verify all interviews
Transcript — edited
(version after being changed at participant’s request)
CG_CLIN_INT_P14_e
Likely to require notes about edits; usually done using verified version of data
Could force decision about whether to include data if requested edits are significant
Must decide whether to anonymize interviews individually or collectively
Anonymization keys are highly disclosive and must be kept separate from data
Transcript — NVivo
(version imported into software and edited further)
CG_CLIN_INT_P14_NV
Copy edits in NVivo are not captured in earlier versions
Version resides within NVivo ecosystem unless downloaded
This table demonstrates how one transcript can exist in multiple versions. Most are transitional, although this worked example is fairly basic. Any number of factors could complicate how the interview data in question are handled. These include the following:
participants being interviewed more than once
interviews requiring translation during or after transcription
transcripts needing to be linked to other data files (e.g., field notes or photographs associated with the same participant)
Exercise: Interview a Qualitative Researcher
This exercise invites you to interview a qualitative researcher about how they manage their data. Start by identifying someone who routinely uses qualitative methods and has a reasonable working knowledge of processing qualitative data (so perhaps not a graduate student). Ask to see their file folder structure (for ethical reasons, you will probably not see specific data). Have the researcher walk you through the types of files they are keeping. Consider how the folders and files have been organized and named. Ask questions about what the researcher has kept, where, and why. Reflect on what you have learned and, if appropriate, propose ways to improve the researcher’s current approach to data management.
Data processing is not always as complex as in the worked example. Qualitative research has been conducted successfully for decades using simpler approaches that still manage to get the job done. Nevertheless, researchers can always improve, particularly as new RDM requirements emerge. Open scholarship demands that, wherever possible, qualitative researchers begin to manage their data in ways compatible not just with research excellence but with an eye to possible sharing and reuse. This transition has implications for two practices still not common among qualitative researchers: metadata and data archiving.
Attaching metadata to qualitative research data can be problematic because qualitative data require contextual detail, but context is disclosive. How do researchers describe data adequately while maintaining confidentiality? For example, metadata indicating that data come from a study of clinicians’ perspectives on providing compression therapy in a community clinic are likely too simple. Recording that the participants were nurses with the same specialist training, that the clinic was at the forefront of developing an innovative approach to compression garments, and that the patients all lived with type 2 diabetes increases the usefulness of the data, though such information heightens the risk of disclosure and re-identification. This is less of an issue for metadata used by individual researchers or within study teams when conducting primary data collection and analysis. But what about metadata to facilitate secondary analysis by external researchers? Metadata standards specific to qualitative data are difficult to find. This isn’t a significant issue in 2023, because qualitative data are seldom placed in repositories, much less made openly available without restrictions.
Many qualitative researchers remain hesitant to archive their data and open it to reuse, and funders don’t demand that researchers do so. Sharing qualitative data also raises issues for recruitment because most researchers tell participants that their data won’t be accessible to anyone outside the study team. Such practices are likely to change as open data principles become embedded in more qualitative-centric disciplines and as funders’ expectations shift. We see this already in the Indigenous data sovereignty movement, which raises fundamental questions concerning metadata and ownership. (For more information see chapter 3, “Indigenous Data Sovereignty.”) Many of the same concerns are being raised by and about other identifiable groups within society. For example, who must be consulted when making RDM-related decisions about data collected from religious or minority ethnic communities? Who gets to decide how those data should be described, archived, and potentially reused? Read chapter 12, “Planning for Open Science Workflows,” for more about open data.
Finally, the most significant challenge illustrated by the worked example is determining which version of the data is definitive. Original recordings are the most accurate and descriptive, but they are highly disclosive. Verified, anonymized transcripts seem the likely choice, but how can researchers ensure identifying details have been removed? Are intermediate versions kept and for how long? If a host institution requires data be stored for five years following completion of a study, does this apply to all versions, or can some be deleted? Such questions can be asked about every data type generated in a qualitative study, making the management of qualitative data remarkably complex.
A Co-Production Model of RDM and Qualitative Data
The worked example raises the question of whether effective management of qualitative data is a realistic expectation of RDM principles, policies, strategies, and practices. The advent of the First Nations Principles of OCAP® — a significant and important framework still being translated into practice and detailed more in chapter 3, “Indigenous Data Sovereignty” — suggests that it is. So how might such a goal be achieved? As a rule, qualitative researchers don’t have the information management expertise needed to develop RDM best practice. Conversely, librarians, archivists, and data managers often can’t speak to the complexities of qualitative data and their associated research processes.
In 2020, while working on a study examining co-production in healthcare, I attended yet another RDM training session that didn’t speak to my type of research or my data management concerns. But a light bulb went on when I realized that researchers and data/information specialists have complementary skill sets. If they worked together, the result could be a better system for managing qualitative data.
For co-production to be effective, it would need to be highly collaborative and draw upon the best of both worlds. Our discussion ends with a possible roadmap for how such cooperation might be enacted:
Qualitative researchers would be responsible for the following:
ensuring all RDM partners understand qualitative data and research processes
guaranteeing that data management practices in study teams are consistent and maximize the analytic value of data
securing funds to underwrite RDM-associated project costs (e.g., hiring a digital archivist or suitably skilled research associate)
advocating for research cultures to support data sharing wherever possible
using their professional status and networks to communicate to funders and institutions the challenges and costs inherent in managing qualitative data
Data librarians, archivists, and other data specialists would be responsible for the following:
applying library and information/data science principles and best practice to the management of qualitative data
helping researchers create final datasets (with associated metadata) that meet or exceed the requirements for research excellence
using their professional links to stay abreast of and disseminate developments in qualitative RDM practice
Together, both groups would be responsible for the following:
establishing and advancing effective standards for managing qualitative data
developing and delivering RDM training
advocating that future RDM principles, policies, strategies, and practices embrace all forms of research data
Conclusion
This is both an exciting and frustrating time to be involved in the management of qualitative research data. Opportunities abound to drive forward new principles, policies, strategies, and practices. At the same time, most qualitative researchers struggle to locate themselves in existing RDM frameworks. Institutions, funders, and RDM practitioners are each grappling with how to address the needs of research communities. While qualitative data are not wholly exceptional (they are, after all, frequently used in conjunction with other types of research data), they remain distinct in many respects. Such complexities highlight the limitations of broad-brush approaches to RDM as well as the need to expand data management to better incorporate all disciplines, fields of research, and methods of inquiry.
Data generated through qualitative research are complex because they are human based, iterative, context dependent, and highly challenging to de-identify.
Such data are difficult to situate within existing RDM principles, policies, strategies, and practices.
Effective management of qualitative research data must understand and reflect the research processes at play, including changing expectations around data archiving and reuse, and shifting responsibilities to study participants.
Together, researchers and data/information specialists are well positioned to co-produce new approaches to RDM that better meet the needs of qualitative researchers and their data.
Acknowledgment
Dr. Minion sincerely thanks Dr. Naomi Adelson and Dr. Tamara McCarron for their invaluable feedback on earlier versions of this chapter.
Additional Readings and Resources
Adelson, N., & Mickelson, S. (2022). The Miiyupimatisiiun research data archives project: Putting OCAP® principles into practice. Digital Library Perspectives, 38(4), 508-520.
Budin-Ljøsne, I., Teare, H. J. A., Kaye, J., Beck, S., Bentzen, H. B., Caenazzo, L., Collett, C., D’Abramo, F., Felzmann, H., Finlay, T., Javaid, M.K., Jones, E., Katić, V., Simpson, A., & Mascalzoni, D. (2017). Dynamic consent: A potential solution to some of the challenges of modern biomedical research. BMC Medical Ethics, 18(1), 1-10. https://doi.org/10.1186/s12910-016-0162-9
Chauvette, A., Schick-Makaroff, K., & Molzahn, A. E. (2019). Open data in qualitative research. International Journal of Qualitative Methods, 18, 1-6. https://doi.org/10.1177/160940691882386
Corti, L. (2019). Archiving qualitative data. In P. Atkinson, S. Delamont, A. Cernat, J.W. Sakshaug, & R.A. Williams (Eds.), SAGE research methods foundations. SAGE Publications. https://dx.doi.org/10.4135/9781526421036813114
Diaz, P. (2021). Introduction: Archiving qualitative data in practice: Ethical feedback. Bulletin of Sociological Methodology, 150(1), 7-27. https://doi.org/10.1177/0759106321995678
DuBois, J. M., Strait, M., & Walsh, H. (2018). Is it time to share qualitative research data? Qualitative Psychology, 5(3), 380-393. https://doi.org/10.1037/qup0000076
Mannheimer, S., Pienta, A., Kirilova, D., Elman C., & Wutich, A. (2019). Qualitative data sharing: Data repositories and academic libraries as key partners in addressing challenges. American Behavioral Scientist, 63(5): 643-664. https://doi.org/10.1177/0002764218784991
Moon, K., & Blackman, D. (2014). A guide to understanding social science research for natural scientists. Conservation Biology, 28(5), 1167-1177. https://doi.org/10.1111/cobi.12326
Pels, P., Boog, I., Florusbosch, J. H., Kripe, Z., Minter, T., Potsma, M., Sleeboom-Faulkner, M., Simpson, B., Dilger, H., Schönhuth, M., Poser, A., Castillo, R. C. A., Lederman, r., & Richards-Rissetoo, H. (2018). Data management in anthropology: The next phase in ethics governance? Social Anthropology, 26(3), 391-396. https://doi.org/10.1111/1469-8676.12526
Saunders, B., Kitzinger, J., & Kitzinger, C. (2015). Anonymising interview data: Challenges and compromise in practice. Qualitative Research, 15(5), 616-632. https://doi.org/10.1177/1468794114550439
Wang, C., & Burris, M. A. (1997). Photovoice: Concept, methodology, and use for participatory needs assessment. Health Education & Behavior, 24(3), 369-387. https://doi.org/ 10.1177/109019819702400309
About the author
Dr. Joel T. Minion
Dr. Joel T. Minion, PhD MLIS MA BA (Hons) is a qualitative health researcher, librarian, data manager, and educator with experience in Research Data Management (RDM) in both Canada and Europe. He is currently a Research Scientist with the Faculty of Nursing’s Translating Research in Elder Care (TREC) research program at the University of Alberta, where he is responsible for legacy planning and asset protection of TREC’s longitudinal data. Joel was previously Qualitative Research Lead for the University of Calgary’s Health Technology Assessment Unit in the O’Brien Institute for Public Health, and before that a Senior Research Associate with Newcastle University’s Policy, Ethics and Life Sciences (PEALS) Research Centre in the UK. He holds a PhD in health informatics from the University of Sheffield and a MLIS degree from Western University. Since 2010, Joel has been actively involved in managing qualitative research data and ongoing efforts to integrate it into broader RDM frameworks.
Managing Quantitative Social Science Data
15
Dr. Alisa Beth Rod and Dr. Biru Zhou
Learning Outcomes
By the end of this chapter you should be able to:
Define different types of quantitative social science data.
Describe specific ways Research Data Management practices might be implemented when working with quantitative social science data.
Understand how good Research Data Management practices can help mitigate the reproducibility crisis and facilitate data deposit for reuse in the quantitative social sciences.
Introduction
The first step in managing quantitative research datain the social sciences is to review the typical research design and identify where Research Data Management (RDM) practices could be applied to facilitate research and bolster research outputs. Most quantitative social science research follows scientific study designs. These designs help researchers generate research questions, formulate hypotheses and concrete predictions, design the research project, collect and analyze the research data, and write up the results to communicate the findings to the public. To contextualize RDM in quantitative social science research, it is important to be aware of the process and workflow of these types of research projects. The next section will provide an overview of quantitative social science research studies as context for the remaining sections on quantitative social science data management.
Overview of Quantitative Social Science Research
There are two fundamental overarching approaches to quantitative social science research that may have implications for the collection and management of data. One approach researchers use is a descriptive design, which aims at exploring a phenomenon or observation to describe an effect (de Vaus, 2001). Common descriptive research includes studies performed by governments (e.g., household income levels, public library usage, noise complaints, traffic around cities over time, etc.). The goal of descriptive research is to describe social, economic, or political phenomena without delving into the cause of these phenomena. Research questions using descriptive designs might include:
What is the poverty level of rural communities?
Is the level of social inequality increasing or declining across Montreal?
Where in Toronto are people more likely to be apprehended and convicted of crimes?
Who is more likely to be apprehended and convicted of crimes in Alberta?
Another approach researchers may use in studying social phenomena is an explanatory design, which aims at explaining a phenomenon or observation in order to understand an effect (de Vaus, 2001). Explanatory studies are concerned with understanding the cause(s) of social, economic, and political phenomena. Explanatory studies are natural extensions of established descriptive research. For example, if a descriptive study establishes that a certain neighbourhood in a city has a significantly higher eviction rate than all other neighbourhoods, an explanatory study might investigate the reasons or causes for this discrepancy. Research questions using explanatory designs might include:
Why is the eviction rate in “y city” highest out of all cities in Canada?
Why are school buses significantly delayed in “z community”?
Why is the poverty level in “x community” the highest in Manitoba?
Regardless of which approach is used for the study, the first step in the research process is to articulate a research question or a set of research questions. A research question states the purpose of the study in the form of a question. The following list includes some examples of the structure of potential research questions (with x, y, and z serving as placeholders for concepts):
What is the relationship between x and y?
How does the location of x affect y?
What structural or demographic factors predict x, y, and z?
Why does x affect y?
Here are some examples of versions of these questions incorporating real-world social concepts:
What is the relationship between poverty and education?
How does the location of public libraries affect community cohesiveness?
What structural or demographic factors predict unemployment, economic insecurity, and demand for subsidized housing?
Why does personality affect susceptibility to framing effects?
The research question will frame the subsequent steps in the design and execution of a quantitative social science study, which are described in the accordion below. Click on the tabs below to explore the different phases in a typical quantitative social science research process:
Good RDM practices are relevant to all phases in a typical quantitative social science research project, from planning to publishing research results. Data Management Plans (DMPs)are important tools to help researchers consider how to handle their research data in different phases of the research process. In the rest of this chapter, we’ll share some RDM considerations that are especially relevant when working with quantitative social science data.
Managing Quantitative Social Science Research Data: Files, Formats, and Documentation
Quantitative social science data is not inherently different from other types of quantitative data except in terms of the source(s) and focus of the data. Quantitative data are numerical data that are measured on an interval or a ratio scale, or categorical variables that are dummy-coded or converted to an ordinal scale. The most common method of collecting original quantitative social science data is through survey instruments.
Good RDM practices for social science survey data require researchers to document the full process of conducting survey research. When it’s time to share or archive the survey data, you can then package the final dataset with the survey questions and the information about how the survey was conducted and on whom.
A survey instrument, or questionnaire, is a series of questions asked of research participants, designed to measure a concept or multiple concepts. A survey questionnaire may include items, or questions, that operationalize multiple concepts — that is, turn them from abstract concepts into quantitatively measurable variables and indicators.
In addition to survey data, many social scientists also rely on administrative data. Administrative data refer to data that are collected by organizations or by government agencies for administrative purposes (i.e., not for research purposes but to administer or assess services, products, or goods). Examples of administrative data include vital statistics (e.g., birth and mortality rates), human resources records, municipal or individual tax information, budgets, locations of public services, and recipients of social service programs. It is important to note that administrative data that are not publicly available are typically governed by licenses or contracts that may affect data sharing and/or deposit. This was discussed in more detail in chapter 13, “Sensitive Data.”
In your RDM practice, consider the licenses on datasets when planning how the dataset might be shared or deposited at the end of a project. For example, certain contracts or licenses may dictate whether the dataset you are using may be later shared during a peer review process for verification of findings or whether the dataset may later be deposited for reuse by other researchers. Recall what you learned about licenses and sharing data in chapter 12, “Planning for Open Science Workflows.”
In most cases, regardless of whether the data are derived from original surveys or administrative sources, quantitative social scientists mostly collect and store their data in a tabular format.
Considering preservation file formats or the sustainability of your digital files over time is a good RDM practice. The typical preservation file format for tabular data is a .csv or .tab, which are both open formats that are not dependent on proprietary software and can be opened across a variety of different programs (e.g., Stata, SAS, SPSS, Excel). Storing data in non-proprietaryformats or at least maintaining a backup of all data in one of these formats is a good RDM practice to ensure the sustainability and interoperability of your data for future use. (For more on formats please see chapter 9, “A Glimpse Into the Fascinating World of File Formats and Metadata.”) However, researchers often use Microsoft Excel to collect and store tabular data. Since Excel is so ubiquitous across research and industry landscapes, it is not typically problematic in terms of later reuse of data. The Data Curation Network’s primer on curating Microsoft Excel data is a useful resource.
Conventionally, tabular data are organized so that each row represents an observation (e.g., one research participant, one neighbourhood, one building, one year) and each column represents a variable (i.e., information that varies across observations). We’ll discuss alternative formats of tabular data (i.e., long vs. wide) in the following section.
There are several good practices related to the set-up of a tabular dataset. One best practice is to avoid spaces in variable, file, and/or observation names, as computers struggle to read blank spaces when tasks are automated. Another good practice in naming variables is to limit the length of the names of variables in datasets; using eight characters or less prevents statistical analysis software from cutting off variable names. Setting variable names this way will also improve the interoperability and reusability of the data in the future in other software.
In many cases, “cleaning” the data may be required before analyses can be performed or data can be shared or deposited, which you learned about in chapters 7 (“Data Cleaning During the Research Data Management Process”) and 8 (“Further Adventures in Data Cleaning”). When cleaning your data, you will also want to create documentation about it, including creating coded versions of variable and/or observation names and an accompanying codebookas a separate document. Spaces in file names or in table headers can cause certain software or applications to crash or can result in errors when trying to open or use a file. For example, in a command line environment, spaces are used as delimiters. To avoid blank spaces, use camel case (StartingEachWordWithACapitalLetter) or underscore (between_words) to create machine-readable codes.
Consider a case where a researcher has conducted a survey of undergraduate students to ask about the costs associated with course materials. This survey questionnaire included the following item: “This past semester, were you enrolled in any courses that involved costs associated with travelling locally around the greater Calgary area?” It would not be useful to label a column in a spreadsheet with this question verbatim. Thus, the researcher may create a coded version, or a shorthand name, such as “TravelCosts,” to substitute as a column header, or variable name, for the full question in the dataset. To keep track of these substitutions, or codes, the best practice is to create a survey codebook in the form of a separate text document that connects the shorthand codes to the full original questions from the questionnaire.
In addition to connecting codes with full variable names or questionnaire items, a codebook can also contain information about missing data and the labels or values of the range of responses to a particular question. For example, if the possible responses to the previous question were “yes,” “no,” and “I’m not sure,” the researcher may use numeric codes with value labels to analyze a quantitative version of the responses. The codebook could contain this information by noting that “yes” is coded as 3, “no” is coded as 2, and “I’m not sure” is coded as 1.
The following table provides an example of how this example survey codebook document might look:
Table 1: Example survey codebook.
Variable Code
Variable Label (Original Question)
Response Options
TravelCosts
This past semester, were you enrolled in any courses that involved costs associated with travelling locally around the greater Calgary area?
3= Yes
2 = No
1 = I’m not sure
TXTBKCosts
This past semester, were you enrolled in any courses that involved costs associated with purchasing a textbook?
3= Yes
2 = No
1 = I’m not sure
Concern
Have you ever expressed concern to a professor about your ability to afford the materials required for their course?
3= Yes
2 = No
1 = I’m not sure
If there are multiple variables that have the same response options, such as “TravelCosts” and “TXTBKCosts” in the example above, it is wise to maintain consistent value labels for the response options across the variables to avoid confusion during the analysis phase of the project.
It is also common that research labs or teams conduct multiple research projects on similar topics using similar measures simultaneously. For instance, two similar studies are being conducted at the same time on the impact of workplace violence on employees’ post-traumatic stress disorder (PTSD) symptoms. One study might be about how workplace bullying is causing employees’ PTSD symptoms and the other might be focusing on how client-initiated physical violence is causing employees’ PTSD symptoms. In this case, PTSD symptoms are measured in both studies. To improve interoperability within the research team, it is important to keep consistent naming and coding conventions on the measure of PTSD in both studies. The codebook, as part of the documentation of the dataset that would also ideally include a README file and/or metadata, would be essential when a researcher aims to share or deposit their dataset with other researchers or the public. It would be impossible to use the dataset without knowing the definitions of each variable (for further examples, see the Inter-university Consortium for Political and Social Research’s (ICPSR) “What is a Codebook” resource, which has a concise description and more examples of typical codebook structures).
Naming variables and files and defining quantitative versions of abstract social or behavioural constructs is complex. A key aspect of RDM in quantitative disciplines, including social science, involves determining file naming conventions and file storage hierarchies using a DMP. A DMP is an important project management tool for documenting a file naming convention, especially when working with quantitative data that may incorporate multiple versions of a dataset stored in tabular format with script/code files that may be required for cleaning or analyzing the dataset(s).
The conventions for naming files in the quantitative social sciences do not necessarily differ from other disciplines. It is necessary to incorporate enough specific information to uniquely identify a file and to understand the difference between different versions of the same dataset. For example, it can be important to include “raw” in the name of a file containing data collected prior to cleaning or analysis. Making a copy of the raw file as a working file and maintaining it as the authentic version of the data prior to any intervention is a good practice. The working copy of the data file should have a name that clearly indicates it is not the raw file and also distinguishes it from other potential versions of the dataset (e.g., a version of the dataset that has been cleaned or a version of the cleaned dataset that includes variables calculated from the raw data). Over the course of a project, many files may be created for the same dataset. A DMP can be used to plan for the types of files that may be created and name them in ways that uniquely identify each file. The ICPSR, arguably the most well-known social science repository, based out of the University of Michigan in the United States, has a sample DMP for social science that incorporates advice relevant to the type of data that quantitative social scientists collect and manage.
There are additional considerations for managing quantitative social science related to projects that incorporate a longitudinal design. In a longitudinal design, which is a common method in the social sciences, researchers often collect data or aim to compare data from the same participants over multiple years. This presents challenges in matching the data for a given participant from a given year to the same participant from other years and maintaining data integrity over time and across iterations of various datasets. To complicate this issue, not all participants will remain in a study over time — there will be some degree of drop-off over time and thus the number of participants across years may be inconsistent.
RDM includes practices related to instituting a workflow or process to track how files are merged and the changes between versions of a dataset. RDM also relates to decisions about which version of the file will be shared or deposited in the long term. Should researchers deposit each wave (i.e., each dataset for a specific time period) as a separate dataset with instructions on how to merge the files? Or should researchers share the single merged dataset that incorporates many years? There is no right or wrong answer to these questions. RDM ensures that a decision is made one way or the other, ideally based on which version of the dataset is required to replicate published findings or according to more general disciplinary norms, and documentation is gathered and made available depending on the option chosen by the researcher(s).
RDM Issues Regarding Digital Tools and Software for Quantitative Social Science Data Collection
Survey research is a commonly used and cost-effective method in both qualitative and quantitative research in social sciences. Most survey designs are non-experimental in nature. They are used to describe and estimate the prevalence of a phenomenon and/or to identify specific relationships among various factors.
Information collected using online surveys in social sciences could be sensitive in nature, containing personal information (e.g., age, gender and ethnicity, email address, IP address) and/or personal health information (e.g., self-reported former diagnosis of medical conditions). As stated in the Tri-Council policy statement on the ethical conduct for research involving humans (TCPS 2), it is every researcher’s ethical duty to protect and safeguard their research data and their participants’ information from unwanted and unlawful access. As such, determining the level of sensitivity of research data and the consequential options for active data storage, collection, and analysis, is another key aspect of RDM when working with human participants. For more information see chapter 13, “Sensitive Data.”
However, most of us are not cybersecurity experts. It is extremely difficult to check whether a vendor complies with applicable laws and regulations, whether the vendor has external certified security controls, or whether data are encrypted in transit and at rest. Using institutionally licensed and/or vetted survey solutions for research whenever possible might save researchers from a lot of headaches related to compliance concerns regarding institutional or governmental cybersecurity policies. When preparing a DMP for a quantitative social science project, you have the opportunity to describe the methods for data collection and the tools or software that may be used in that process. This an important aspect of the planning stage and reiterates the utility of DMPs in the context of quantitative social science research.
For example, if you were to procure an external third-party online survey tool (most likely cloud-based), it is important to thoroughly investigate where the server and subcontractors’ servers are physically located. Although some of the cloud-based survey tools might be reputable and secure, their subcontractors’ practices or physical locations (e.g., server located outside of Canada) could still put your research data at risk due to non-compliance with applicable Canadian privacy laws and regulations. If the server hosting the online survey platform is located in the United States, the data stored there are subject to the U.S. Patriot Act. Moreover, some specific funding agreements might prevent research data from being stored outside of Canada. These are considerations that can be reviewed and resolved in advance by using a DMP.
Curating Quantitative Social Science Data for Reproducibility
The final phase in a typical quantitative social science research study involves decisions related to depositing (i.e., publishing) and/or archiving any data that underlie publications stemming from the study. Although disciplinary norms related to openly sharing research data vary across social science disciplines and fields, it is becoming increasingly ubiquitous. In addition, funders such as Canada’s three federal research funding agencies (the agencies) and journals across social science disciplines are increasingly requiring that research data be made available or be deposited in a public repository. However, one driving force behind the push for publishing research data, including any related documentation and/or metadata, is the reproducibility crisis (Turkyilmaz-van der Velden et al., 2020).
The reproducibility crisis refers to the inability of researchers to replicate, or reproduce, the findings of published research. Replication is a key method for verifying the soundness or integrity of research findings. In most cases, the reason that a study cannot be verified through replication is because there is a problem with the original data, the data are not available, or the steps taken in the analysis phase of the study on how to achieve the results using the data were not described well enough (Baker, 2016). Quantitative social science has not been immune to the reproducibility crisis and several high-profile retractions, due to problems or fraud with the underlying data of a publication, have coalesced support for higher levels of transparency in the form of making data available (Figueiredo et al., 2019). For example, in 2015, a seemingly landmark study by two political scientists on political persuasion was published in Science. However, over the course of the following five months, two graduate students who had requested the data for replication purposes discovered evidence of intentional fraud and the publication was subsequently retracted (Konnikova, 2015). There are two popular websites, Retraction Watch and PubPeer, that currently crowdsource the tracking of retractions or concerns related to the data underlying published scholarly research. In this way, the scholarly community is holding itself accountable to produce research that can be replicated.
For quantitative social science researchers, there are several curated public data repositories where data can be published, in addition to ICPSR. They correspond to disciplinary norms related to research transparency and reproducibility and to funder and journal mandates requiring research data to be made Findable, Accessible, Interoperable, and Reusable (FAIR). A sub-collection of the Borealis Dataverse open source software installation is available at most Canadian institutions as an institutional data repository, as part of a broader network of consortium-provided research data management infrastructure resources (e.g., the Borealis implementation supported by the Digital Research Alliance of Canada). Researchers affiliated with these institutions may deposit their datasets with their institutional Dataverse sub-collection. Although open to all disciplines, the Dataverse repository platform was initially developed for quantitative social science data, which means it is well-suited to archive the kind of small tabular files and related script files that are typically produced by quantitative social science researchers.
Depositing data in a public repository is a step towards making research data available, but it is not enough to ensure a study is reproducible or that data are FAIR. Additional curatorial steps should be taken, typically by a librarian or other information professional mediating the deposit for a repository, to convert proprietary file formats, such as SPSS or STATA files, to open formats, such as R or csv. In addition, documentation is required in order to reuse a quantitative dataset or replicate any related findings. Documentation of a quantitative social science dataset may include a description of the study for potential future users, codebook, metadata about the data collection (e.g., any weighting scheme that was used for survey data, the time periods of data collection, any software that was used to collect or analyze the data, etc.), scripts or code required to clean the data or reproduce components of a related publication, and the reuse license or terms of use for the data. Curators should ensure that quantitative social science data and any data collection tools (e.g., a survey instrument) are properly licensed. In the case of quantitative social science, the data collection tools can be as valuable or more valuable than the research data outputs of a project. Researchers who use administrative data (e.g., open municipal data, Statistics Canada data, etc.) should ensure that any open government licenses applied allow for deposit of derivative datasets and whether there are any requirements regarding attribution for the original source of the data.
The most commonly applied metadata schema for social science data is the Data Documentation Initiative (DDI), which includes fields such as sample size, geographic coverage, unit of analysis (e.g., household, individual, etc.), and many more fields relevant to the social sciences. In general, data repositories built for hosting social science datasets will incorporate DDI fields in the data deposit interface and will subsequently produce the machine-readable (e.g., XML) metadata file as an automatic part of the upload process.
Good RDM practices for social science data include maintaining accurate and detailed information about the study, the measures used for data collection, any shorthand or codes used in data cleaningor preparation, the script or code for data analysis, and specific metadata (e.g., sample size, survey weighting, dummy codes, etc.). Providing complete and accurate information about the project in the relevant fields of the data repository interface will not only increase the discoverability and impact of the project but will also improve the reusability of the data for secondary use by other researchers.
Conclusion
Overall, the management of quantitative social science research data involves similar processes, workflows, and considerations to RDM practices regarding other discipline-specific types of data. The distinctive topics related to the lifecycle of managing quantitative social science data involve the particular types of software tools that are used to collect data (e.g., the use of cloud-based digital survey platforms) and the subsequent generation of multiple tabular files in the process of collecting, cleaning, and analyzing the data. The key practical aspects of data management related to quantitative social science typically involve: tracking versions of tabular datasets through the implementation of consistent file naming conventions; naming files and variables with machine-readable text or abbreviations; using a data collection tool that is secure and allows for customizable formatting of survey instruments; and maintaining comprehensive documentation (e.g., a codebook and metadata) to ensure data are as FAIR as possible.
Reflective Questions
Why is it important to create a DMP for quantitative social science survey data?
How does the choice of research design and data collection method relate to RDM aspects of a quantitative social science research project?
Key Takeaways
Descriptive designs aim to explore a phenomenon or observation in order to describe an effect, and exploratory designs aim to explain a phenomenon or observation in order to understand an effect. A DMP can be helpful to establish file naming conventions, folder hierarchies, preparation of relevant metadata and documentation, and a plan for eventual data deposit before you start your quantitative social science research project.
Most commonly used survey platforms in the social sciences are cloud-based software products. When using cloud-based platforms, consider implications for cybersecurity and participant privacy. During the data collection phase, think about how the spreadsheets should be versioned and named for reuse.
The reproducibility crisis refers to the inability of researchers to replicate, or reproduce, the findings of published research. In most cases, the reason that a study cannot be verified through replication is because there is a problem with the original data, the data are not available, or the steps taken in the analysis phase of the study on how to achieve the results using the data were not described well enough. This has direct implications for making the data underlying quantitative social science publications available, typically via a public data repository.
Additional Readings and Resources
From Digital Research Alliance of Canada (the Alliance)
de Vaus, D. (2001). Research design in social research. Sage Publications.
Figueiredo, D., Lins, R., Domingos, A., Janz, N., & Silva, L. (2019). Seven reasons why: A user’s guide to transparency and reproducibility. Brazilian Political Science Review, 13(2). https://doi.org/10.1590/1981-3821201900020001
Dr. Alisa Beth Rod is the Research Data Management Specialist at the McGill University Library. Alisa holds an MA and PhD in Political Science from the University of California, Santa Barbara and a BA in Bioethics from the American Jewish University. Prior to joining McGill, Alisa was the Survey Methodologist at Ithaka S+R and then the Associate Director of the Empirical Reasoning Center at Barnard College of Columbia University. She has an extensive background collecting and working with human participant data in the context of survey research, qualitative methods, and GIS.
Dr. Biru Zhou
Dr. Biru Zhou is the Senior Advisor (Research Data Management) in the Office of Vice-Principal (Research and Innovation) at McGill University. Biru holds an MA and PhD in Psychology from Concordia University. Upon completion of her postdoctoral training from the School of Public Health at the University of Montreal, she joined McGill University in 2016. She has extensive experience in designing and conducting cross-cultural studies involving sensitive human data collected via online surveys and in-lab experiments.
Geospatial Research Data in Canada: An Overview of Regional Projects
16
Martin Chandler; Kara Handren; Stéfano Biondo; Amber Leahey; Sarah Rutley; and Rhys Stevens
Learning Outcomes
By the end of this chapter you should be able to:
Understand the current state of geospatial research data infrastructure and services across different regions of Canada.
Explain some unique considerations for managing geospatial data.
Provide examples and exemplars of geospatial data management.
Recognize the future of geospatial Research Data Management in Canada.
Introduction
Libraries in Canada support a variety of services for the discovery, access, and preservation of geospatial research data. Infrastructure and services have been developed regionally, primarily at academic institutions, to support the management of geospatial data collections and resources. This has created a patchwork of research data services across the country. This chapter will provide an overview of the approaches and key infrastructure projects for the management of geospatial research data in Canada.
Spatial/geospatial (hereafter referred to as “geospatial”) data have not always been recognized as requiring special consideration when it comes to Research Data Management (RDM). However, due to unique aspects of their creation, use, and access, geospatial data require particular consideration of their management separate from other areas of RDM.
Generally, responsibility for the curation of geospatial data has fallen to geospatial/data librarians or data managers with subject expertise, as these two groups are best equipped to meet the challenges that geospatial data provide. This chapter seeks to clarify the challenges particular to geospatial RDM; the various regional projects currently underway or in development to help meet challenges of preservation and access to geospatial research data; and the future directions for geospatial-centric RDM in Canada.
Geospatial Data and GIS
What is geospatial data? And how is geospatial research data distinguished from research data as a whole? Any data about objects or events that have a location are geospatial data. This includes instances where the location is static (in one defined location over a short term, such as a building or an earthquake) or dynamic (displaying change or movement over a short term, such as urban growth or the effects of drought on neighbouring water tables). Geospatial data combine location information with characteristics of an object, event, or concept (“attribute” data), and often (though not always) temporal information (Stock & Guesgen, 2016).
Geospatial data often rely on the use of a geographic information system (GIS), such as QGIS, ArcGIS, or Google Earth. This system allows numerous means and methods to develop, use, and export geospatial data, including creating and sharing datasets. Geospatial research data often combine or join spatial data points (or features) with other source data and variables to support data use. These variables often include data that are geographic in nature, such as census data at the census tract or postal code level.
Considerations for geospatial RDM heavily rely upon exporting data to various formats (format interoperability), previewing and reusing static maps, using or reusing statistical and geographic data, reusing interactive data applications, and using map-based features and components.
Due to the nature of geospatial RDM, its use in GIS, and how data is handled therein, some understanding of data management is often a prerequisite. Introductions to geospatial data use are available in Anita Graser’s “Learn QGIS” or Esri Press’s “Getting to know ArcGIS…” or “GIS Tutorial for…” series. While you can create data in a GIS, it is more often used to provide the tools for joining geospatial and other forms of data (e.g., tabular data with pre-existing geospatial data).
More general RDM topics, including file management, are dealt with in other chapters of this textbook. Furthermore, the creation of geospatial data and the management of geospatial research data are highlighted by the projects described below. This chapter will focus on various regional projects undertaken or currently under way across Canadian academic libraries to manage and preserve geospatial research data in Canada. Highlights include projects that emphasize making geospatial research data discoverable, publicly accessible, and reusable for a broad variety of audiences and users.
Management and reuse of geospatial research data requires reflecting on the physical space(s) from which the data were collected or to which they refer. There has been a move toward geospatial discovery that integrates base maps with text-based search. This can often include a geographic display and preview of datasets (see, for example, OCUL Scholars GeoPortal or Land Information Ontario’s Geohub). The data is then either displayed in a reduced format directly over the base map or reflected as a bounding box showing the geographic extent of the data available. It is especially important to note that geospatial research data management requires more robust infrastructure to support it, which is highlighted in some of the regional work described in this chapter. This infrastructure generally costs more, so the management of geospatial data for long-term storage and discovery tends to be a consortial, rather than an individual, project.
Forms of Geospatial Data
While many data forms can include geospatial elements (e.g., a variable for city, census division, address), geospatial data also include distinct formats in the form of raster and vector data. Raster data consist of a matrix of cells organized into rows and columns, with each cell containing information and often represented visually. For example, a scanned map or drawing is raster data, as is satellite imagery (Esri, 2016).
Figure 1.Raster data of a scanned map: Bellin, 1764.
Vector data is a representation of real-world features or phenomena in a GIS, with underlying data to allow for connections between the feature(s) and other forms of data. Vector data can be divided into point, line, and polygon data. Point data are single vertices or locations in space (e.g., the location of a tree); line data, or polyline data, are two or more vertices where the first and last are not equal, showing a line or series of lines (e.g., a road); and polygon data are three or more vertices where the last vertex is equal to the first, forming a closed shape (e.g., the boundary of a property, area, or province) (QGIS, n.d.).
Figure 2.Polygon data: Statistics Canada, 2019 and OpenStreetMap contributors, 2023.
Tabular geospatial data commonly exist in a table or comma-separated values (CSV) format. This can be as simple as an address or geographic place name (e.g., “Unama’ki”), or as fulsome as a set of points, extent, spatial identifier, and hierarchy of geographic names and identifiers.
Geospatial Data as Interaction
Because geospatial data require a reflection of space, they are rarely created as single, discrete datasets. They instead rely on interactions with other spatial datasets, including underlying spatial data to locate them within a GIS and/or involving the development of further spatial data to initiate, further, or conclude the analysis of the data in question. RDM can require planning for abstract data interactions. But geospatial RDM requires careful consideration and planning for interactions between both abstract and physical data, the different modes and methods these interactions may involve, and how the interactions will be handled by the software used for analysis. Using GIS itself involves the careful planning of data management, as the software mounts data from its digital location rather than copying it into the software. As such, when saving a project in GIS, the locations of data are saved, and moving a dataset means the project itself may become unworkable, unless the user corrects the location of the dataset.
It should be noted that geospatial data creation is both an end in itself and a development for a further end that includes analysis, visualization, or pre-analysis project conception. Geospatial data can be created to serve as a research output itself or as an aid used to prepare, analyze, or visualize another data source. It is then both an end and an intermediary; in other words, it serves as the outcome of research (as any other dataset does), as a tool for analysis (like SPSS, NVivo, Voyant, etc.), and as a tool for data presentation (like Tableau, ggplot, etc). What’s more, while a numeric dataset can be presented as a single file for use, a geospatial dataset requires supporting geospatial data, map projections (i.e., the many and varied means of reflecting a three-dimensional globe in a two-dimensional display) and coordinate reference systems (i.e., the differing systems that dictate where and how a set of geospatial data should display on a map).
Data as Object vs Data as Process
Finally, due to the connected/interactive nature of geospatial data in research, geospatial RDM must be considered both in terms of data produced by research and data used in the process of research. For example, a researcher may require a portion of a census boundary file from Statistics Canada. Therefore, in their analysis, they may extract a portion of the boundary file. By doing so, that data becomes a research product, much as an extraction of census data would become research data. The extracted boundary file may only be a preliminary step prior to analysis and may itself be altered using different coordinate reference systems and/or projections (e.g., a Lambert Conformal projection changed to a Web Mercator projection). The line between data prepared for research use and data created as a result of research use is then more nebulous for geospatial data. As such, at least for the sake of this chapter, geospatial RDM will include managing some prepared datasets as well as data resulting from research. The rest of this chapter will highlight projects in various regions of Canada that serve any of three purposes:
Currently assisting in geospatial RDM
Will be assisting in geospatial research data management in the future
Outlining the difficulties of assisting in geospatial RDM
Regional Geospatial Projects
As previously noted, the needs of geospatial data management are such that solutions for access and preservation are best sought consortially rather than through individual institutions. The various ways that regional consortia are working on geospatial research data management solutions are highlighted below.
Atlantic Canada
As of 2023, there is no shared or consortial method of data storage and delivery in Atlantic Canada, despite Nova Scotia’s status as a forerunner in shared library systems (Marshall, 1999, p. 134). However, data librarians in academic institutions have discussed this topic and identified a need. Further to this, discussions have begun with other consortial systems, particularly Scholars GeoPortal in Ontario. There is some optimism for a national system, run either as a shared consortial system or through the Digital Research Alliance of Canada’s university library associates. These discussions remain preliminary and informal. However, it is worth recording that they are occurring (DLI-Atlantic, Personal Communications, Feb–Mar 2022).
As there are no provincial or regional shared systems, geospatial RDM implementation is entirely up to local institutions, in such instances where geospatial research data has been recognized. Each institution has taken its own approach to research data management, dictated primarily by institutional and librarian capacity for program development. So each institution has also taken its own approach to geospatial RDM. Often, especially in smaller institutions, this can mean handling questions on an as-needed basis (i.e., if a librarian is approached by a faculty member, they will seek a suitable outcome if and where feasible, often either as a Dataverse deposit or as a locally housed dataset). While such an ad hoc system is not ideal for the storage, use, and discovery of geospatial research data, it remains the best possibility under limited resources (DLI-Atlantic, Personal Communications, Feb–Mar 2022).
Many institutions have opted to use Borealis (formerly Scholar’s Portal Dataverse) instances for the institutional data repository to house any researcher-created data. (See Lunaris, n.d., for a listing of institutions’ data repositories and the platforms for hosting. Lunaris (formerly the discovery service for FRDR) is separate from Borealis but draws on those institutional repositories to offer a tool for accessing data and navigating local repositories.) Dataverse instances offer improved discovery; however, Dataverse lacks a robust geospatial display tool or discovery platform. This was partially mediated by the Geodisy tool (see ubc-library (2022) and other references in this chapter) but has been replaced by Lunaris. These systems do not display data or allow clipping to particular areas; they only allow a basic display of data coverage. There is a large gap for geospatial data searching and reuse and for geospatial research data storage and service.
Dalhousie University’s GIS Centre is the most developed system in the Atlantic region. A portal, built on Esri’s ArcGIS Hub, is being developed for access to all datasets held or licensed by the university. This allows for geospatial searching and preview methods, as well as preliminary clipping prior to download. However, because it houses licensed datasets, it is restricted solely to Dalhousie users and is not available to other institutional users. External seekers of data remain frustrated.
Québec
In Québec, each university library managed and disseminated geospatial data independently, in a somewhat automated manner, until 2019. In 2015, a historic agreement between the Bureau de coopération interuniversitaire (BCI) and the Ministère de l’Énergie et des Ressources naturelles (MERN) encouraged a new way of managing and disseminating geospatial data within the Québec university network.
Until 2015, all Québec universities had to purchase government data individually and could not share it amongst each other due to licensing agreements. Overnight, thanks to the BCI-MERN agreement, universities could use and share more than 250 layers representing 50 terabytes (TB). But how could this amount of data be managed and shared? Not all universities have an adequate platform to organize and disseminate this geospatial data for the benefit of teaching and research.
To encourage inter-university collaboration and the pooling of processes and resources, the library at l’Université Laval agreed to share its geospatial expertise and know-how by creating a shared platform managed by l’Université Laval and accessible to participating libraries. Their solution would integrate all the functionalities required to discover, visualize, and extract geospatial data and load it in a secure and efficient environment.
The result was Géoindex, a unique infrastructure accessible to 18 Québec universities via 18 entry points configured by each institution according to their preferences. Thanks to its powerful spatial and textual search engine, this platform makes it easy to discover, visualize, and extract geospatial data and aerial photographs to support teaching and research. Note that Géoindex is available in two modules: the Géospatial module and the Géophoto module, both described below.
The BCI-MERN agreement was used as leverage to develop Géoindex, but this new platform can host and disseminate other geospatial data from various sources managed under different licences. Therefore, Géoindex includes licensed data from the agreement, such as LIDAR data, which provides researchers with new interpretations of the territory. But it also includes data from research projects such as the L’Atlas de vulnérabilité), which illustrates, among other things, the heat wave sensitivity index and bathymetric data from the Arctic collected by the icebreaking researcher Amundsen. Each layer of information is described according to a metadata profile (UL Profile) that meets the criteria of the North American Profile (NAP) of the ISO 19115 standard. L’Université Laval’s subject headings directory (Répertoire de vedettes-matière [RVM]) is used to standardize the descriptions of the subjects used.
Figure 3.Example of geospatial research data: Mapping of ancient waterways in Montréal, carried out by a researcher at l’Université de Montréal.
The data are accessible to the entire university network, but some are also open and accessible to the general public, including more than 250 topographic maps dating from 1909 to 2000. Géoindex also allows us to showcase historical documents from library collections, such as topographic maps, and even older documents, such as this map of John Franklin’s first expedition to the Canadian North in 1819, which was digitized by the library at l’Université Laval and georeferenced in order to give it a second life.
Figure 4.Example of geospatial data that can be used to initiate a research project: Georeferenced historical map and vectorized route of the Coppermine Expedition led by Sir John Franklin between 1819 and 1822.
The Géophoto module, which is dedicated to the retrieval of aerial photographs that are integrated into Géoindex, supports teaching and research by facilitating the discovery of geographic information. In 2022, the module was enhanced. By switching to this module, users can now consult the entire inventory of aerial photographs held by Québec universities. This represents more than 1,200,000 aerial photographs dating from the 20th century. This primary information, or raw data, is very important for understanding the territory as it was at a specific time. A re-signed agreement between the BCI and MERN will also enable adding more than 1,000,000 aerial photographs digitized by MERN by 2026. As of February 2023, there were already 400,000 digitized copies available in the Géophoto module.
Figure 5.Géophoto module of the Géoindex platform, which provides a one-stop shop for consulting all the Québec universities’ aerial photograph collections.
Although the Géoindex platform can host and disseminate geospatial data from research projects, it was not specifically designed for this type of data. For example, deposited data do not receive a DOI and the metadata are not exposed on the open web and, thus, not harvestable by other search engines. However, in future updates, the plan is to make metadata found in Géoindex open and accessible to other search engines.
For the moment, the amount of geospatial data from research projects in Géoindex is not very significant. However, the discovery, visualization, and extraction capabilities will likely increase the amount of geospatial research data over the next few years, without replacing traditional research data repositories like Dataverse. Géoindex should be seen as complementary to traditional repositories with links between them for easy discovery and retrieval.
Ontario
Libraries in Ontario have a long history of collaborating on building discovery and management systems for shared collections, coordinated via the Ontario Council of University Libraries (OCUL). As noted in chapter 4, “Canadian Research Data Management: History and Landscape,” OCUL, established in 1967, is a consortium of all twenty-one university libraries in the province of Ontario. It is involved in collective purchasing, storage, and delivery of library resources and services. The infrastructure behind the shared systems is supported by Scholars Portal, OCUL’s digital infrastructure provider, which consists of librarians, systems administrators, and developers, who are staff at the University of Toronto Libraries. The province-wide consortia-driven infrastructure hosts a variety of shared collections. It has been involved in building, maintaining, and supporting a range of access platforms for data collection, delivery, and end-user support. These include publication collections, such as Scholars Portal Journals and Scholars Portal Books, as well as microdata and geospatial data-focused platforms, including the Scholars GeoPortal, ODESI, and Borealis. A variety of shared licensed collections, open digital collections, and archives collections are hosted and provided to academic researchers at participating member institutions.
The OCUL Geo Community (formerly the OCUL Map Group) was instrumental in the development of the Scholars GeoPortal in 2012. Scholars GeoPortal is a web-based data discovery tool that provides access to licensed and commercial data, national source data collections, regional government and open data, and raster imagery data, including government-derived projects and acquisitions and digital maps. The application is a custom build that uses a combination of Esri technology and other software already in use at Scholars Portal. It leverages the ArcGIS Server as its back-end database and server, and it uses the API tools provided by Esri for visualization and download of data stored in those servers via the custom front-end GIS. This GIS also serves as a shared catalogue and data discovery tool and is supported by a robust metadata editor producing ISO 19115 compliant metadata that are stored in a MarkLogic XML database. Currently, a redevelopment project is underway to further upgrade the GeoPortal to secure the future of the platform and ensure that it continues to meet the needs of the community. Integrations with Borealis (which is discussed in a national and regional context in chapter 4) are being explored as part of the redevelopment work.
OCUL libraries have been facilitating access to geospatial data that is available via the development of shared infrastructure and product licensing. They have also been actively involved in special projects and initiatives both within Ontario and in the larger Canadian context. The historical topographic maps project has led to the scanning of over 1,000 topographic maps at the 1:25,000 and 1:63,360 scales, covering the years 1906–1977. Work is now underway on a larger project to reuse these workflows on the 1:50,000 National Topographic System (NTS) map collection and to ingest these maps into both the GeoPortal and Borealis, to provide for greater integration of the collection with Canada’s national research data infrastructure (e.g., Lunaris). To date, over 6000 maps from the 1:50,000 collection have been made available in this way.
Figure 6.An NTS map of Hamilton, Ontario (Sheet 030M05), as displayed in the GeoPortal.
The Ontario Library Research Cloud (OLRC) is a collaboration of Ontario’s university libraries to build a high capacity, geographically distributed cloud storage network using open source technologies. The OLRC is designed to house large volumes of digital content to allow for cost-effective and sustainable long-term preservation and to support data and text mining research tools. This resource is currently being leveraged by several OCUL institutions for preservation of their geospatial data to ensure long-term access. Permafrost builds on the OLRC, supporting workflows for the creation of Archival Information Packages (AIPs) using a consortially managed and supported instance of Archivematica. Archivematica is a suite of open source tools developed by Artefactual to assist in ingest and preservation of digital objects. In some cases, Permafrost is connected to repositories. McMaster University Library’s Islandora instance, which includes over 12,000 maps, plans, and aerial photos from the Lloyd Reeds Map Collection, is one example of the value of this infrastructure. Data are backed up automatically and regularly in the OLRC and stored as AIPs in their digital archive.
As the size of data continues to increase, Scholars Portal identified a need to provide new technical solutions to support transfer of large datasets within academic library data services. This search for digital solutions became even more urgent during the COVID-19 pandemic, as restrictions on contact meant that existing workflows were no longer possible in a remote environment. Scholars Portal developed a solution using Globus, a data transfer tool that supports workflows for large file transfer and direct storage to research environments. OCUL is currently exploring a deeper integration as part of the Scholars GeoPortal redevelopment.
Standardized metadata are equally vital to facilitate access via search and discovery of geospatial data. During the development of the GeoPortal, OCUL did transformative work by recommending and adopting the ISO 19115 standard and Canadian-controlled vocabularies from federal and provincial government agencies. These standards for the creation of dataset and series-level metadata have resulted in enhanced discovery, search capabilities, and access to the collections. The expertise at Scholars Portal in providing instruction on geospatial metadata has also provided a stronger understanding of the importance of geospatial metadata standards across the OCUL community. These standards have been applied to local collections and special projects alike.
Prairies
The Council of Prairie and Pacific University Libraries (COPPUL) is an association of university libraries in Western Canada that includes twelve members from the Prairie provinces of Alberta, Saskatchewan, and Manitoba, which are listed in Table 1. The capacity of staff at libraries to meet the demand for these specialized services varies considerably. Several libraries do not offer any geospatial or GIS services, while those at larger academic institutions (e.g., Calgary, Alberta, Manitoba) offer a more extensive suite of geospatial data services. These libraries serve student and faculty populations of disparate sizes and support different academic programs that have differing RDM requirements. As such, there is a great variation in the type of services these libraries offer. Specifically, these services relate to (1) providing access to geospatial data produced by external agencies; (2) creating geospatial and GIS-related products relevant to the production of new research; and (3) managing geospatial data produced by local researchers as a result of research activity.
Table 1.Geospatial research data management activities at COPPUL member libraries in the prairie provinces.
University
Province
Geospatial/ GIS Data LibGuide
Geospatial/ GIS Data Catalogue
RDM Dataverse Repository
RDM Geospatial Dataset Availability
Athabasca
AB
❌
❌
❌
❌
Concordia
AB
❌
❌
❌
❌
MacEwan
AB
✅
✅
✅
❌
Mount Royal
AB
✅
❌
✅
❌
Alberta
AB
✅
❌
✅
✅
Calgary
AB
✅
✅
✅
✅
Lethbridge
AB
✅
❌
❌
❌
Regina
SK
✅
❌
✅
✅
Saskatchewan
SK
✅
❌
❌
✅
Brandon
MB
❌
❌
✅
❌
Manitoba
MB
✅
✅
✅
✅
Winnipeg
MB
✅
❌
✅
❌
COPPUL Prairie libraries have been actively involved in creating geospatial and GIS-related products to help patrons find and use geospatial datasets from within their collections. The types of geospatial materials most frequently included in these products are historical maps, topographical maps, aerial imagery, digital elevation models (DEMs), and climate and environmental records. Examples of specific initiatives include:
Spatial & Numeric Data Services (SANDS) at the University of Calgary Library, which has been involved in the development of numerous mapping applications that provide access to rare historical maps (e.g., sectional maps of the Canadian Prairies, township plans of Alberta, fire insurance plans of Calgary). Original maps were scanned and georeferenced in order to visualize their geographic locations on an Esri web map for downloading.
Phase Six of COPPUL’s Shared Print Archive Network (SPAN), which was tasked with identifying historical western Canadian topographic maps (1:25,000 and 1:63,360 NTS series) for preservation and research. Identification of these maps opens possibilities for future digitization and visualization similar to topographic maps available from SANDS and the Ontario Scholars GeoPortal.
The Southern Alberta Aerial Photographs collection, which displays the geographic locations of vertical aerial photos available for download using a Leaflet web map and CONTENTdm digital library software. The University of Saskatchewan Library Archives and Special Collections created a similar web map identifying the locations of oblique photos from the Howdy McPhail Aerial Photograph collection.
Figure 7.Mapping Applications, spatial and numeric data services, University of Calgary Libraries and Cultural Resources.
COPPUL Prairie libraries are involved, to different extents, in managing and curating data (including geospatial data) produced by local researchers for their respective universities. Eight of twelve COPPUL member libraries are currently utilizing Dataverse repositories to host and share datasets on behalf of members of their scholarly communities (see Table 1). Seven of these libraries are participants in the externally hosted Borealis service, while the University of Manitoba manages its own implementation of Dataverse. The overall number of datasets deposited and available from Prairie Dataverse repositories (1,099 in total as of March 2022) is relatively modest but growing.
Prairie universities are also publishing their datasets to discipline-specific data repositories (e.g., Dryad for biosciences) or to Canada’s FRDR, which was created in partnership with the University of Saskatchewan and several other Canadian universities. FRDR can be searched through Lunaris, which provides a notable feature that allows users to use a “map search” powered by Geodisy to explore and locate datasets originating from specific Canadian geographic regions using a web map.
In May 2022, the University of Manitoba Libraries released its GISHub geospatial data repository. Initially, the project was conceived to be a secure local storage solution for geospatial data, but it was later re-imagined by incorporating tools available under an Esri site license. It aims to provide a discovery and access point for both proprietary and open researcher data and a secure local environment for active-use geospatial datasets.
For institutions without a Dataverse instance, locally created geospatial research data may be shared in FRDR or other venues. For example, although not a data repository, the University of Saskatchewan’s institutional repository, HARVEST, hosts a small number of geospatial research datasets. It is reasonable to expect that as COPPUL libraries implement their RDM strategies to meet requirements in the Tri-Agency Research Data Management Policy, we will see greater consistency in how, when, and where geospatial research data are shared.
British Columbia
The geospatial research data ecosystem in British Columbia is defined by the services that the province’s academic institutions and public organizations provide. British Columbia’s policies for openly sharing data have enabled users to search and access a wide variety of open data using the BC Data Catalogue and several other specialized platforms for acquiring other province-wide geospatial data, such as LidarBC and BC Land Title and Survey’s ParcelMap BC. At a more granular level, several of British Columbia’s regional districts and municipalities have made data available through localized data discovery platforms, such as the City of Surrey Open Data catalogue and the Metro Vancouver Open Data Portal.
Within British Columbia’s academic sphere, postsecondary institutions use independent geospatial data collection policies based on local administrative, teaching, and research requirements. There are four institutions where libraries are the main owners of geospatial data collections that belong to the Abacus Data Network: Simon Fraser University, the University of British Columbia (UBC), the University of Northern British Columbia, and the University of Victoria. The infrastructure for supporting Abacus is maintained by UBC Library. Universities belonging to Abacus are assigned specific subsets of the network, where users from their own institutions are authenticated to use data only licensed for use by their campuses. This offers a solution for localized collection development and data curation.
Approximately 20% to 30% of the data stored in Abacus is geospatial data. However, the underlying software supporting Abacus — Dataverse — is not designed to provide specialized support for finding and using geospatial data. Recognizing this, UBC Library created middleware software to connect Dataverse to a geo-specific stack of open source software, including GeoServer and GeoBlacklight. This project, called Geodisy (Phase 1), was funded by CANARIE between October 2018 and March 2020. At that time, a second phase of the project began under the funding of the National Digital Research Infrastructure Organization (NDRIO, now the Digital Research Alliance of Canada, or “the Alliance”) and administered by Canada’s Lunaris discovery service. The service is now used to power Lunaris’s Geodisy map search.
Future Directions
Currently, geospatial research data management depends on regional solutions, developed on an as-needed basis, with librarians working to anticipate future needs. Restrictions on time and workload keep the field moving reactively to RDM as a whole. There remain particular demands in the geospatial realm that require creative solutions for how these data are managed for current and future use. Many of the problems have moved or are moving towards shared and consortial solutions, and they will likely continue moving in that direction in the future, perhaps culminating in a national geospatial research data repository. This will require more concerted discussions of geospatial metadata and more work on geospatial access platforms — solutions that will likely be developed through the regional methods.
While current challenges and proposed solutions have been discussed, it is also worth noting some of the current gaps in content caused by data biases. The Indigenous Mapping Workshop, presented by the Firelight Group, has promoted growth in GIS and geospatial data among Indigenous nations, but ongoing work on settler-Indigenous relations in academia continues to grow slowly in this area. Similarly, geospatial data suffers the same systemic biases toward Black and other non-white people in data creation and use as in the data world overall, and work in these areas is slow. Linguistically, Québec has shown leadership in multilingual data access by engaging in bilingual metadata translation. However, other provinces are lagging in non-English metadata creation and dissemination. Finally, while the Canadian landscape has long favoured the south, and while attempts were made to bring in Northern Canadian geospatial RDM expertise, this area remains underexplored.
It may seem trite to describe the field of geospatial research data as simultaneously nascent and developed. However, a concerted effort is being made to expand on the work already done and to bring geospatial RDM in line with the needs of researchers and libraries across the country. Work is ongoing, particularly through the Digital Research Alliance of Canada (known colloquially as “The Alliance”) and the academic consortia outlined above.
Reflective Questions
How are geospatial data unique, and how does this impact considerations for geospatial Research Data Management?
Is geospatial Research Data Management better handled by local institutions, by regional consortia, or through national infrastructure investment? What are the benefits and drawbacks of each method?
Research Data Management requires infrastructure to support it. What infrastructure currently exists? What gaps do you think need to be addressed in order to improve the preservation, access, and use of geospatial research data?
Key Takeaways
Geospatial data involve a complex interplay of datasets but require primarily thinking about data as they involve space.
Individual geospatial data management is closely related to research data management, and resources already exist to learn more in this area.
There are regional projects across the country trying to manage the preservation and access to geospatial research data within the larger geospatial data field.
Postsecondary institutions are leading these regional projects on an as-available basis.
A white paper was written for NDRIO (now part of The Alliance) regarding Canada’s current and future needs for geospatial data infrastructure. This paper gives some idea of the needs and particularities regarding geospatial data:
Stock, K., & Guesgen, H. (2016). Chapter 10 – Geospatial reasoning with open data. In R. Layton & P. A. Watters (Eds.), Automating open source intelligence (pp. 171–204). Syngress. https://doi.org/10.1016/B978-0-12-802916-9.00010-5
Martin Chandler is the Liaison and Data Services Librarian at Cape Breton University. He supports data and geospatial discovery and use, as well as creative intersections in the arts and social sciences.
Kara Handren
Kara Handren is a Data Librarian at the Map & Data Library, University of Toronto. She supports data discovery and analysis in a variety of areas including Text & Data Mining and Geographic Information Systems.
Stéfano Biondo
Titulaire d’un baccalauréat en géographie de l’UQAM et d’une maîtrise en sciences de l’information de l’UdeM, Stéfano Biondo a développé une expertise en gestion et en diffusion des données géospatiales au sein des bibliothèques universitaires. À l’origine de la création du Centre GéoStat de la Bibliothèque de l’Université Laval, où il occupe la fonction de cartothécaire depuis 2005, il participe à l’acquisition, à la conservation et à la mise en valeur des collections cartographiques et géospatiales.
Amber Leahey
Amber Leahey is a Data & GIS Librarian and the Service Director for Borealis, the Canadian Dataverse Repository, a secure, bilingual, national data repository provided in partnership with academic libraries and research institutions across Canada. In her role she supports libraries, institutions, and researchers with data management, sharing, preservation, and reuse, through ongoing development of data and research services at Scholars Portal and the University of Toronto Libraries. She holds a Master of Library and Information Studies from the University of Toronto.
Sarah Rutley
Sarah Rutley is the Data & GIS Librarian at the University of Saskatchewan. Her research focuses on data management, discovery, and accessibility.
Rhys Stevens
Rhys Stevens is an academic librarian (Librarian III) at the University of Lethbridge Library in Lethbridge, Alberta. He is the Librarian & Information Specialist for the Alberta Gambling Research Institute and also a subject liaison librarian for Geography, Archaeology, Maps & Government Documents, Anthropology, and Spatial/Numeric Data.
Perspectives on Research Data Management
V
Research Data Management and the Open Science Movement: Positions and Challenges
17
Cynthia Lisée and Édith Robert
Learning Outcomes
By the end of this chapter you should be able to:
Understand the schools of thought influencing open science practices.
Categorize the main areas of activity of open science.
Characterize the presence of research data management practices in open science.
Challenge the predominant discourse concerning open science.
Pre-assessment
In your opinion, what place does RDM have in open science practices?
Introduction
The international movement in favour of open science is very familiar with the interest our policymakers are taking in research data management (RDM) practices. The open science movement is helping to develop new research practices, as the excitement around research data encourages researchers to maximize their research impact through sharing results and data. However, we’d like to clarify RDM’s place in the open science movement and consider a few issues along the way. To do this, we’ll first summarize the various schools of thought that shape open science, highlight the key points and principles for developing open science practices, and note connections with RDM. Second, we will present some of the benefits attributed to open science by these schools of thought, considering them in the context of RDM. Lastly, we will question the predominant and resolutely optimistic discourse surrounding the benefits of open science. To do so, we will take a step back to reflect on the following two issues: 1) what past experiences in the open access movement have taught us; and 2) what qualitative research reveals about the relevance of this positive discourse to the sharing of research data. We will conclude this chapter by inviting RDM practitioners to consider how the elements discussed in this chapter inform current professional practices and how these elements can offer new perspectives for re-examining these practices.
Positioning RDM in Open Science
Following a conceptual analysis of a compilation of 75 rigorously selected studies, Vicente-Saez and Martinez-Fuentes (2018, p. 434) offer the following definition for open science: “Open Science is transparent and accessible knowledge that is shared and developed through collaborative networks.”
Transparency refers to sharing research results in a way that promotes their reuse. It covers all phases of the scientific research process. It implies that knowledge creation should be carried out in a way that enables it to be verified, reproduced, and reviewed by fellow researchers.
Accessible knowledge outputs are ones that are rapidly disseminated to all audiences and free of charge, usually on the Internet . These outputs can include articles, scientific opinions, data, conference communications, manuals, and software code. Accessibility also means that these knowledge outputs are easy to find.
Sharing should be considered from a transparency and access perspective: sharing should include both the intermediate stages of scientific research and the final published outputs. While sharing supports both access and transparency, access refers to the technical aspects of sharing, such as who will have access to the content, according to which security model, and whether access may be through through on-site consultation or file transfer. Transparency, on the other hand, relates to making content available to the appropriate audience for the purposes of accountability, research validation (e.g., publication of the research protocol), and knowledge sharing (e.g., pre-publication, or publishing an evaluation report).
Finally, the collaborative aspect of open science mainly involves using technologies to facilitate collaboration between scientists, but it also encompasses enabling open dialogue between nations, disciplines, and roles.
Having established these clarifications, we have adopted the above definition of open science – which is similar to other definitions shared in this textbook – as a common basis for understanding how RDM fits into open science.
Open Science Schools of Thought
The term “open science” covers a wide spectrum of practices influenced by varying perspectives. Fecher and Friesike (2014) proposed several different schools of thought to help understand the perspectives of various groups: the research community, policy makers, funding agencies, publishers, and the public. Although their literature review dates back to 2014, their analysis is still topical considering how frequently it is still cited. They summarize the developments of open science in five schools of thought.
The Public School
The public school argues that science should be accessible to citizens and that those responsible for research should communicate, and even collaborate, with the public. There are two levels of citizen interaction: making the final product comprehensible so that everyone can understand it and making the research process accessible by including the citizen.
The Democratic School
The democratic school argues that research products, such as articles, books, research data, and software code, should be freely available to everyone.
The Pragmatic School
The pragmatic school wants science to be more efficient and focuses on the development of collaborative work among scientists.
The Infrastructure School
The infrastructure school focuses its efforts on developing better, non-proprietary (where feasible) technologies and improving their interoperability to better support research. The idea is that these technologies will allow science to progress in a different way.
The Measurement School
Finally, the measurement school seeks to assess the impact of research using alternative standards that move away from more problematic bibliometric indicators (Gingras, 2014) and that take into account the digital context in which research is now conducted and published.
Table 1. Example of RDM practices according to schools of thought.
Schools of Thought
Examples of RDM Activities
Public School
Planning data collection by citizens. See citizen science projects on the Zooniverse platform.
Documenting the context in which data was produced so that data can be reused and understood by users from a wider range of backgrounds than the original researchers.
Publishing open databy various levels of government, and by extension, completely opening certain research data to enable businesses and citizens to innovate or to become better informed.
Depositing research data in accordance with FAIR principles, which is encouraged by the Tri-Agency Research Data Management Policy . Component “A” (accessible) includes a spectrum of openness: from the most open (open data) to restricted and protected access (memorandums of understanding).
Integrating data availability statements into scientific articles. For specific examples, consult the Taylor & Francis templates.
Pragmatic School
Verifying the possibility of reusing data before deciding to produce new data.
Acknowledging the contributions that qualify for authorship on a dataset and thanking contributors who do not qualify for intellectual property.
Depositing research data or publishing metadata to publicize their existence and encourage new collaborations.
Introducing dataset usage statistics in platforms.
Citing datasets.
Each school of thought offers its own theory about developments in science, leading to activities that support a number of distinct objectives. These combined activities lead to changed practices in the conduct and administration of research and form what is called the open science movement. The following section categorizes these different areas of activity.
Open Science Areas of Activity
The Foster Open Science portal is an online learning platform covering all topics related to open science. It is intended for people who want to integrate open science practices into their work processes. It is the result of the European project, Fostering the Practical Implementation of Open Science in Horizon 2020 and Beyond, which was funded by Horizon 2020 between 2017 and 2019. In its section, “What is Open Science? Introduction,” there is a representation of the open science facets designed by Gema Bueno de la Fuente (n.d.). Open science extends its principles of openness, transparency, sharing, and collaboration into the areas of activity covering the entire research process, from its conception to its dissemination. The table below summarizes significant open science developments of these facets; we’ve added the “Open Research Protocols” facet early in the design phase to better reflect recent developments. For each facet, we’ve proposed the school of thought that seems to guide that area of activity. We’ve also provided some RDM actions to illustrate that RDM is present in all of these aspects of open science.
Table 2. Ubiquitous open science practices in the research process.
Research Phases
PRACTICE
SCHOOL OF THOUGHT
SUMMARY
EXAMPLE OF RDM ACTION
Conception
Dissemination
Open Protocols
Pragmatic
Publication of the methodology in a registry, such as OSF Registries, before starting data collection.
Manage data manipulation more effectively within a team with the help of transparent methodologies.
Open Notebooks
Pragmatic
Management of all data files to ensure the reproducibility of a research process.
Ensure the management of secure access to data in the active phase.
Open Data
Democratic
Sharing data in accordance with FAIR principles.
Choose a FAIR repository.
Open Peer Review
Pragmatic
Completely or partially waiving the anonymity of the people who do the evaluation and the writing.
Make the dataset available with appropriate documentation for reviewers.
Open Access
Democratic
Immediate, free access, without technical barriers, and allocation of user licenses.
Introduce a data availability statement in the publication.
Open Source Code
Infrastructure
Publicly funded research software and software used for research purposes should promote the technological autonomy of the scientific enterprise by using and producing open source code.
When sharing data, include processing and analysis codes.
Scientific Social Networks
Pragmatic
Encourage networking and promoting research results.
Promote published datasets as research results in social networks.
Citizen Science
Public
Collaboration between those in charge of research and the public by involving the latter, possibly at all stages of the research process.
Train citizens in RDM practices. Their contribution will become a new source of data to be taken into account while managing the data.
Open Educational Resources (OER)
Public
Open access to scientific knowledge also involves educational practices that provide content to which everyone has access.
Use open data as an OER when in an educational context (Atenas & Havemann, 2015).
As we now understand from previous chapters, RDM practices are useful throughout all phases of a research project. It is interesting to note that RDM practices are also found throughout the different open science areas of activity. We also note that none of the emerging open science practices are directly associated with the measurement school of thought, whereas most of them are strongly influenced by the pragmatic school (four out of nine categories). Remember that the pragmatic school aims to make science more efficient, particularly by promoting collaboration.
The Benefits of RDM in Context
Open science practices are believed to have many benefits, including those illustrated in Canada’s Roadmap for Open Science. The table below includes questions about some of the open science benefits put forward by promoters of open science. Take this opportunity to reflect upon each of these questions.
Table 3. Questioning the benefits of open science through an RDM lens.
Opening Science…
Predominant School of Thought
Question on the RDM Context
Makes accountability easier
Pragmatic
Does the governing body behind the Tri-Agency Research Data Management Policy have the necessary monitoring system to enable this accountability?
Increases the reproducibility of results
Pragmatic
How is the reproducibility of results understood in the case of qualitative research?
Increases public trust in science
Public
How can we contribute to data literacy for citizens?
Reduces duplication of effort
Pragmatic
How can we promote reproducibility?
Accelerates innovation
Pragmatic
What types of data are used for what types of innovation?
Values the diversity of knowledge systems
Public
How can marginalized knowledge be meaningfully incorporated? (e.g., OCAP® principles)
Creates international and domestic synergies
Pragmatic
How can local elements be preserved despite the need for national or international harmonization?
We must avoid seeing open science practices as a panacea for issues that have always existed. Even if these practices and related RDM activities help to redefine ways of doing research and pave the way for new solutions, these issues cannot truly be curtailed without taking into account the structural realities that underlie them — which open science does not do. Here are some reflections prompted by the questions in Table 3.
Improving accountability: According to Canada’s Roadmap for Open Science, “Open Access to scientific research outputs provides greater accountability to taxpayers and research funders” (Office of the Chief Science Advisor of Canada, 2020). However, accountability requires effective RDM policy implementation from all levels of government, which seems unlikely given how little follow-up there has been by the three federal research funding agencies concerning their open access policy (Paquet et al., 2022).
Increasing public trust in science: Trust can’t be established by simply making more data (and more articles) available. We must also work to improve the public’s data (and information) literacy. Implementing RDM practices in a vacuum, without aligning them with open science objectives and literacy issues, is unlikely to fulfill the potential to improve public trust.
Accelerating innovation: Open science promotes the practice of sharing and reusing data that can support innovation. This is a laudable goal, especially if it includes social innovation, which we believe is both most needed by society and would most benefit from evidence-based data to inform decision-makers. However, there are methodological and epistemological challenges in producing evidence-based data in the humanities and social sciences and in developing infrastructure to enable their use by decision-makers. Canada, along with a dozen other countries, is working to establish mechanisms and information flows that would make evidence-based data accessible to decision-makers (Global Commission on Evidence to Address Societal Challenges, 2023).
Beyond the Optimistic Discourse on Opening Science
Mirowski (2018) believes that open science has its roots in a neoliberal ideology that underpins present-day science. He posits that the open science movement’s conceptualization of scientific institutions and of the nature of knowledge is driven by market imperatives rather than actual new problems in the conduct of research. For those who are less familiar with this political current, we suggest reading the article by McKeown (2022), which lists some characteristics of the neoliberal university.
In this section, we invite you to take a more critical look at these new developments by considering two issues. The first discussion seeks to draw lessons from the historical evolution of open access publishing; the second addresses the challenges related to data sharing in the context of qualitative research.
What Open Access Publishing Teaches Us
Commercial publishers have played a significant role in the evolution of scholarly communication practices in recent decades. The context of the recent COVID-19 pandemic has made it possible to demonstrate the role they could play in open access to knowledge. In 2020, there was an impressive increase in accessibility to scientific publications on coronaviruses compared to the previous two decades, and it was thanks to the cooperation of commercial publishers (Belli et al., 2020). However, it remains to be seen whether this openness will be maintained, since the strong growth was made possible through a bronze open access model, meaning many of the published articles do not have licenses guaranteeing their continued free access. Their availability is dependent on the goodwill of commercial publishers.
Table 4. Types of open access.
Types of Open Access
Definition
Free for Readers
Free for Authors
Diamond
Publication in journals that offer immediate open access.
Sometimes academia-controlled, immediate open access publishing initiatives supported by public funds and donations.
X
X
X
X
Hybrid
Some articles are released for open access upon payment of an article processing charge (APC); others require a subscription. Journals fully funded by APCs are classified as gold OA.
X
Depends on whether the author chooses to publish openly by paying an APC.
Bronze
Article made freely accessible by the publisher, but without a license guaranteeing perpetual open access.
X
Possibly temporary
X
Green
Self-archiving of one of the manuscript versions in a repository.
X
X
Several funding bodies have come together to exert pressure on commercial journal publishers to transition their business models to open access. At the 14th Berlin Open Access Conference in 2018 (Max Planck Digital Library), organizations from 37 nations across five continents issued a joint statement of support for Plan S.cOAlition S defines Plan S as follows: “Plan S is an initiative for Open Access publishing that was launched in September 2018. The plan is supported by cOAlition S, an international consortium of research funding and performing organizations. Plan S requires that, from 2021, scientific publications that result from research funded by public grants must be published in compliant Open Access journals or platforms” (Coalition S, n.d.). This is a strategy supported by a consortium of funding bodies, together named cOAlition S, which aims to make open access to publications a reality. The Fonds de recherche du Québec (FRQ) was one of the first North American funding organizations to join cOAlition S in 2021. This extensive and evolving movement in the scholarly information economy ecosystem means that libraries will eventually manage very few subscriptions. In all likelihood, subscriptions will be replaced by financial agreements with commercial publishers which will include the payment of researchers’ article processing charges by their respective institutions.
Suffice it to say that commercial publishers of scholarly journals will continue to thrive; according to a 2017 study reported by Zhang and her colleagues (2022), article processing charges are increasing at a higher rate than the consumer price index. This is a familiar echo of how increasing journal subscription costs previously put a stranglehold on academic libraries around the world, with public funds being used to pay for unsustainable price increases. Funds provided for these new financial agreements will mostly end up in the pockets of commercial publishers who control APC price increases — to the detriment of the development of diamond-type open access models. These types of open access models allow scientists to publish open access and at no cost and are more consistent with the principles of open science, because the journals are financed by public funds, university funds, or by foundations (Institut Pasteur, 2021). Diamond-type models are also in perfect harmony with the original motives of the first open access initiatives, like the Bethesda Statement and the Berlin Declaration in 2003: to give the power of the dissemination of knowledge products back to research communities.
Many people and groups participate in the scholarly information economy; some have corporate interests that are more focused on profit than on supporting actual research. Considering that data sharing as a formal part of scholarly communication (i.e., with its own publishing standards and practices) is still in its infancy, one wonders if similar economic forces aren’t seeking to shape these standards and practices and to control the underlying data infrastructures. Can proponents of new data sharing practices learn from the experience of open access?
Data Sharing and Qualitative Research
Researchers working in the field of qualitative research wonder about the impact that open science will have on publishing requirements in their discipline. This questioning stems from both the definition often attributed to research data and the trend towards open data observed in several countries. For example, the OECD Principles and Guidelines for Access to Research Data from Public Funding state that
Sharing and open access to publicly funded research data not only helps to maximize the research potential of new digital technologies and networks, but provides greater returns from the public investment in research (OECD 2007, p. 10).
Funding agencies that encourage data sharing often have a cursory definition of research data. The three federal research funding agencies (the agencies) define research data as “facts, measurements, records, or observations collected by researchers and others, with a minimum of contextual interpretation” (Government of Canada, 2023).
We will demonstrate below how data sharing and the definition of research data raise concerns for qualitative researchers.
Question of Context and Reproducibility
As shown in Table 3, one of the benefits attributed to open science is that it increases reproducibility. However, members of the qualitative research community maintain that research context is vital and should be considered before a project’s research results can be reproduced. From the positivist perspective of the natural sciences or biomedical sector, data is generally considered to be context-free, as the definition from the three federal research funding agencies (above) states. On the other hand, in qualitative research, which often uses a constructivist perspective, the context is inseparable from the research question (Hesse, 2018, p. 566). As such, the issue of the reproducibility of results cannot be addressed in the same way as it is in the pure sciences. With these considerations in mind, how can data from qualitative research projects be shared and reused? In practical terms, will it be possible, with shared data, to take the context of data production into account?
Myth of Raw Data and Neutral Data
In the context of qualitative research, it is important to be aware that shared data will have previously been the subject of interpretation. Regardless of the discipline, a dataset is a construction that cannot be abstracted from the people who created it. Before being deposited in a repository, the dataset was the subject of deliberations, negotiations, and decisions of inclusion and exclusion that are well anchored in predominant discourses as well as historical and socioeconomic realities. Therefore, it is impossible to claim that shared data is neutral (Neff et al., 2017). The importance of dataset documentation is therefore clear, but documentation nonetheless does not capture tacit knowledge that is invaluable for understanding a dataset. From this perspective, data sharing appears to be an eminently complex exercise.
Promotion of Particular Types of Research and Prioritization of Methodologies
According to the OECD, for a dataset to be shareable, it must meet certain criteria, including, ideally, being available digitally (OECD, 2007). The digital nature of data can lead to promoting the use of big data, since these large datasets, produced quickly and in a variety of formats, are increasingly available and easy to access. The emphasis being put on research involving massive datasets raises the risk that qualitative methodologies will be subordinated to quantitative ones. In addition, a shift could occur so that techniques typically used to analyze qualitative data will only serve to confirm the results provided through quantitative methods (Hesse et al., 2018). Finally, Hesse et al. also report the fear that research using small datasets will receive less recognition than research involving large data collections (2018).
Conclusion: Being Open About Open Science
We have seen how RDM activities permeate open science practices, and we’ve discussed how the predominant, enthusiastic, and resolutely optimistic discourse on the adoption of these open science proposals overlooks the complexity of the real world issues they purport to solve. The limited space for this chapter and the overall educational purpose of this textbook prevent an in-depth treatment of the ideological foundations of this call to open science. However, it is interesting to note that the concerns raised by these new practices have produced a new field of study: critical data studies. This recent area of research offers possible solutions for RDM practices that take different disciplinary norms into account. More specifically, since qualitative research is being pushed to change before important disciplinary consensuses have emerged, we believe that using critical data studies to analyze professional practices relating to RDM will help prevent qualitative research communities from being subsumed by more dominant research cultures.
A critical or socio-political approach to interpreting open science developments would make it easier to step back and shed new light on the enthusiastic discourse surrounding the open science movement and its practices. We are delighted to conclude this chapter by inviting RDM practitioners to take accountability in their professional practices by digging into the discourse of this vast open science movement to try to develop potential answers to the following questions: Which economic and political systems are producing social structures, values, norms, ideologies, goods, and financial products? For whom? With what technologies and why those technologies? Where in all of this are the open science infrastructures situated? And who benefits from the opening of science?
Reflective Questions
Compare the definition of open science in the Foster Open Science portal with the one proposed in this chapter by Vicente-Saez and Martinez-Fuente. What differences and similarities can you identify?Foster Open Science definition: Open Science is the practice of science in such a way that others can collaborate and contribute, where research data, lab notes and other research processes are freely available, under terms that enable reuse, redistribution and reproduction of the research and its underlying data and methods.
By which school(s) of thought do you think RDM is mainly influenced ?
True or false: Considering how open access publishing has developed, there is no reason to worry that a few companies with commercial interests will build an oligopoly on products that facilitate the exploitation of research data.
Why should the question of research reproducibility be addressed differently in qualitative research than in the pure sciences?
What new area of research would enable you to gain a more critical perspective on RDM practices?
Five schools of thought shape open science practices: the public school, the democratic school, the pragmatic school, the infrastructure school, and the measurement school.
Open science practices can be categorized into nine major sectors of activity affecting all stages of a research project, from its conception to its dissemination: openness of research protocols, use of electronic notebooks, open data, open peer review processes, open access, open source code, scientific social networks, citizen science, and open educational resources.
In the current structure of open access publishing, public funds are still largely allocated to commercial publishers, and the question remains as to whether current and future open science infrastructures could be subject to the same oligopolistic risk.
The practices of opening and sharing research data present epistemological challenges in the fields of humanities and social sciences and in qualitative research methodologies. These include the complexity of sharing qualitative research data, the prioritization of certain research methodologies, and the impossibility of neutral data.
Additional Readings and Resources
Foster Open Science portal, an online learning platform covering all open science topics
Iwasiński, Łukasz. (2020). Theoretical Bases of Critical Data Studies. Teoretyczne podstawy critical data studies., 115A(1A), 96-109.
Reference List
Belli, S., Mugnaini, R., Baltà, J., & Abadal, E. (2020). Coronavirus mapping in scientific publications: When science advances rapidly and collectively, is access to this knowledge open to society? Scientometrics, 124(3), 2661-2685. https://doi.org/10.1007/s11192-020-03590-7
Fecher, B., & Friesike, S. (2014). Open science: One term, five schools of thought. In Bartling S. and Friesike S. (Eds.) Opening science: The evolving guide on how the internet is changing research, collaboration and scholarly publishing (pp. 17-47). Springer. https://doi.org/10.1007/978-3-319-00026-8_2
Gingras, Y. (2014). Les dérives de l’évaluation de la recherche. Du bon usage de la bibliométrie. Raisons d’agir.
Hesse, A., Glenna, L., Hinrichs, C., Chiles, R., & Sachs, C. (2019). Qualitative research ethics in the big data era. American Behavioral Scientist, 63(5), 560–583. https://doi.org/10.1177/0002764218805806
McKeown, M. (2022). The view from below: How the neoliberal academy is shaping contemporary political theory. Society, 59(2), 99-109. https://doi.org/10.1007/s12115-022-00705-z
Neff G., Tanweer A., Fiore-Gartland B., & Osburn L. (2017). Critique and Contribute: A Practice-Based Framework for Improving Critical Data Studies and Data Science. Big Data. 5(2), 85-97. https://doi.org/10.1089/big.2016.0050
OECD – The Organization for Economic Cooperation and Development. (2007). OECD principles and guidelines for access to research data from public funding. https://www.oecd.org/sti/inno/38500813.pdf
Paquet, V., van Bellen, S., & Larivière, V. (2022). Measuring the prevalence of open access in Canada: A national comparison. The Canadian Journal of Information and Library Science / La Revue canadienne des sciences de l’information et de bibliothéconomie, 45(1), 1–21. https://doi.org/10.5206/cjilsrcsib.v45i1.14149
Vicente-Saez, R., & Martinez-Fuentes, C. (2018). Open science now: A systematic literature review for an integrated definition. Journal of Business Research, 88, 428-436. https://doi.org/10.1016/j.jbusres.2017.12.043
Zhang, L., Wei, Y., Huang, Y., & Sivertsen, G. (2022). Should open access lead to closed research? The trends towards paying to perform research. Scientometrics, 127, 7653–7679. https://doi.org/10.1007/s11192-022-04407-5
About the authors
Cynthia Lisée
Cynthia Lisée has been involved with RDM at UQAM since 2018 and has acted as research support librarian since 2020. She participates or has participated in various RDM working groups (Alliance, PBUQ and UQAM). At UQAM, she is a member of the team leading the implementation of the institutional RDM strategy. Support for scholarly journals is also part of her portfolio. She holds a bachelor’s degree in physics and has explored geology. She also holds other university diplomas and completed courses in the humanities and social sciences, including a Master’s degree in Information Science from the Université de Montréal. ORCID: 0000-0003-3883-3676
Édith Robert
Édith Robert is a librarian at UQAM’s École des sciences de la gestion. She holds a Master’s degree in sociology, and has worked for many years in various research centers. Combining her interests in the academic library profession with the theoretical approaches developed by the sociology of science, she is interested in the issues of scholarly communication and the question of “marginalized” knowledge in the development of collections. She is also a member of the ACFAS advisory service and teaches in the Research Techniques and Data Management program at Rosemont College.
A Practical Perspective on the Evolving Field of Research Data Management
18
Dr. Joel T. Minion
Learning Outcomes
By the end of this chapter you should be able to:
Understand central factors that drive the development of Research Data Management.
Identify the roles and responsibilities of different groups involved in Research Data Management.
Appreciate the extent to which Research Data Management, research methods, and data types continue to evolve nationally and internationally.
Formulate a basic strategy for managing a particular set of research data.
Introduction
As you now know, the systematic management and oversight of research data is rapidly becoming a core skill set for researchers at higher education institutions in Canada and internationally, as well as for the librarians and other data professionals who support researchers. While advances in how different types of data are managed benefit all research in the long term, this shift continues to raise a host of practical concerns for those responsible for Research Data Management (RDM). One core challenge is that RDM is an emergent field of practice. How data are expected to be managed varies by data type, field of study, institution/funder, and jurisdiction. Initiatives to manage and share genomic data, for example, are more advanced than efforts involving ethnographic data. Similarly, not every country attaches the same urgency to implementing strategies for advancing RDM.
This situation means that for researchers and others needing to manage data, sometimes there may be a clear path to follow with reliable signposts, while in other cases, it’s about breaking trail. What all RDM work has in common is a need to think critically about the tasks at hand. No single approach will apply across the board. The aim of this chapter is to help you develop a critical perspective when managing research data, regardless of your role in the process. As you will see, the ability to think through RDM-related challenges requires skill sets spanning multiple areas: developing a familiarity with the complexities of research data; applying current approaches in novel circumstances; knowing how and when to look to external communities of practice for support; and sharpening your own resourcefulness and creativity.
The key takeaway is that the work of managing data is both an art and a science. While there may be principles and practices to guide the way, “doing RDM” frequently comes down to time-strapped researchers new to RDM who are trying to wrangle their data into shape as best they can.
The discussion is framed around three questions:
Why the push for RDM? This examines what is driving new requirements to manage research data more systematically and why the answer matters to you.
Whose responsibility is it? RDM work encompasses different groups. The responsibilities and expertise of each impacts how work gets done and support is provided.
Where is the leading edge? Because RDM is still emergent, your efforts need to be guided by current practice and by an awareness and appreciation of ongoing change, whether in Canada or abroad.
With these questions in mind, the chapter concludes with a series of practical steps to consider when managing research data for any project. Together, the questions and steps are meant to help you enhance your problem-solving skills and maximize your capacity for RDM-related work.
Why the Push for RDM?
If you’re new to research data, you may be surprised to learn how innovative a systematic, externally driven approach to RDM is. The management of research data has commonly been left to researchers, who, along with their institutions, have been responsible for how data are organized and archived, and whether they are shared with others. Research data have been frequently seen as proprietary, the product of a substantial investment of time, personal effort, education, and professional development on the part of the researcher. Data have formed the cornerstone of careers and the basis of scientific publications. They might be shared informally with close colleagues, but there has been minimal incentive — much less requirement — to organize data to external standards or to make them openly available to others.
Under this arrangement, there’s been little impetus for a more systematic approach to RDM. So what has now changed? To some extent, there has been a cultural shift in different research communities to acknowledge the impact that collaboration can have on the advancement of disciplines and the production of knowledge. While this evolution continues (more quickly in some fields than others), it alone does not entirely explain why concepts like the FAIR principlesand tools like Data Management Plans (DMPs) have emerged. Two other factors have been particularly impactful: (1) changing expectations by funders, and (2) technological advances and the power of big data.
Changing Expectations
For over a decade, major research funders (e.g., the three federal research funding agencies in Canada and similar bodies internationally) have moved to maximize knowledge output from the research they support. Funders demand well-organized and (ideally) open data for several reasons. First, well-managed data reduces duplication by allowing researchers to identify what studies have already taken place on a topic. RDM opens access to research data more fully, expanding beyond what is included in the papers or books a researcher chooses (or is able) to publish. Second, greater access to extant data translates into improved opportunities for secondary analysis, which maximizes research outputs for every dollar, Euro, pound, etc. invested. Finally, funders recognize that improved data management and openness safeguards the robustness and transparency of the research they support (Pinfield et al., 2014).
Exercise: The Rise of Data Management Plans
As you’ve learned in this textbook, the requirement that researchers submit Data Management Plans alongside grant applications is slowly becoming expected in Canada. In other countries, some funders have required DMPs for over a decade. Go online to find the earliest references you can to DMPs (either examples of plans or calls for them to be mandatory). Once you have a few examples, think critically about the types of data, fields of study, and countries/funders involved. What can your findings tell you about the rise of RDM?
Technological Advances
The second factor driving RDM is advances in computing technologies: notably, the capacity to generate, store, and work with very large datasets; the arrival of cloud computing and data sharing across the Internet; and decreasing costs of computing technologies. Such improvements were originally of greatest benefit to fields working with big data (e.g., astronomy, genomics, geospatial mapping), which explains in part why RDM has advanced more quickly in some disciplines than others (the nature of the data involved — quantitative — is another factor). Such technological progress has shaped what is possible in other fields of study, such as the digitization of humanities resources and the capacity to analyze social media data. Improvements in analytic software have also permitted research data to be linked securely to other forms of data (e.g., medical records, meteorological sources), creating still larger datasets.
Other Factors
Of course, other factors are also driving RDM. Managing data more consistently makes the research process more efficient and can lead to more robust findings. As discussed in the chapter on RDM and qualitative research, better organization of interview data enhances analysis because connections can be made within large sets of transcripts which would otherwise be difficult to make. Research is also increasingly transdisciplinary, meaning it crosses epistemological boundaries and methodologies and brings together diverse groups of researchers. RDM supports such efforts and facilitates collaboration. Lastly, some scholars at the end of their careers want to leave behind data-based legacy products that explain their data beyond what is captured by standard metadata, like how and why a particular methodology or theory was applied to generate the data. Enhanced RDM practice also allows highly experienced researchers to link together data from an array of related studies, sometimes spanning decades. Better management (especially documentation) ensures that future use of such data respects what is — and isn’t — possible in terms of secondary analysis.
Acknowledging the drivers of RDM helps us understand why data management is important and what our own data objectives are. If you’re a researcher, is your priority simply to meet the RDM requirements of your funder? Or is it also to establish a comprehensive research agenda over time? If you’re a data librarian helping researchers prepare their data for deposit in a repository, what do you need to know about the expectations for RDM in a particular discipline? What baseline are you working towards? There are many reasons for doing RDM and many levels at which it can be done. It’s therefore critical to align the RDM strategy and endpoint for a particular project with wider contextual factors.
Whose Responsibility is It?
The push for more systematic approaches to RDM brings with it questions about who is responsible for what. Who organizes data and how? Who decides what metadata standards to observe? Who selects a repository? The list of tasks and decisions is extensive. As a rule, final responsibility for managing data rests with the most senior researcher involved on a project, namely the principal investigator (PI). In practice, PIs routinely delegate most RDM-related work (e.g., data collection, cleaning, organization, archiving) to other members of their teams, notably post-doctoral researchers and research associates. This is where most data management in research takes place.
Delegating responsibility brings with it at least two complications. First, the individuals who are closest to and often most familiar with a dataset are frequently employed on shorter-term contracts. When they move on to other opportunities (as many do), their knowledge goes with them unless measures are taken in advance to document that knowledge as fully as possible. Unfortunately, this doesn’t always happen, impacting how effectively and consistently data are managed across the length of a study. Second, depending on their experience and training, such team members may be adept at RDM and require minimal guidance, or they may be new to RDM principles and best practices, meaning they require close oversight, effective training, and support from data management experts outside the research team.
Internationally, two models have emerged for providing RDM support services: librarian-led and researcher-led. Both seek to upskill researchers at all levels and to facilitate data management in line with funder expectations, journal demands, and the evolving practice of specific disciplines. A key difference between the models is who provides the support.
A librarian-led approach to RDM is most common in North America. It allocates responsibility for RDM services to academic libraries, where data librarians and other professionals help train and assist researchers with the management of their research data and support RDM strategy at an institutional level.
The researcher-led approach is seen frequently in Europe, where responsibility for RDM services is assigned to newly created divisions within universities. Such offices may be located in — but not necessarily of — the academic library, meaning RDM services are developed and managed separately from library services. RDM support work is typically delivered by individuals with doctorates (or at least research-based master’s degrees).
Exercise: Who’s Being Hired?
Evidence for the two models is particularly apparent in job advertisements. North American RDM positions generally demand qualifications distinct from those required in Europe. The two listservs below regularly include RDM-related job postings. Consider subscribing to each to follow the discussions and compare jobs to review the qualifications demanded of applicants. (The lists are also great if you’re interested in RDM more generally.)
Each model has its strengths and limitations. Academic librarians are experts in managing information and, in North America, typically share a common qualification (i.e., an ALA-accredited MLIS degree). As such, they have a comparable grounding in information management principles and practices. On the other hand, while some academic librarians conduct research or hold PhDs, their primary professional role is research support, meaning they may have a limited background in conducting larger research projects or collecting and analyzing complex data.
By comparison, researchers become data experts as they earn their doctorates. Across their careers, they spend years entrenched in particular research cultures, working directly with data. But they are less likely to have proficiency in standardized ways of managing and organizing information and data. It’s not uncommon for researchers to develop idiosyncratic systems that work best for themselves and their teams.
Case Study: The RDM Program at TU Delft, Netherlands
TU Delft is the largest technical university in the Netherlands. Its RDM program is among the world’s most advanced and creative. It offers an interesting contrast to services currently being developed at Canadian universities. Launched in 2018, the Delft program was founded on two core principles: (1) researchers are central to open science, and (2) data stewards can serve as consultants in improving RDM culture and practice across the university. From the outset, the program’s objective has been to improve data management culture, not compliance.
The Delft approach is unique in several ways. First, it allocates a data steward to each of its faculties, inserting RDM directly into the research setting rather than expecting researchers to seek out services. Data stewards are therefore well placed to gauge what is happening on the ground. Second, the data stewards typically have PhDs, meaning they have advanced research credentials and often experience. Finally, the program was established as an active learning initiative, investing time and energy into analyzing its services and reporting key findings in journals and at conferences.
To understand the Delft approach, visit their website and read more about the role of the data steward and who they’ve hired into these positions.
Plomp, E., Dintzner, N. J. R., Teperek, M., & Dunning, A. (2019). Cultural obstacles to research data management and sharing at TU Delft. Insights, 32(1). https://doi.org/10.1629/uksg.484
There is little examination in the literature of the models or their effectiveness. This likely reflects the degree to which RDM services are still being established and integrated into academic structures and cultures. What the models tell us already is that RDM involves multiple groups. While final responsibility for RDM rests with PIs, routine data management and the oversight and delivery of support services typically fall to others. It is important to acknowledge that researchers, librarians, and other data professionals each bring their own expertise and perspectives to how data can be managed and to how RDM should develop going forwards.
Where is the Leading Edge?
As much as RDM is a relatively recent phenomenon, it’s important to remember that research and data evolve. New topics of inquiry and research technologies continue to appear (e.g., the opioid crisis, gene editing), as do novel types of data and ways to analyze them (e.g., social media data, augmented analytics). Such advances allow research that wouldn’t have been possible even a few years ago. While the pace of such change varies over time and by field of study, it impacts how we approach RDM, including what support services are available and how they are provided. This section highlights two examples where it’s important to reflect critically on current practice and stay attuned to developments taking place elsewhere.
The first involves the frequent use in RDM training of a lifecycle infographic to represent the research process and data management within it — discussed in chapter 1. Such images are meant to spotlight standard steps in research, from initial planning to data archiving and reuse. Lifecycle models are effective because they’re accessible, but such imagery does not always align well with how some forms of research unfold. This may lead to flawed understandings of how RDM can or should take place. For instance, much social science data is collected iteratively, meaning researchers undertake real-time reflection and methodological modification throughout the data collection process. A sociologist, for example, may introduce new lines of questioning or new participant groups during a series of focus groups. As a result, such studies do not unfold in ways similar to lab-based research.
Despite their circular imagery, lifecycle models are curiously linear and imply a start-to-finish process that doesn’t map well onto some methodologies. Such models also fail to highlight the importance of relationships in data collected across interrelated studies or over periods of time (e.g., in longitudinal research). They struggle to represent the ways extant data are increasingly used to generate new data through secondary analysis and data linkage, with the results then augmenting the capacity for still more research. The challenge for RDM practice and service delivery becomes how to keep up with the expanding ways research is conducted and the types of data generated.
Exercise: Critiquing the Research Lifecycle
In 2018, Cox and Tam published a paper challenging the use of lifecycle models to represent the research process. They contrasted the usefulness of such models with the propensity for models to oversimplify the activities involved. The authors called for researchers from a variety of subject areas to become more involved in developing such models. Read their paper and consider how RDM service providers (e.g., librarians offering RDM training) might better represent and incorporate the complexities of research into data management.
Cox, A. M., & Tam, W. W. T. (2018). A critical analysis of lifecycle models of the research process and research data management. Aslib Journal of Information Management, 70(2): 142-157. https://doi.org/10.1108/AJIM-11-2017-0251
The second example demonstrating the need to monitor the leading edge of RDM involves administrative and governance structures. A refrain heard frequently in data sharing, especially regarding the use of repositories, is that data should be as open as possible but as restricted as necessary. But how does this translate into practice? Current approaches typically include open access, the imposition of an embargo period (i.e., access is not allowed for an initial period of time before being made openly available), or maybe requisite permission from the original researcher. What other options are possible?
In some areas of research, infrastructures have been developed to review proposed uses of data prior to data being released. Such governance systems help ensure compliance with original ethics restrictions, prevent damage being done to the original researcher’s (or research team’s) intellectual property, and prevent harm to study participants, such as the re-identification of individuals (Murtagh et al., 2018). Enhanced forms of review can also facilitate data access by non-researchers (e.g., journalists, political groups, citizen scientists) while also ensuring that a researcher’s work is not intentionally or unintentionally brought into disrepute (Murtagh et al., 2018).
One such form of governance is the Data Access Committee (DAC). Still found mostly in Europe and the United States, DACs are independent decision-making bodies whose purpose is to oversee access to datasets for research purposes. They act somewhat like an ethics committee but at the tail end of research, regulating access to data that have already been collected. DACs are most common in human biomedical research, where combining data allows for more advanced analysis of much larger samples. For example, a team may want to pool data from several biobanks internationally to study the link between a genomic variant and a particular health condition. Because such data are highly disclosive, they are unlikely to ever be openly available. Some DACs use machine-based decision-making tools to render decisions based on level of risk, while others rely on reviews by experts in the field. Human committees are typically preferred where research is leading edge, where data are being used in novel ways, or when the subject area is particularly sensitive.
Case Study: METADAC
From 2015 to 2020, I was part of a team conducting an ethnography of METADAC (Managing Ethico-social, Technical and Administrative issues in Data ACcess), a Data Access Committee in the United Kingdom. METADAC oversaw access to genomic and biosocial data held by several major longitudinal cohort studies. The committee members reviewed applications from researchers worldwide who proposed research that was sociotechnically complex and at the vanguard technologically (e.g., linking genetic profiles to voting patterns). METADAC ceased operations in December 2020 following changes in its funding structure, but its website (https://www.metadac.ac.uk) is still available with details about its structure and the projects it approved.
Murtagh, M. J., Blell, M. T., Butters, O. W., Cowley, L., Dove, E. S., Goodman, A., Griggs, R. L., Hall, A., Hallowell, N., Kumari, M., Mangino, M., Maughan, B., Mills, M. C., Minion, J. T., Murphy, T., Prior, G., Suderman, M., Ring, S. M., Rogers, N. T., … Burton, P. R. (2018). Better governance, better access: practising responsible data sharing in the METADAC governance infrastructure. Human Genomics, 12(1), 1-12. https://doi.org/10.1186/s40246-018-0154-6
It’s important to be aware of critical work, like that of Cox and Tam, or new data access infrastructures, like METADAC, because such knowledge helps inform how to manage data and organize RDM support services. The focus of RDM will shift as data management expands to encompass more disciplines and types of data and as the nature of research and data progresses. Your work in this field needs to be guided by current best practices and a need to accommodate change and stay abreast of developments elsewhere.
The Realities of Managing Research Data
Even with well-systematized processes in place, managing data will never be a checkbox exercise. There are always decisions to be made and ways in which data don’t quite fit existing practice. In this final section, we consider the reality of undertaking RDM on the front line of research. How do researchers (and those supporting them) collect, access, process, organize, analyze, describe, and archive research data in ways that meet the requirements of funders and host institutions but also fit pragmatically into the work of the research team?
Depending on the complexity of a project, the methodical management of research data can become overwhelming, disorganized, or overlooked altogether at any step in the process. Things can go awry whether you’re strategizing RDM at the start of study, troubleshooting issues in the middle of one, trying to make sense of data that already exist, or helping others in any of these situations. Despite such hurdles, research data can be managed effectively even in the most difficult situations if you think critically, act consistently, document what you do, and search out best practices and support where needed.
The following is a broad outline of things to consider when actively managing research data on the ground. It reads somewhat like a DMP, though this outline was developed from the perspective of doing RDM rather than planning for it. That is, while DMPs are meant to be living documents, nothing is as immediate for researchers as having to manage data alongside any number of other pressing tasks. The fact is that RDM is being shoehorned into a world that is already time deficient. The ideas put forward here are based on what I have learned directly and from colleagues over a decade-plus career as a researcher and data manager. The seven points raised below focus on researchers but should also help data librarians and other professionals gain greater insight into RDM.
RDM is as much about thinking and problem solving as it is doing. Managing data is a big-picture activity. It’s not only about the data and how to manage them. It’s one (relatively new) element within a much larger research process. Conversely, when undertaking a specific study, there may not be much to indicate exactly how data should be managed. To use a research-based analogy, analytic software like SPSS and NVivo make working with data more manageable. However, such programs do not analyze data. That is the job of the researcher. While RDM approaches can guide data management, researchers and those who support them must think critically about the data at hand and how to apply principles and practices in ways that are practical (and often novel), and that improve research processes and outputs. Put simply, when doing RDM, in addition to acting, allow enough space to reflect and think critically.
Write a Data Management Plan. DMPs are useful because they make researchers think through critical aspects of how they will manage data generated during a study. Even if a grant application doesn’t require a DMP, consider writing one. When you’re finished, ask yourself what your DMP does and doesn’t include. Remember that DMPs are goal oriented and aspirational: they tell you where you want to go and how you hope to get there. They do not address the realities of managing data in everyday research life, like dealing with a co-investigator who isn’t naming data files correctly or struggling to identify a suitable repository. This is where point 1 comes into play.
Consider what is driving your RDM efforts. These days, most of us involved in research are upskilling ourselves in RDM because we feel we have to, particularly since funders increasingly require evidence of good data management. But what other factors are at play in your project? As a mid-career researcher, you may realize that better organization of your data can positively impact your research findings or capacity to collaborate with others. As a post-doctoral researcher, you may notice that your study’s PI is also new to RDM, making for a great opportunity to beef up your skill set to help lead in this area. If you’re undertaking a secondary analysis, maybe you’re required to return your data to the original study and need to know what level of data management is expected. Whatever the situation, there are benefits to identifying why RDM is important to you.
What would the perfect outcome look like? This step is important for anyone working in disciplines that have few well-defined RDM guidelines or best practices. Spend time reflecting on the ideal approach for managing and archiving your data. If you were a researcher looking for data with which to conduct a secondary analysis, what would the perfect dataset look like in terms of its organization, documentation, metadata, access arrangements, and so forth? While such a picture-perfect solution may not exist, there are likely excellent close examples somewhere in the world. Again, think critically about where you might find them and start looking. Keep asking questions until you get answers you can work with.
Be prepared to approach your data and its management iteratively. Research data are almost never collected in their final state. Data variously need to be cleaned, reformatted, anonymized, aggregated, and so on, before being suitable for analysis and archiving. As a researcher, you must decide whether all your data are equally useful (to the project, to other researchers). It’s essential to document your data and their provenance because such details provide others (team members, secondary users) with critical information, including what analysis the data can and cannot support. All such efforts are dynamic, meaning what you think and do early in a study may change as the project unfolds. RDM is seldom a once-and-done undertaking. Something as straightforward as a file-naming protocol may no longer function properly at the analysis stage.
Who is doing what? Effective data management, especially when it involves research teams, requires defined roles and responsibilities as well as continual review to ensure what is meant to take place is indeed happening. Upskilling may be required for some or all team members, so assess the situation and identify outside resources early. Meetings may eat into precious time, but bringing team members together regularly to exchange information about RDM on a project helps address challenges when they inevitably arise, such as a post-doctoral researcher leaving for a tenure-track position. As always, make sure you and your team document RDM efforts systematically using resources like audit trails and standard operating procedures.
Accept that things may not go smoothly — but you’ll get someplace reasonable in the end. RDM is like the research processes it supports: ever changing and never perfect. Do the best you can and apply what you learn going forward.
Conclusion
This textbook is an excellent primer on critical issues in the management of research data in Canada. The various chapters introduce a wide cross section of valuable RDM principles, policies, strategies, and practices that you will need to know as a researcher, academic librarian, or data professional. The main takeaway from this chapter is simple: data management will always require reflection and an openness to new ideas and practices. For the most part, RDM remains the responsibility of researchers working in the trenches, most of whom are still new, not so much to managing research data but to managing it in line with emerging external requirements. Unfortunately, such requirements often do not translate readily to research as practiced, resulting in any number of ongoing challenges. Librarians and other data professionals offer valuable support in this work, although their efforts must be assessed critically as different service models arise. RDM is neither a singular nor a static enterprise. What you learn in this textbook is fundamental, but a critical perspective and curiosity about how things might be different elsewhere are equally essential.
Key Takeaways
Besides supporting sharing and reuse, effective management of data is integral to the research process, with the backbone of RDM work ideally taking place during a project rather than at the end. Consistent data management is also important across interrelated studies over time.
Responsibility for RDM is likely to fall to more than one person, with research team members assuming different areas of responsibility and potentially having divergent perspectives and skill levels. Day-to-day RDM tasks are frequently delegated to early-career researchers who will not be associated with the data long term.
Current approaches to RDM and best practices are dynamic. Be prepared to adapt and change, looking locally as well as further afield for emergent trends and alternate ways of problem solving.
Don’t expect to get everything right … because there may not be a “right” way to do things yet!
Pasek, J. E. (2017). Historical development and key issues of data management plan requirements for National Science Foundation grants: A review. Issues in Science and Technology Librarianship, 87. https://doi.org/10.5062/F4QC01RP
Rice, R., & Southall, J. (2016). The data librarian’s handbook. Facet Publishing.
Thompson, K., & Kellam, L. M. (Eds.). (2016). Introduction to databrarianship: The academic data librarian in theory and practice. In L.M Kellam & K. Thompson (Eds.), Databrarianship: The academic data librarian in theory and practice. Association of College and Research Libraries. https://scholar.uwindsor.ca/cgi/viewcontent.cgi?article=1047&context=leddylibrarypub
Whyte, A., & Tedds, J. (2011). Making the case for research data management. Digital Curation Centre.
Reference List
Cox, A. M., & Tam, W. W. T. (2018). A critical analysis of lifecycle models of the research process and research data management. Aslib Journal of Information Management, 70(2): 142-157. https://doi.org/10.1108/AJIM-11-2017-0251
Murtagh, M. J., Blell, M. T., Butters, O. W., Cowley, L., Dove, E. S., Goodman, A., Griggs, R. L., Hall, A., Hallowell, N., Kumari, M., Mangino, M., Maughan, B., Mills, M. C., Minion, J. T., Murphy, T., Prior, G., Suderman, M., Ring, S. M., Rogers, N. T., … Burton, P. R. (2018). Better governance, better access: practising responsible data sharing in the METADAC governance infrastructure. Human Genomics, 12(1), 1-12. https://doi.org/10.1186/s40246-018-0154-6
Pinfield, S., Cox, A. M., & Smith, J. (2014). Research data management and libraries: Relationships, activities, drivers and influences. PLoS ONE, 9(12): e114734. https://doi.org/10.1371/journal.pone.0114734
Plomp, E., Dintzner, N. J. R.,. Teperek, M., & Dunning, A. (2019). Cultural obstacles to research data management and sharing at TU Delft. Insights, 32(1). https://doi.org/10.1629/uksg.484
About the author
Dr. Joel T. Minion
Dr. Joel T. Minion, PhD MLIS MA BA (Hons) is a qualitative health researcher, librarian, data manager, and educator with experience in Research Data Management (RDM) in both Canada and Europe. He is currently a Research Scientist with the Faculty of Nursing’s Translating Research in Elder Care (TREC) research program at the University of Alberta, where he is responsible for legacy planning and asset protection of TREC’s longitudinal data. Joel was previously Qualitative Research Lead for the University of Calgary’s Health Technology Assessment Unit in the O’Brien Institute for Public Health, and before that a Senior Research Associate with Newcastle University’s Policy, Ethics and Life Sciences (PEALS) Research Centre in the UK. He holds a PhD in health informatics from the University of Sheffield and a MLIS degree from Western University. Since 2010, Joel has been actively involved in managing qualitative research data and ongoing efforts to integrate it into broader RDM frameworks.
Glossary
1
k-anonymity
a mathematical approach to demonstrating that a dataset has been anonymized.
l-diversity
one of many privacy-protecting risk assessments based on k-anonymity but more restrictive.
active storage
a storage tier that supports data during the active phase of a research project, while data are being created, modified, or accessed frequently.
administrative
data collected as a part of the process of administering something. Administrative data is used to track people, purchases, registrations, prices, etc.
anonymization keys
documents used by qualitative researchers to de-identify their data in a systematic way. They connect information that is removed from original data (e.g., the name of an individual in an interview transcript) and replaced with more generic text (e.g., Person 6). The researcher then works with the anonymized transcript but can use the key to re-identify individuals, places, organizations, etc., if such information becomes important again during analysis. Anonymization keys must be password protected, stored securely, and never kept alongside the data in question. They are often destroyed upon completion of a study.
application program interfaces (APIs)
a set of functions and procedures provided by one software library or web service through which another application can communicate with it.
Archival Information Packages (AIPs)
an Information Package, consisting of the Content Information and the associated Preservation Description Information (PDI), which is preserved within an OAIS (OAIS term). (Digital Preservation Handbook, n.d.).
archival storage
a storage tier that supports the series of managed activities needed to support long-term preservation of digital materials.
arguments
the values or variables that are provided to the function.
article processing charges
a publication fee charged to authors or their institutions for making their work open access.
ASCII
the American Standard Code for Information Interchange (ASCII) is a computer standard for character encoding. It contains 128 codes representing Arabic numerals from 0 to 9, the 26 letters of the Latin alphabet in lower and upper case, as well as mathematical and punctuation symbols.
audit trails
documentation that tracks activity and decision making throughout the life of a project, detailing what took place, when, and why.
backwards compatibility
backwards compatibility means that software can run on older hardware, or can read files created by an older version of the same software.
base map
an underlying or reference map that sits underneath the data, to give context to it. For example, if you make a map showing demographic information in particular census areas, then your map is harder to read without something to indicate where those abstract census area shapes are. Though you can also argue a map is an abstract representation as well, it is something people learn to read, and so can give positional information to situate the individual – so the base map allows that positional information to situate the data that is used overtop.
Biobanks
a repository that stores physical biological samples and biological data.
bit sequences
a precise sequence of bits (0 or 1) which, taken together, have a specific meaning. For example, they can represent a character, an operation to be performed (machine instruction), a color selection, a digital object, etc.
bit-level preservation
a level of preservation that commits to the preservation of the ordered ones and zeroes that comprise a digital object, but which does not necessarily address the understandability of the encoded data.
boxplot
also known as a box-and-whisker plot, a boxplot is a graphical representation of a dataset that displays the distribution of the data and any potential outliers.
camel case
writing text with no spaces or punctuation while using capital letters to distinguish between words.
categorical variables
a type of data that represent discrete categories. Ordinal categorical data are those that can be ordered or ranked sequentially. Examples include course letter grades (i.e. A, B, C, D, F) and Likert scales (5-point scale to measure latent constructs or phenomenon that cannot be observed directly). There are also nominal categorical variables, which cannot be ordered on a scale or in a sequence. These can be dummy-coded and included in a quantitative analysis. Examples of non-scalar categorical variables include gender, race, ethnicity, cities, etc.
checksums
unique numeric or alphanumeric strings of varying potential lengths produced by checksum-generating algorithms, like CRC, MD5, SHA1, and SHA256, based on the contents of a file.
cloud-based
a computational system that is distributed over more than 2 servers in more than 2 locations allowing for remote access via web browsers or APIs to compute power and/or data storage.
codebook
a document that describes a dataset, including details about its contents and design.
coding literacy
learning computer code has been compared to learning a new language. Coding literacy is the ability to comprehend computer code, much like mathematical literacy is the ability to comprehend math.
command-line tool
a computer program that can be run from the command line interface (CLI) of an operating system. The CLI is a text-based interface that allows the user to interact with the computer using typed commands, instead of using a graphical user interface (GUI) with menus and icons.
computational research
research that relies on computers for data creation and/or analysis.
a list of standardized terminology, words, or phrases, used for indexing or content analysis and information retrieval, usually in a defined information domain (CODATA Research Data Management Terminology, CC BY 4.0).
CSV data file
a delimited text file that uses a comma to separate values within a data record.
Data Access Committee (DAC)
an independent decision-making body whose purpose is to oversee access to datasets for research purposes.
data cleaning
the process of employing six core activities: discovering, structuring, cleaning, enriching, validating, and publishing data.
data dictionary
a machine-readable and often machine-actionable document, similar to a codebook, that generally contains detailed information about the technical structure of a dataset in addition to its contents.
Data Documentation Initiative (DDI)
a standards-based metadata schema developed for social science data.
Data Management Plan (DMP)
a formal description of what a researcher plans to do with their data from collection to eventual disposal or deletion.
data objects
for the purpose of the FAIR guiding principles, data object is defined as an Identifiable Data Item with Data elements + Metadata + an Identifier.
data packaging
the process of grouping data and information about data into a logical whole for use in a digital preservation process.
data stewards
while their role can vary, data stewards in a research context are individuals tasked with ensuring data are handled systematically and uniformly.
data twins
records in a dataset that have the same values on a set of indirect identifier variables.
de-identification
the process of removing from a dataset any information that might put research subjects’ privacy at risk.
delimiters
special characters reserved by computational systems or languages to denote independent objects or elements.
dependency
an additional software library that can be downloaded from the internet and used for specific programmatic tasks.
descriptive design
a type of study design concerned with exploratory questions (e.g. what? when? how? where?), which aims at exploring a phenomenon or observation to describe an effect.
Designated Community
a conceptual entity introduced by OAIS, representing potential users of a digital object being preserved by an archive. Designated Community is a crucial concept in long-term preservation planning because understanding the needs and capabilities of the Designated Community allows for informed decision-making regarding things like choices of file formats and retention of data.
digital humanities
an academic field concerned with the application of computational tools and methods to traditional humanities disciplines such as literature, history, and philosophy.
digital materials
any piece of information, either singular or in assemblage, that is stored by computers. They are called digital because all computer-readable versions of data are ultimately encoded as a series of ones and zeroes, which are the only inputs computing systems can understand.
Digital Object Identifier (DOI)
a name (not a location) for an entity on digital networks. A DOI provides a system for persistent and actionable identification and interoperable exchange of managed information on digital networks. A DOI is a type of Persistent Identifier (PID) issued by the International DOI Foundation. This permanent identifier is associated with a digital object that permits it to be referenced reliably even if its location and metadata undergo change over time (CODATA Research Data Management Terminology, CC BY 4.0).
digital preservation
the series of managed activities necessary to ensure continued access to digital materials for as long as necessary.
digital signatures
the equivalent of a handwritten signature on paper which offers guarantees on the authenticity of the identity of the signatory.
direct identifiers
information collected by the researcher that can uniquely identify human subjects, and include things like names, phone numbers, social insurance numbers, student numbers, and so on.
DMP Assistant
a web-based tool which asks users a series of questions about their data and research plans, with contextual help and guidance on how to answer those questions.
Dublin Core
simple and generic metadata schema that uses 15 optional and repeatable core elements like title, creator, format, and date. Created in 1995, Dublin Core is also an international standard (ISO 15836).
dummy variable
a dummy variable is a text or non-quantitative variable that is assigned a number for the purpose of quantitative analyses. For example, a dataset that includes a variable for gender with options such as female coded as a 1, male coded as a 2, non-binary coded as a 3, and prefer not to respond coded as a 4.
electronic lab notebook
online tools built off the design and use of paper lab notebooks
emulation
a means of overcoming technological obsolescence of hardware and software by developing techniques for imitating obsolete systems on future generations of computers (Digital Preservation Handbook, n.d.).
equivalence class
a set of records in a dataset that has the same values on all quasi-identifiers.
ethics approval
authorization to carry out a research study that’s granted by bodies variously referred to as: Ethics Review Boards, Research Ethics Boards, Research Ethics Committees, or Institutional Review Boards.
evidence-based data
evidence-based data comes in a variety of forms and is the result of some form of research activity, including data analysis, modeling, literature syntheses, and evaluations that produce guidelines and assessments of the implementation of a process or technology and its cost-effectiveness.
explanatory design
a type of study design concerned with causal relationships (i.e. causes and their effects, or questions concerning the "why" of an effect), which aims at explaining a phenomenon or observation in order to understand an effect.
Exploratory Data Analysis
a process used to explore, analyze, and summarize datasets through quantitative and graphical methods. EDA makes it easier to find patterns and discover irregularities and inconsistencies in the dataset.
FAIR
Findable, Accessible, Interoperable, Reusable.
FAIR principles
guiding principles to ensure that machines and humans can easily discover, access, interoperate, and properly reuse information. They ensure that information is findable, accessible, interoperable, and reusable.
file extensions
suffix assigned to a file to identify it. For example, a file created with Word software will have the extension DOCX.
file format
a standardized method of arranging ones and zeroes that can be used to encode specific types of information.
fixity
a concept relating to the permanence of digital objects. Establishing consistency in digital objects can be tricky, as the way they are stored means that objects are often copied or transmitted frequently, raising questions as to whether the resulting object is the “same” as the object before copying/transfer. In common practice, fixity is closely tied to the generation and verification of checksums, which can help ensure that an ordered series of bits have remained unchanged.
fork
in GitHub, a copy of a dataset that retains a link to the original creators.
format obsolescence
a threat to the longevity of digital objects based on an inability to decode the bitstream comprising the digital object. Format obsolescence threats are often addressed through a program of file format identification, validation, and – if necessary – normalization/migration.
global data reduction
making changes to variables across datasets, such as grouping responses into categories.
histogram
a graphical representation of the distribution of a set of continuous or discrete data.
homogeneity attack
a method of violating the confidentiality of a group of research subjects that can happen when everyone with a particular set of demographic characteristics also have a particular sensitive characteristic.
identifying information
any information in a dataset that in combination could lead to disclosing the identity of an individual.
Indigenous data sovereignty
the right of Indigenous Peoples to collect, access, analyze, interpret, manage, distribute, and reuse all data that was derived from or relates to their communities.
indirect identifiers
also known as quasi-identifiers, these are characteristics of people that do not uniquely identify individuals on their own but may, in combination, serve to reveal someone’s identity. A characteristic should only be considered quasi-identifying if an attacker could plausibly match that characteristic to information in an external source.
integrated development environment (IDE)
a software application that provides a comprehensive environment for software development. RStudio is an integrated development environment (IDE) that enables users to write, debug, run R code and display the corresponding outputs.
integration
the process of connecting different, often disparate systems or tools into a cohesive infrastructure.
integrity checking
can be linked to the definition already in the glossary for fixity.
interoperability
the ability of data or tools from non-cooperating resources to work with or communicate with each other with minimal effort using a common language.
interoperable
interoperability requires that data and metadata use formalized, accessible, and widely used formats. For example, when saving tabular data, it is recommended to use a .csv file over a proprietary file such as .xlsx (Excel). A .csv file can be opened and read by more programs than an .xlsx file.
interval measurement scale
an interval measurement scale refers to numbers that are equally distanced from each other in ascending or descending order and where zero may be a point on the scale (i.e. zero does not mean the absence of a value). Examples include temperature and time. In the case of the Celsius temperature scale, zero refers to the point at which water freezes, but not the absence of temperature.
iterative
an iterative approach to research is one in which ongoing review and adjustment are embedded into the research process. As a result, a study design may be further adapted based on what is learned as data are collected and analyzed.
knowledge mining
collecting Indigenous knowledge without seeking permission or consulting stakeholders in the community.
knowledge theft
collecting Indigenous knowledge without seeking permission or consulting stakeholders in the community.
Law 25
An Act to modernize legislative provisions as regards the protection of personal information
layers
the visual representation of a geographic dataset in any digital map environment. Conceptually, a layer is a slice or stratum of the geographic reality in a particular area, and is more or less equivalent to a legend item on a paper map. On a road map, for example, roads, national parks, political boundaries, and rivers might be considered different layers (ESRI, n.d.).
Likert scale
a Likert item is a question on a survey which asks respondents to select a response to indicate how much they agree or disagree with a statement. A Likert scale is developed by adding up or averaging a number of related Likert items.
literate programming
where code, commentary, and output display together in a linear fashion, much like a piece of literature.
local suppression
deleting individual cases or responses.
longitudinal design
a type of study concerned with the effect of time on an outcome. In other words, a study that measures an outcome at more than one point in time. For example, a longitudinal survey design involves repeating the same survey on the same individuals over time to understand changes in attitudes or behaviors.
loss of provenance
a threat to the longevity of digital objects based on members of the user community being unable to discern important information about the digital object, such as its source, its history of changes, and ultimately its authenticity. Threats to the provenance of a digital object are often addressed through the careful creation and maintenance of preservation metadata.
lossless compression
file size reduction mechanism that preserves all original data.
machine-readable metadata
metadata in a form that can be used and understood by a computer.
MAMIC
Maturity Assessment Model in Canada. A Canadian-specific RDM assessment tool designed to help evaluate the current state of institutional RDM services and supports as part of an institutional RDM strategy development process. It focuses on four areas of service and support — Institutional Policies and Processes, IT Infrastructure, Support Services, and Financial Support — and allows users to assess the maturity and scale of these services.
maturity assessment models
tools used to evaluate the level of sophistication of a service or product. These models measure the level of attainment in relevant capability areas using a scale (e.g., 0-4 or 1-3), which allows users to quantify capabilities and enable continuous process improvement.
Maturity Level
in the MAMIC, a measure of how complete a particular element is in relation to RDM. The lower the level, the less developed (mature) the element is.
media degradation
a threat to the longevity of digital objects based on the decay of the carrier medium upon which they are stored. Sometimes called “bit rot.” Media degradation threats are often addressed by preservation actions that ensure bit-level integrity, including the active monitoring of digital objects to detect corruption/loss, and are often protected by maintaining multiple copies of an object on different pieces/types of media.
media obsolescence
a threat to the longevity of digital objects based on the notion that the media upon which they are stored may no longer be usable because a user would not have the correct hardware (or software like drivers) to access the data on the media. At the time of this writing, media obsolescence is commonly associated with floppy disks or various data cartridge formats that have fallen out of common use over time. Media obsolescence threats are often addressed by bit-level integrity methods, including the migration of digital objects to newer, more modern carriers on a regular basis.
metadata
data about data; data that define and describe the characteristics of other data.
metadata schemas
a grouping of elements intended to describe a resource. For each element, the name and the semantics (the meaning of the element) are specified. Content rules (how content should be phrased), representation rules (e.g., capitalization rules), and allowed element values (e.g., from a controlled vocabulary) may be optionally specified, but this is not always the case.
modèle d’évaluation de la maturité de la GDR au Canada
the French translation of the Maturity Assessment Model in Canada (MAMIC). See the MAMIC glossary entry for more.
multifactor authentication
multi-factor authentication requires two things: a password and a device. When you use your password to sign into a service, your login prompts a request for a one-time code generated by a device such as a cellphone or a computer. One-time codes may be delivered by text message or email, or they may be generated on your device via an authentication app like Google Authenticator. Many banks and government organizations, such as Canada Revenue Agency, now require users to enable two-factor authentication.
non-proprietary
not owned by a company.
normalization
process of converting copies of original files to one of a small number of non-proprietary, widely-used, and preservation-friendly formats during ingest. Normalization standardizes ingested material into a subset of formats stored by an archives, and allows the archives to avoid managing a large number of formats into the future. However, normalization can also alter file sizes and properties. Archives should assess normalization priorities and approaches through researching and defining file format policies (Scholars Portal, n.d.).
OAIS
(ISO 14721) the Open Archival Information System. Published in 2005 and revised in 2012, OAIS defines a set of requirements for an information system meant to maintain the usability of digital objects over time.
oblique photos
aerial photograph taken with the axis of the camera held at an angle between the horizontal plane of the ground and the vertical plane perpendicular to the ground. A low oblique image shows only the surface of the earth; a high oblique image includes the horizon (ESRI, n.d.).
OCAP®
an acronym for ownership, control, access, and possession. These four principles govern how First Nations data and information should be collected, protected, used, and shared. OCAP® was created because Western laws do not recognize the community rights of Indigenous Peoples to control their information.
open access
the free, immediate, online availability of information coupled with the rights to use this information fully in the digital environment.
open data
online, free of cost, accessible data that can be used, reused, and distributed provided that the data source is attributed.
open format
the format’s technical specifications are public; the information that helps to understand its operation and its structure are accessible.
open science
the movement to make scientific research, data, and dissemination transparent and widely accessible without barriers, financial or otherwise.
open source
when software is open source, users are permitted to inspect, use, modify, improve, and redistribute the underlying code. Many programmers use the MIT License when publishing their code, which includes the requirement that all subsequent iterations of the software include the MIT license as well.
OpenRefine
an open source data manipulation tool that cleans, reshapes, and batch edits messy and unstructured data.
operationalize
operationalizing variables means creating quantitatively measurable definitions of abstract concepts or constructs that cannot be measured directly.
ORCiD
unique identifier for members of the research community, defined by a permanent numeric code with two main functions: to link the person to their research activities, including their publications, and to distinguish them from others.
outliers
data points which dramatically differ from others in the dataset and can cause problems with certain types of data models and analysis.
p-sensitive k-anonymity
one of many privacy-protecting risk assessments based on k-anonymity but more restrictive.
password manager
a computer program that stores passwords. Some password managers also create and suggest complex passwords for use.
peer debriefing
the process of study team members questioning one another about what they have seen and heard. Such discussions are themselves sometimes included in a study’s final dataset.
persistent identifier (PID)
a long-lasting reference to a digital object that gives information about that object regardless of what happens to it. Developed to address “link rot,” a persistent identifier can be resolved to provide an appropriate representation of an object whether that objects changes its online location or goes offline (CODATA, CC BY 4.0).
population unique
a person in a population who may be identifiable because of some unique combination of demographic characteristics.
pre-prints
preliminary version of an article that has not undergone a formal peer-review process, but may be shared for comment. Pre-prints may be considered as grey literature.
PREMIS metadata standard
a metadata standard and data dictionary developed to standardize the way that preservation systems record and understand important concepts in the long-term preservation of a digital object. PREMIS flies can include technical information (e.g., file format information, checksums) as well as provenance information (e.g. changelogs, acquisitions information).
provenance
a record of the source, history, and ownership of an artifact, though in this case the artifact is computational.
qualitative data
data generated by research examining social aspects of the human condition using descriptive methods rather than measurement.
quartiles
the values that divide a list of numbers into quarters.
R object
a data structure that contains a set of values of a particular type. R objects can be created, modified, and used to perform computations and analyses.
raster data
data that represents spaces as a regular grid or series of cells, each with a particular value – often thought of as the pixels of an image. For example, a scanned historical map or an air photo.
ratio scale
a ratio numerical scale may increase or decrease according to a denominator rather than equal distances. On a ratio measurement scale, zero is not a point on the scale, but rather, means the absence of a value. Population density is an example of a ratio measure. In the case of population density, zero refers to a place with no human inhabitants.
RDM maturity assessment
an evaluation of the current state of RDM services and supports, usually at a specific institution.
RDM policies
higher level plans outlining generalized courses of action for RDM (e.g., Tri-Agency Research Data Management Policy).
RDM practices
specific enactment of RDM or support services (e.g., University of Alberta RDM; McMaster University RDM Services).
RDM principles
top level values or concepts intended to guide RDM overall (e.g., FAIR principles, OCAP® principles)
RDM strategies
mid-level plans intended to achieve a set of goals or priorities when managing research data (e.g., Dalhousie University Institutional RDM Strategy, University of Waterloo RDM Institutional Strategy Project).
README file
a plain text file that includes detailed information about datasets or code files. These files help users understand what is required to use and interpret the files, which means they are unique to each individual project. Cornell University has a detailed guide to writing README files that includes downloadable templates (Research Data Management Service Group, n.d.).
reflexive
reflexivity is the process by which qualitative research acknowledge, examine, and account for the impact their own judgments, practices, and beliefs have on data collection and analysis.
replicable research
replicable research is research which can be repeated by other researchers on new or different data, getting the same or similar results as the original researchers.
repository storage
a storage tier that supports deposit, storage, discovery, and appropriate access to authoritative copies of digital materials in a variety of formats.
reproducible research
reproducible research is research that can be repeated by researchers who were not part of the original research team using the original data and getting the same results.
research data
sources of information or evidence that have been compiled to serve as input to research.
research data lifecycle
the cycle in which data is collected, processed, analyzed, preserved, and then shared so other researchers can start the cycle anew.
Research Data Management (RDM)
a term that describes all the activities that researchers perform to structure, organize, and maintain research data before, during, and after the research process.
right to be forgotten
“the data subject shall have the right to obtain from the controller the erasure of personal data concerning him or her without undue delay and the controller shall have the obligation to erase personal data without undue delay” (GDPR.EU, 2018).
sample unique
an individual in a dataset whose information does not match any other individual in the dataset on the indirect identifiers.
script files
text files containing a sequence of R commands that can be run one after another
secondary analysis
research that uses data collected previously to conduct a new study.
self-determination
the right of Indigenous Peoples to determine what is best for their social, cultural, and economic development, and to carry out those decisions in a way that is best for their people. This definition is based on the United Nations Declaration on the Right of Indigenous Peoples (UNDRIP).
sensitive data
data which cannot be shared without potentially violating the trust of or risking harm to an individual, entity, or community.
signature
a series of bytes that occur in a predictable manner at the beginning and often the end of a file.
social sciences
a meta-disciplinary category encompassing scholarly disciplines that employ scientific methodologies and approaches to study social, cultural, affective, and behavioral human phenomena. Examples of social science disciplines include sociology, political science, economics, psychology, information studies, and more.
software container
like a self-contained virtual computer within a computer. It includes everything required to run a piece of software (including the operating system), without the need to download and install any programs or data.
survey piping
wording automatically inserted by survey software based on previous responses.
tab-separated values files (TSV)
a delimited text file that uses a comma to separate values within a data record.
tabular data
data arranged in the form of tables, i.e., in rows and columns.
tabular format
a format in which information are entered into a table in rows and columns.
TCPS 2
Tri-Council Policy Statement: Ethical Conduct for Research Involving Humans. The primary harmonized framework that accounts for Canadian-wide laws and broader ethical paradigms applicable to the rights of human participants in research
the agencies
the Natural Sciences and Engineering Research Council of Canada (NSERC), the Social Sciences and Humanities Research Council of Canada (SSHRC), and the Canadian Institutes of Health Research (CIHR) (the agencies) are Canada’s three federal research funding agencies and the source of a large share of the government money available to fund research in Canada.
traceable research
traceable research is research where external researchers can understand and repeat every change made to the raw data to get it into final shape for analysis.
traditional knowledge
collective knowledge of the traditions and practices that were developed over time and used by Indigenous groups to sustain themselves and adapt to their environment. Traditional knowledge is passed from one generation to the next within Indigenous communities. Indigenous knowledge comes in many forms including, storytelling, ceremony, dance, arts, crafts, hunting, trapping, gathering, food preparation and storage, spirituality, beliefs and worldviews, and plant medicines.
Tri-Agency Research Data Management Policy
a policy applying to data collected with research funding from one of Canada's three federal funding agencies. The policy is intended to encourage better research by requiring researchers to create data management plans and preserve their data.
unicode encoding
unicode is a character encoding standard that is not linked to any alphabet formats or encodings. It enables the exchange of texts in different languages.
vector data
data that comprises individual points that refer to specific locations. These points can be joined to form lines or enclosed shapes (polygons). The points, lines, and polygons can each be treated as individual units with associated data.
version control
a system for automatically tracking every change to a document or file, allowing users to revert to all previously saved versions without needing to continually save copies under different file names.
versioning
also known as version control, this means keeping track of the changes that are made to a file, no matter how small. This is usually done using an automated Version Control System, such as GitHub. Many file storage services, such as Dropbox, OneDrive, and Google Drive, keep historic versions of a file every time it is saved. These versions can be accessed by browsing the file's history.
Appendix 1: Data Management Plan Template
2
Data Collection
What types of data will you collect, create, link to, acquire and/or record?
What file formats will your data be collected in? Will these formats allow for data re-use, sharing and long-term access to the data?
What conventions and procedures will you use to structure, name and version-control your files to help you and others better understand how your data are organized?
Documentation and Metadata
What documentation will be needed for the data to be read and interpreted correctly in the future?
How will you make sure that documentation is created or captured consistently throughout your project?
If you are using a metadata standard and/or tools to document and describe your data, please list here.
Storage and Backup
What are the anticipated storage requirements for your project, in terms of storage space (in megabytes, gigabytes, terabytes, etc.) and the length of time you will be storing it?
How and where will your data be stored and backed up during your research project?
How will the research team and other collaborators access, modify, and contribute data throughout the project?
Preservation
Where will you deposit your data for long-term preservation and access at the end of your research project?
Indicate how you will ensure your data is preservation ready. Consider preservation-friendly file formats, ensuring file integrity, anonymization and de-identification, inclusion of supporting documentation.
Sharing and Reuse
What data will you be sharing and in what form? (e.g. raw, processed, analyzed, final).
Have you considered what type of end-user license to include with your data?
What steps will be taken to help the research community know that your data exists?
Responsibilities and Resources
Identify who will be responsible for managing this project’s data during and after the project and the major data management tasks for which they
will be responsible.
How will responsibilities for managing data activities be handled if substantive changes happen in the personnel overseeing the project’s data,
including a change of Principal Investigator?
What resources will you require to implement your data management plan? What do you estimate the overall cost for data management to be?
Ethics and Legal Compliance
If your research project includes sensitive data, how will you ensure that it is securely managed and accessible only to approved members of the project?
If applicable, what strategies will you undertake to address secondary uses of sensitive data?
How will you manage legal, ethical, and intellectual property issues?
Appendix 2: Sample of a Completed Section of the MAMIC
3
Note: the information below has been anonymized.
Section on Institutional Policies and Processes
This area of activity covers the development and maintenance of policies related to Research Data Management (RDM), and relevant processes that are related to supporting RDM services.
Hints to consider that will impact your assessment:
Scope (e.g. data stewardship, destruction of records, security and protection, etc.)
Research Ethics Board (REB) guidelines
Outreach plan
Other institutional materials that contain relevant components
Maturity Levels:
Not applicable
Skip this element
0 – Does not exist OR Do not know
1 – Element is not formalized or is ad hoc.
Policies and procedures may be undeveloped, not up to date, and/or inconsistent.
Some related policies may exist but are insufficient.
2 – Element is under development.
Policies and procedures are being conceptualized and formulated.
3 – Element is operationalized and launched.
Policies and procedures are defined and standardized.
4 – Element is robust and focuses on continuous evaluation.
Policies and procedures are subject to review and improvement.
Scale:
Not applicable – if 0 or NA are chosen for Maturity Level
Offered only to specific users upon request.
Available within certain units or cohorts.
Available to everyone.
Category: Institutional Policies and Processes
Element
Definition(s)
Maturity
Level
Scale
Your Comments
Institutional RDM Strategy
As defined by the Tri-Agency. This includes any Institutional RDM roadmap detailing how the strategy will be implemented.
1/2
3
Working group in place. Terms and Conditions of the Advisory Group drafted.
Institutional RDM-related Policies
Includes all relevant policies at the institution that may address RDM or components related to RDM.
1
3
Maybe ITS/Cybersecurity
“Responsible Conduct of Research” (link removed)
REB guidelines
Data Management Planning-related Procedures and Guidelines
Any institutional procedures or guidelines that outline how researchers should address data management plans (e.g., expectations of DMP creation, submission and/or review).
3
3
RDM librarian
Existing Portage resources
Institutional Research Computing Committee
Institutional ITS Cybersecurity
Security and Risk Assessment Policies and Procedures
Any institutional procedures or policies that address security and risk assessment related to research data (e.g., legal and privacy issues, vulnerability assessments, etc.).
2.5
2
ITS Security does assessment – Full security assessment for Sharefile
Risk Assessment Plan
User responsibilities.
IT users policy
Communication and Outreach Plan
Any plans for the promotion of RDM. This may include raising awareness of national policies and guidelines that affect RDM (e.g., Tri-Agency policies, funder policies, journal policies), and providing links and resources for best practices and tools.
1
3
RDM – Library
Webinars
Website – Institutional Strategy
Thoughts on longer term plan (advertised for whole institution to attend)
Name and role of person(s) who filled out this table: ITS, Library, Research Office
Appendix 3: Chapter 10 Exercises
4
Introduction
The purpose of this exercise is to demonstrate the relationship between open data, electronic lab notebooks (ELN), and software containers in reproducible research. You will interact with code in a published ELN, which is hosted in GitHub and made interoperable by myBinder. Many of the fundamentals you learned in chapter 10 will be illustrated here.
This exercise has both an introductory and an advanced activity. In the introductory activity, you will explore the code on GitHub and examine a static version of an ELN. In the advanced activity, you will launch a software container in an interface called Binder. The container hosts an electronic lab notebook that queries an open dataset. You can interact with it online without altering the original copy. The online container allows you to run the code without installing any programs on your computer. The advanced activity requires a higher knowledge of coding, or simply the perseverance to keep trying. The software container doesn’t always load on the first try, and the code won’t work unless it is perfectly entered. This exercise is meant to show benefits and complexity of reproducible research. Don’t be afraid to Google terms that you don’t understand. Additionally, ChatGPT is really good at explaining code and how it functions.
At the very end of the exercise there is a reflection question. You can answer this question even if you haven’t done the advanced activity.
Part 1 (Introductory): Explore the Data and the Code Repository
The Programme for International Student Assessment (PISA) is an international initiative that measures the educational attainment of 15-year-old students. The openly available dataset is available to researchers for their own analyses. This activity uses an analysis of the PISA dataset conducted by Klajnerok (2021), which was published to GitHub using a Jupyter Notebook.
The repository was forked into a new GitHub repository so we could use it for this activity: https://github.com/mediagestalt/PISA. In GitHub, a fork is a copy of a dataset that retains a link to the original creators (“Fork a repo,” n.d.). In the following image, you can see the fork symbol and a link to the dataset that precedes this one. These linkages are important as they show the provenance of the dataset.
Figure 1.Forked repository.
QUESTION 1: What is the name of the repository from which this code originated?
You can navigate GitHub as you would any nested file directory. In the image that follows, you will see a screenshot of GitHub. The filenames are in the left column, the middle column shows the comment that was left to describe the last changes to the file, and the right column shows the last time the file was edited. You can also see the last person that contributed to the code repository at the top left of the table and the versioning information at the top right of the table, shown in the following image as “83 commits.”
Figure 2.GitHub folders.
GitHub Folders
For the next question, find the following files in the repository. You will find the files in different folders, so don’t be afraid to look around.
requirements.txt
pisa_project_part1.ipynb
Click on the title of a file to view it. Then, scroll down to view the content of each file. You are looking for a list of dependencies, which are the software packages required to run the code in the notebook. In the pisa_project_part1.ipynb file, you will find the list under the heading “Extracting PISA dataset,” as shown in the following image.
Figure 3.Notebook dependencies.
QUESTION 2: Compare the dependencies listed in requirements.txt with those listed in the pisa_project_part1.ipynb notebook. What is different?
Answer: The requirements.txt file includes the version numbers of the dependencies; the notebook file simply lists the names. Versioning information for dependencies is very important because unknown changes to dependencies may prevent the code from working properly, or at all. This is a scenario where updating to the newest version of a program is not always preferred. Curating code for reuse is essentially freezing the code ‘in time,’ so that it runs exactly as it did when it was created.
The file names and directories show the importance of relative file paths. In the Git directory, find the location of the following .csv files and match them to where they are named in the notebook file.
pisa_math_2003_2015.csv
pisa_read_2000_2015.csv
pisa_science_2006_2015.csv. Hint: the files are listed in the second code cell below the dependencies.
Part 2 (Advanced): Run and Alter the Code
It is time to explore the software container. Since the original researcher wrote the code in a Jupyter Notebook (a commonly-used ELN), it is possible to ‘containerize’ the code and the data so that it can be run by other users.
Return to the main page of the GitHub repository, also known as the README file. Then, click on the launch binder button, shown in the following image.
Figure 4.Launch binder.
Depending on your computer and your internet speed, the software container may take several minutes to load. If it takes too long, just close the page and try launching again from the GitHub Binder link. You can see the Binder loading screen in the following image.
Figure 5.Launch binder 2.
When the notebook loads, scroll down and explore the page. The live notebook looks exactly like the notebook file you viewed in the GitHub repository.
As you examine the notebook, you will see narrative text interspersed with blocks of code inside defined cells. There is additional commentary inside the code cells. This is what literate programming looks like.
To make the next part of the activity easier, turn on the line numbers in the file. This will show a number on each line of the code block, making it easier to identify specific lines of code. The location of this command is shown in the next image. You won’t see an immediate change to the page, as this is just a setting change.
Figure 6.Toggle line numbers.
Now it is time to run the code. To start, you must run all of the code cells. The location of this command is shown in the following image. As you scroll down the page, you will begin to see new content below some of the code blocks. These are the results of the analysis for which the code was written. There may be text, tables, or visualizations.
Figure 7.Run all of the cells.
You will also see a number in square brackets in the left margin beside each block of code. Start at the beginning of the page and read down until you reach cell number 6. Don’t worry if you don’t understand the code. Pay more attention to the textual descriptions, and the comments inside the cells. You can identify a comment because it will be preceded by a [#] or [“””] symbol. Read the narrative descriptions until you reach cell #6. It is shown in the following image.
Figure 8.Cell 6.
QUESTION 3: What does the comment on line 14 of cell 6 say?
Answer: #extract PISA results for 2015. Hint: If you didn’t find it, use the ‘Find’ feature in your browser to search for the phrase. Then, you’ll see the line and cell number.
The PISA dataset in this project has data going back to 2000. We can load more data by altering the code. For the next part of this activity, you will need to add new code to the ELN and re-run the code block. To get the additional lines of code, go to this code snippet (called a Gist) in GitHub. It is an edited version of cell 6 in the notebook.
Line 14 in the Gist and line 14 in code block 6 in the notebook are the same. The ‘#’ before the text means that the line is a comment, not live code. Line 15 is where the code starts. In this Gist, there are extra lines of code below line 15 that don’t appear in the notebook. Copy the code from lines 16 and 17 and paste them in the notebook. Make sure the notebook matches lines 14-17 in the Gist.
Figure 9.Gist code.
This code is calling on the PISA dataset. Before you added the extra lines, the data from PISA was from 2015 only. Adding the two extra lines of code imports additional years of data from PISA (2012 and 2009). If you want to experiment more, you can add additional lines with different years. Just be sure to follow the format exactly as you see it.
Adding just these lines isn’t enough. You’ll need to follow the same process for lines #31 and #40. This code and more instructions can also be found in the Gist. Note that the line numbers in the notebook will change when you add additional code.
Once you’ve added the extra parameters to the notebook, re-run cell 6 in the notebook by clicking in the cell and pressing shift + return. If there are any errors, check your code for typos and try again. You can also use the Run > Run Selected Cells menu command.
From here on, the cell numbers in the notebook will change depending on how many times you run the code within that cell.
Next, keep your cursor in the cell you just edited, and then insert a new cell for each of the additional years you’ve added.
Figure 10.Add new cells.
Type the additional variable names for the years you’ve added into the new cells and press shift + return to run each one.
For example: all_pisa_2012.head() all_pisa_2009.head()
If there are errors, check for typos and try again.
See how many other cells you can get to work! Both with the existing variables, and the new variables you’ve created.
If you make a mistake and break the code beyond repair, you can check the source file to copy and paste the original code. You can also reload the file completely with File > Reload Notebook from Disk in the notebook top menu.
Reflective Questions
Based on what you’ve learned in chapter 10 and your exploration of the software container, what changes would you make to the structure of the file directory to improve the organization? Have the data and software been adequately documented? Work through the Reproducibility Framework (Khair, Sawchuk, and Zhang, 2019) to help with your assessment.
Is the provenance of these data clear to you? Explain.
What features of this dataset have enabled its reproducibility? What would you improve?
Chapter 7, Data Cleaning During the Research Data Management Process
Solution to exercise for Tip 01.
Solution to exercise for Tip 02.
Solution to exercise for Tip 03.
Solution to exercise for Tip 04.
Solution to exercise for Tip 06.
Solution to exercise for Tip 08.
Solution to exercise for Tip 09.
Chapter 8, Further Adventures in Data Cleaning
Exercise 1:
Solution to exercise 1.
Exercise 2:
There is one outlier based on the boxplot. We replace this outlier by NA. Then calculate the mean by removing all NAs.
>boxplot(mydata_csv$Width)
Exercise 2 boxplot
> summary(mydata_csv$Width)

Min.   1st Qu.  Median  Mean   3rd Qu.  Max.     NA's

2.700   3.000   3.500   3.814   3.750   7.000       1

> mydata_csv$Width[mydata_csv$Width==7] = NA
> mean(mydata_csv$Width, na.rm = T)

[1] 3.283333
The mean is 3.283333.
Chapter 13, Sensitive Data: Practical and Theoretical Considerations
Reflective Question 1:
Tri-Council Policy Statement: Ethical Conduct for Research Involving Humans – TCPS 2
Reflective Question 2:
Direct identifiers are any of the following:
Full or partial names or initials
Dates linked to individuals, such as birth, graduation, or hospitalization (year alone or month alone may be acceptable)
Full or partial addresses (large units of geography, such as city, fall under indirect identifiers and need to be reviewed)
Full or partial postal codes (the first three digits may be acceptable)
Telephone or fax numbers
Email addresses
Web or social media identifiers or usernames, such as Twitter handles
Web or Internet protocol numbers, precise browser and operating system information (these may be collected by some types of survey software or web forms)
Vehicle identifiers, such as licence plates
Identifiers linked to medical or other devices
Any other identifying numbers directly or indirectly linked to individuals, such as social insurance numbers, student numbers, or pet ID numbers
Photographs of individuals or their houses or locations, or video recordings containing these; medical images or scans
Audio recordings of individuals (Han et al., 2020)
Biometric data
Any unique and recognizable characteristics of individuals (e.g., mayor of Kapuskasing or Nobel prize winner)
Quasi-identifiers may include any of the following:
age (can be a direct identifier for the very elderly)
gender identity
income
occupation or industry, job-related variables
geographic variables
ethnic and immigration variables
membership in organizations or use of specific services
Many other examples exist!
Reflective Question 3:
Both location variables that may pinpoint the whereabouts of an endangered species could be considered sensitive data
Chapter 14, Managing Qualitative Research Data
Self-Assessment Question 1:
highly disclosive; can be difficult to de-identify; predominantly voice or text based; collected from humans; context dependent; often collected from marginalized communities or vulnerable individuals; often come from highly sensitive research topics; are less likely to be archived, shared, and reused
To document activity and decision making throughout the life of a study, helping detail what took place, when, and why
Self-Assessment Question 4
capturing; processing; securing or backing up; transferring for transcription; transferring to other team members; translating
Self-Assessment Question 5
original recording; original transcript; verified transcript; anonymized transcript; edited transcript; coded transcript
Self-Assessment Question 6
Co-production is intended to bring together the complementary expertise of qualitative researchers and librarians/archivists/data specialists to establish and advance standards for managing qualitative data.
Chapter 17, Research Data Management and the Open Science Movement
Reflective Question 1:
Both definitions mention the importance of research collaboration as an important aspect of open science. The free availability of research results is also a common feature, although the Foster Open Science definition places much greater emphasis on traditional open access and is in this sense more reductive. Vicente-Saez and Martinez-Fuente’s definition speaks more of access and sharing than of open access as such, since sharing may be subject to legal or ethical restrictions. This definition is therefore more in line with the FAIR principles than that of Foster Open Science. The principles of transparency are also less developed in the Foster Open Science definition. It only mentions conditions favoring reuse, without being explicit about these conditions, and makes no reference to quality assurance and auditing, which are facilitated by transparency principles.
Reflective Question2:
Answers may vary according to someone’s point of view and expertise, and could include examples outside those listed in this chapter. However, Table 2 indicates that the pragmatic school of thought frequently shapes open science. Examples include open research protocols, academic social networks and other collaborative platforms, such as electronic lab notebooks, and finally open peer review.
Reflective Question3:
False. Commercial publishers have consolidated their position by making article processing charges the predominant open access business model, and we cannot rule out that acquiring infrastructure linked to research data is not in their line of sight. Elsevier already offers its data repository, Mendeley Data. The Scholarly Kitchen blog regularly discusses acquisitions and mergers in the field of healthcare publishing. Take a look at this example: “Elsevier to Acquire Interfolio.”
Reflective Question4:
For qualitative research, the production of research data is often dependent on the context in which it was produced. Thus it is problematic to think of reproducibility if research contexts are unique. Reproducibility in qualitative research must therefore be considered in light of various epistemological postures, which themselves call for their own methodologies and analytical guidelines.

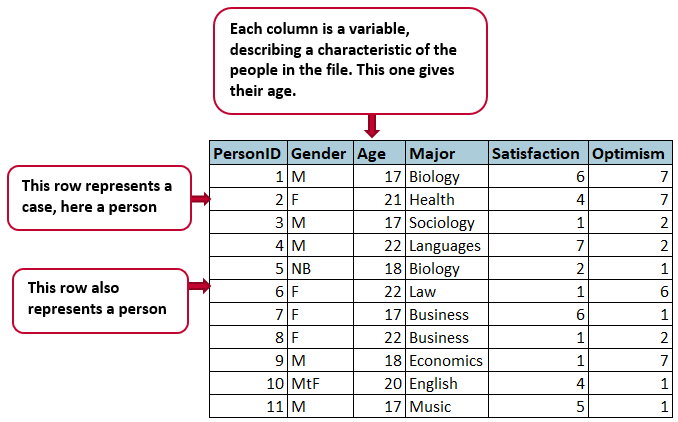
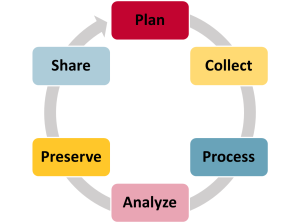
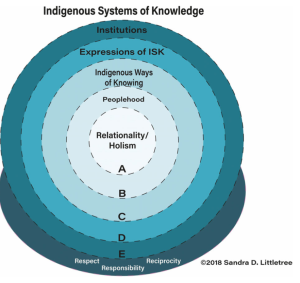
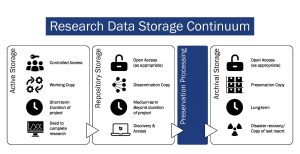
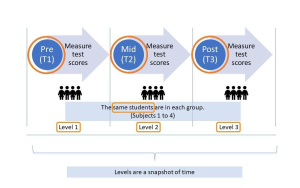
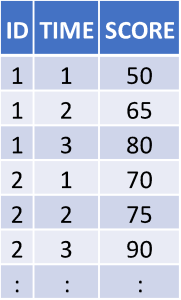
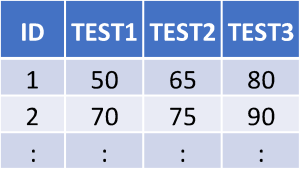
 Finding misspelled words and inconsistent spellings is one of the most important data cleaning tasks. You can use a spell checker to identify and correct spelling or data entry errors.
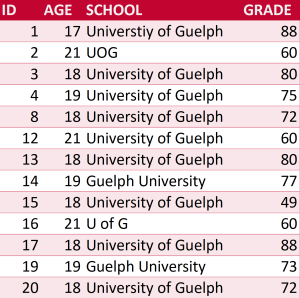
 Sometimes data have been manually entered or generated using methods that could cause duplications of rows. Check rows to determine if data have been duplicated and need to be deleted. If each row has an identification number, it should be unique for each observation. In this example, there are two observations with an ID number of 3 (Table 4) and both have the same values, so one of these rows of data should be deleted.
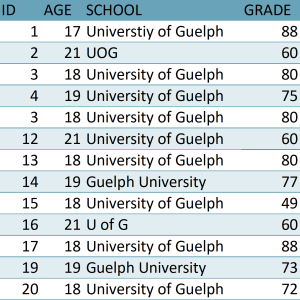
 With some carefully crafted replacements, it’s possible to get data fairly clean and into a good format by looking for patterns and repetition in a file. In this example, we’re counting the number of bird sightings in Guelph. Looking at the LOCATION column, we need to replace the abbreviations “St” and “ST” with the full spelling of “street” (Table 5). This can be done using the basic Find and Replace function.
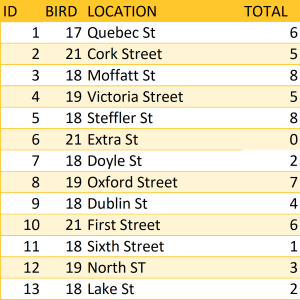
 Text may be lowercase, uppercase (all capital letters), or proper case (only the first letter of each word capitalized). Text can be converted to lowercase for email addresses, to uppercase for province abbreviations, and to proper case for names. In this example, the text case is not consistent in the table. Sometimes names and emails are a mix of uppercase, lowercase, and proper case (Table 6).
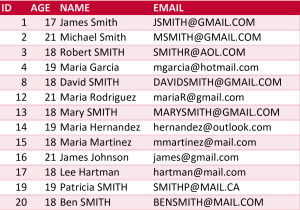
 Spaces and non-printing characters can cause unexpected results when you run any type of sort, filter, and/or search function. Leading, trailing, and multiple embedded spaces or non-printing characters are invisible. They can sneak in when you import data from web pages, Word documents, or PDFs.
 You may obtain a dataset with variables defined as strings (these may include numbers, letters, or symbols). Numeric functions, such as addition or subtraction, cannot be used on string variables, so in order to run any sort of quantitative data analysis, you’ll need to convert values in string format to numeric values. Looking at the table of bird sightings (Table 7), there is a column indicating whether the bird is a juvenile. To run quantitative data analysis, you’ll need to convert string values of “no” to the numeric value of 0 and string values of “yes” to the numeric value of 1. Leave the original JUVENILE column for reference and create another column with the numeric values. The original column is used to verify the transformation of the new column and is deleted once the transformation is confirmed to be correct. For this example, the new column, JUVENILE _NUM, contains the numeric values of the string values from the JUVENILE column (Tip 06 Exercise).
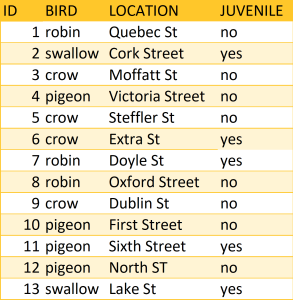
 There are many ways to format dates in a dataset. Sometimes dates are formatted as strings. If date data are needed for analysis, then at a minimum, change the field type from “string” to “date” so dates are recognized in the analysis tool of choice. With time values, you will need to select a convention and use it throughout the dataset. For example, you can choose to use either the 12- or 24-hour clock to define time in a dataset, but whichever you choose, you should be consistent throughout. You may also need to change the format to ensure that all dates and times are formatted in the same way.
 After closer inspection of the newly acquired dataset, there may be a chance to either (1) merge two or more columns into one or (2) split one column into two or more. Retain the original columns used to merge or split the columns. Then, use the original columns to verify the transformation of the new column and delete the original once the transformation is confirmed to be correct. For example, you may want to split a column that contains a full name into a first and last name (Table 8). Or you may want to split a column with addresses into street, city, region, and postal code columns. Or the reverse might be true. You may want to merge a first and last name column into a full name column or combine address columns.
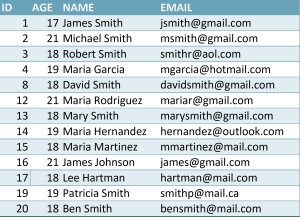
 Sometimes data files contain information that is unnecessary for an analysis, so you might want to create a new file containing only variables and/or observations of interest, which will involve selectively removing unwanted columns and/or rows. In this example, the researcher removed the JUVENILE column (Table 9). Or you may need to investigate only certain observations in the file, so you can delete rows in the dataset. In this table, all swallow observations will be deleted. One advantage of this type of cleaning is that programs will run more quickly because the data file is smaller.
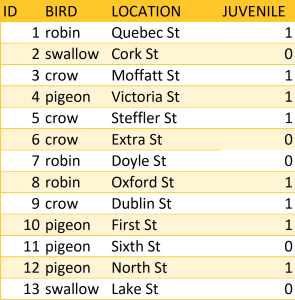
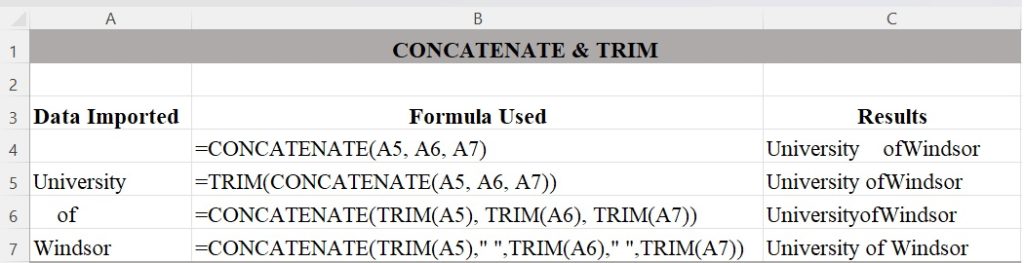
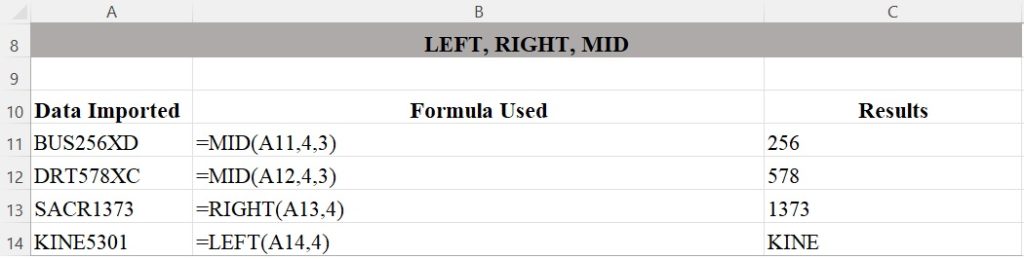
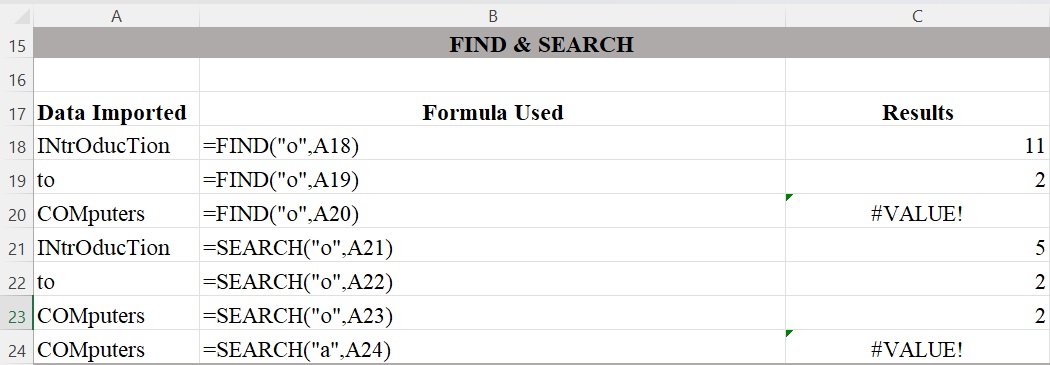
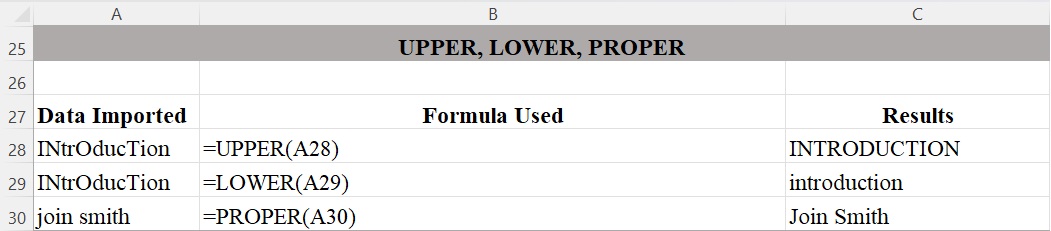
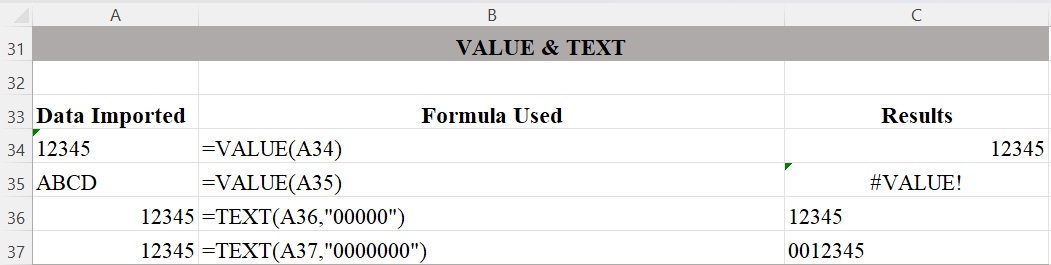
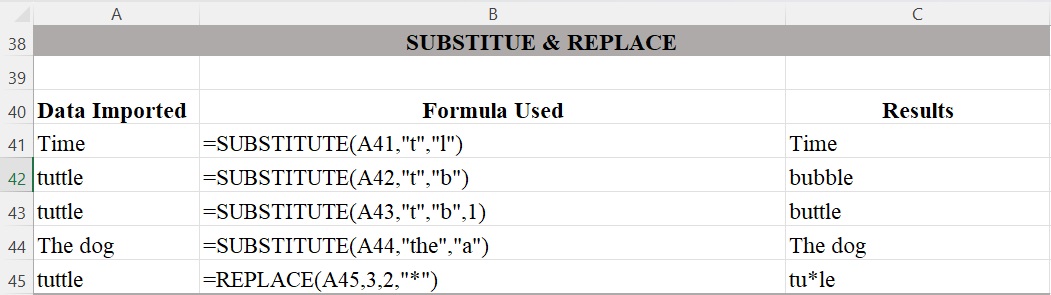
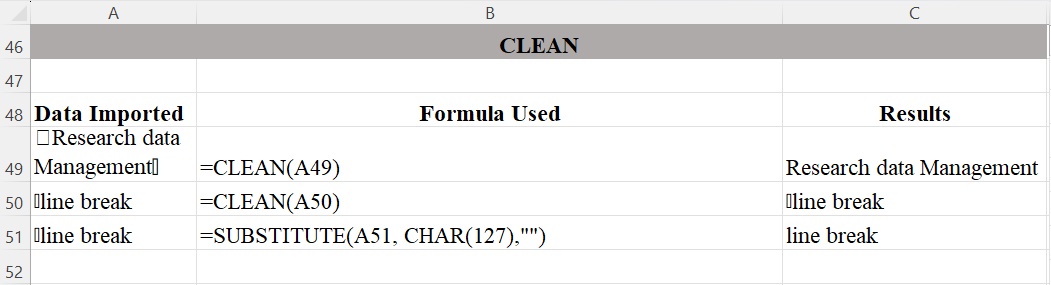
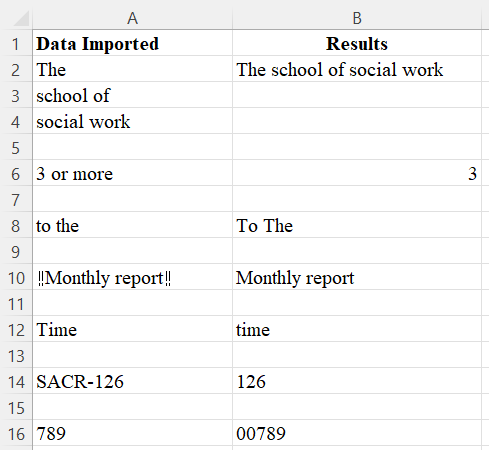
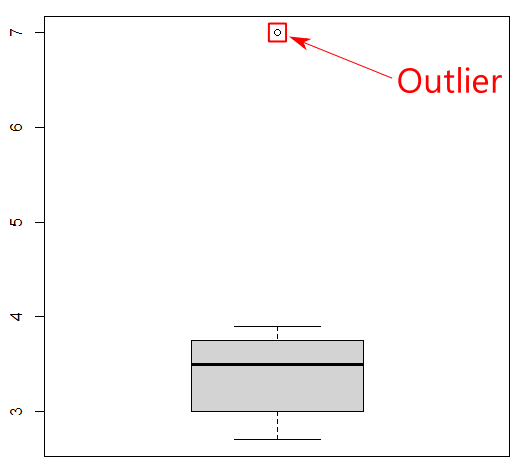
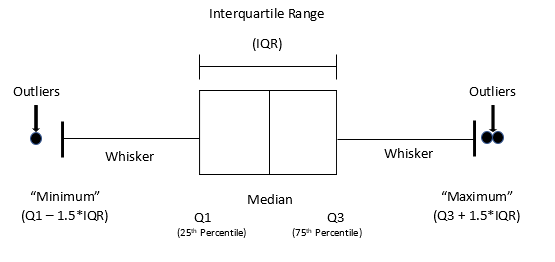
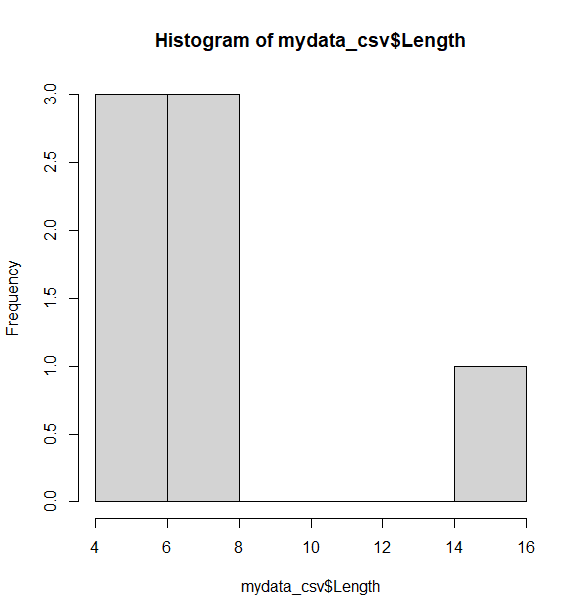

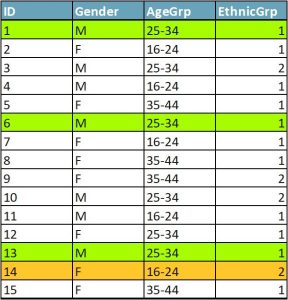
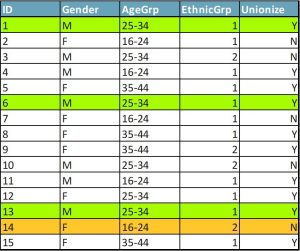
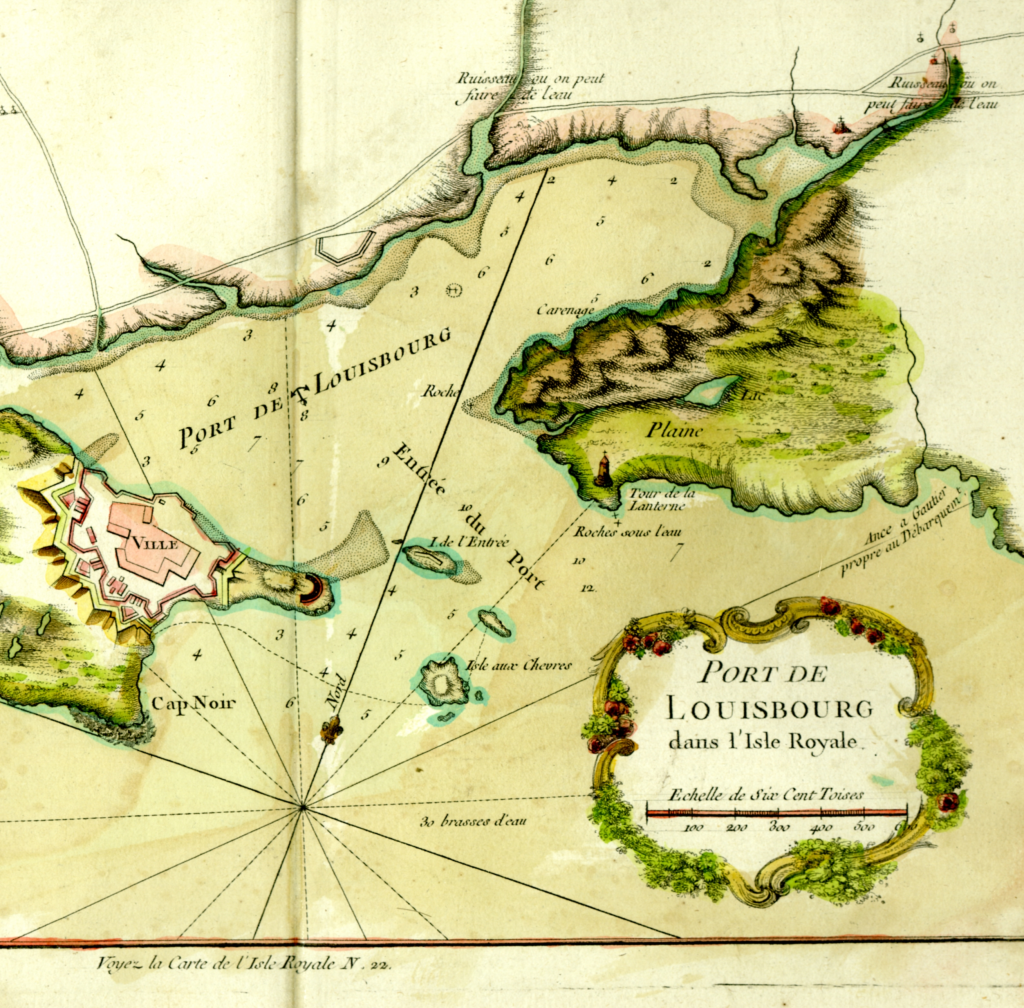
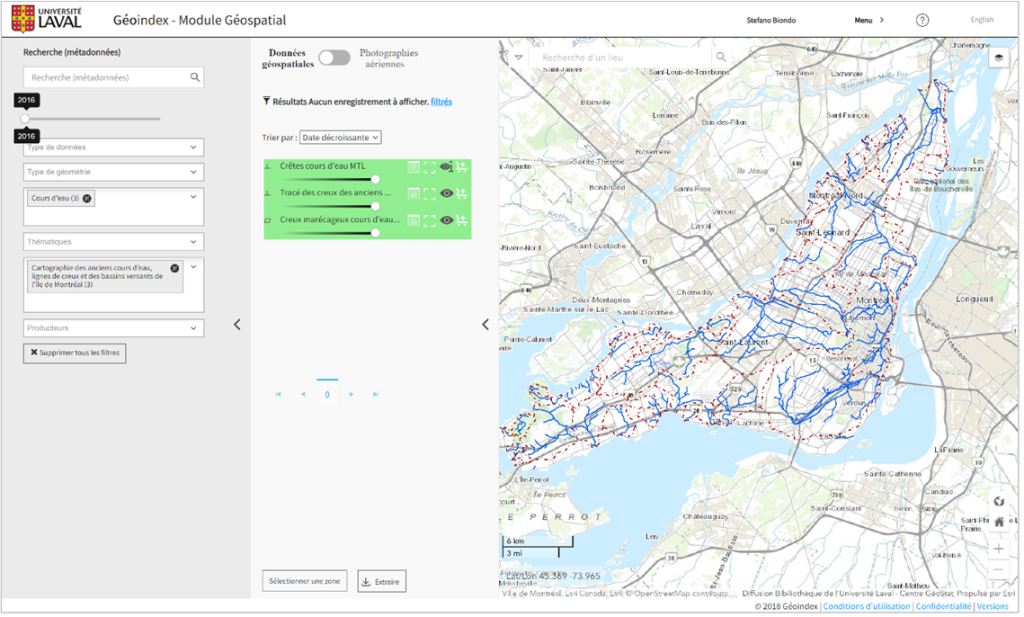
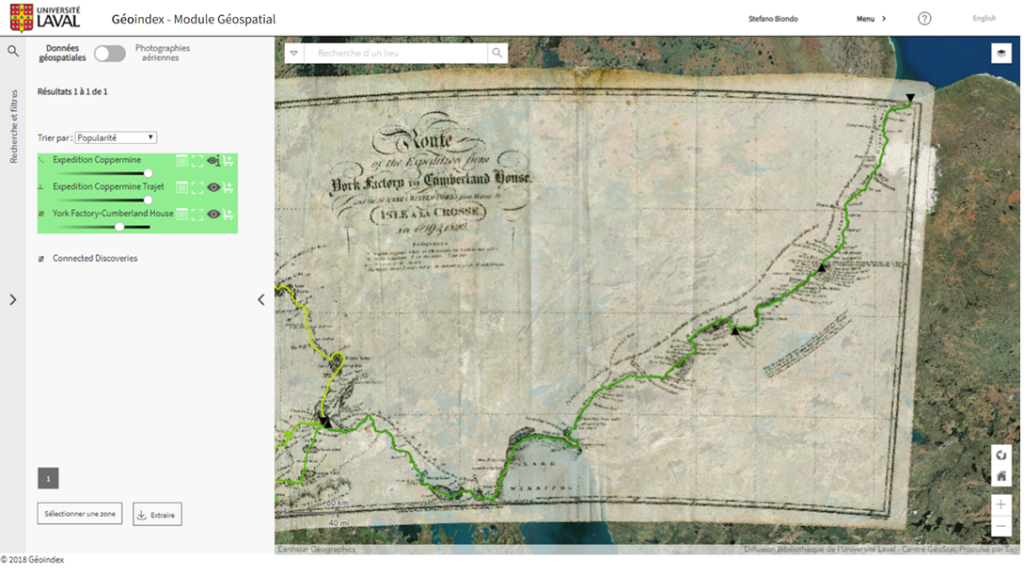
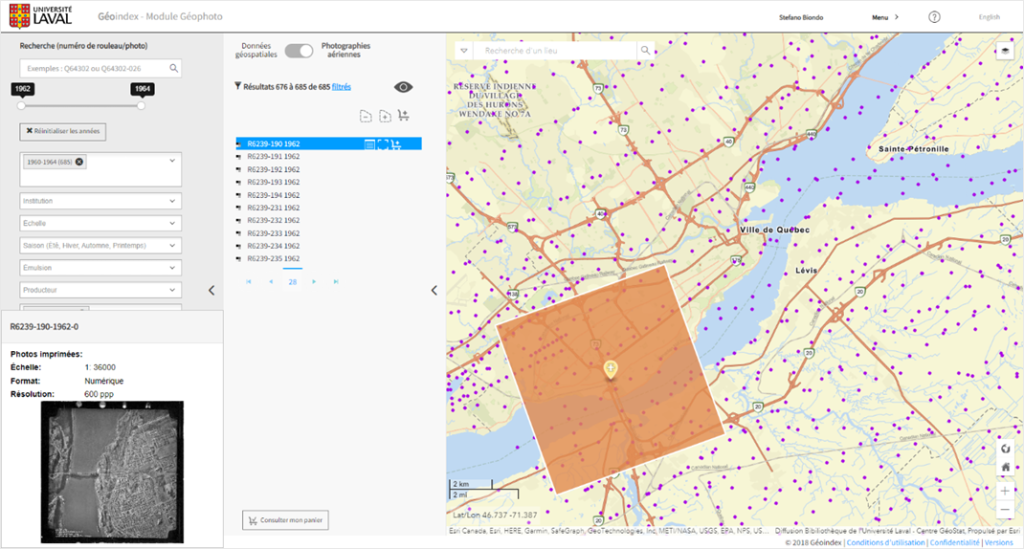
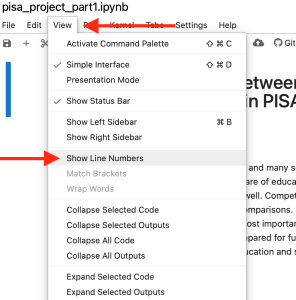
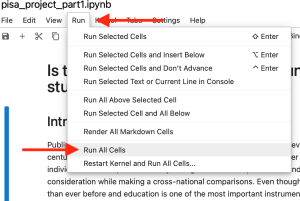
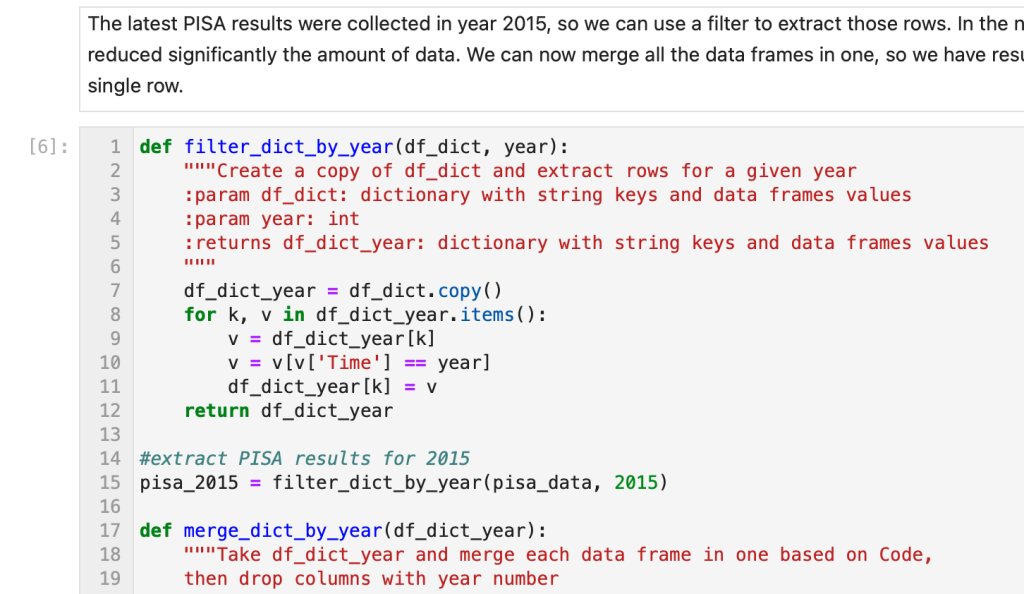
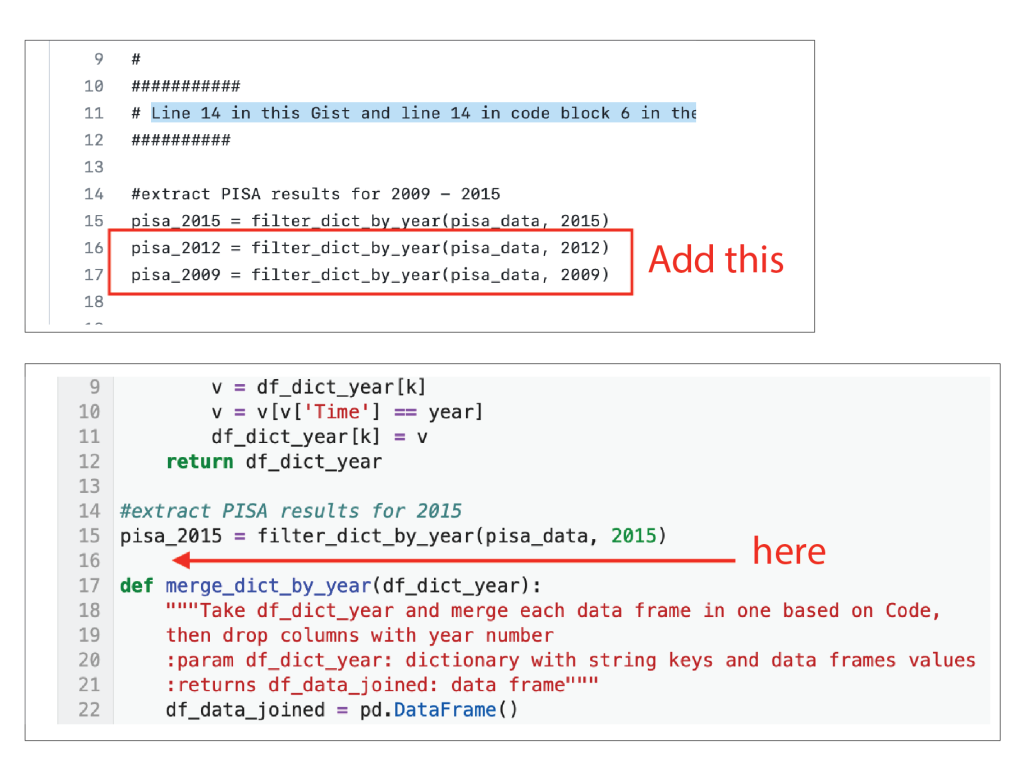
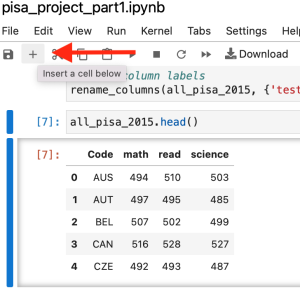
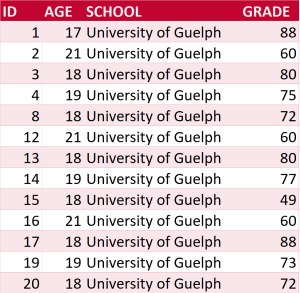


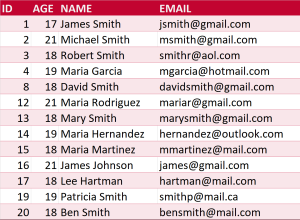

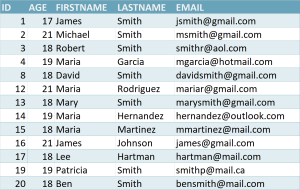
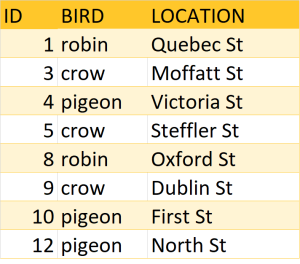

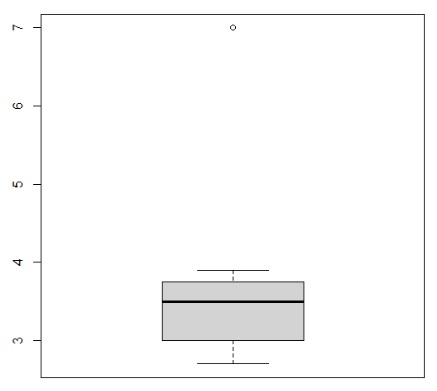