
Using the Hypothesis Tool in a Synchronous Learning Environment by Dorina Grossu is licensed under a Creative Commons Attribution 4.0 International License, except where otherwise noted.
Using the Hypothesis Tool in a Synchronous Learning Environment by Dorina Grossu is licensed under a Creative Commons Attribution 4.0 International License, except where otherwise noted.
The Hypothes.is tool was applied in the synchronous learning environment to connect and engage the students by using the social and learning collaborative approaches. The course was Current Topics in Quality Engineering, and data was collected during the 2020 fall semester. The study areas in this course were Research Techniques, Quality Tools, Quality 4.0, Industry 4.0, and Emerging Technologies. All the course participants were international students.
Data was collected from 95 of the students across the three class sections. Eight articles were uploaded in the Hypothes.is and students had to annotate and discuss during the synchronous learning classes. At the end of the course, students had a final exam that included all the course modules. Students have never been exposed to the Hypothes.is a tool and have never used any social annotation (SA) tools.
The intent of this study was to create a model that can be applied in the learning environment where students have access to Hypothes.is tool, and then to be able to analyze the results by using the machine learning algorithms.
Based on the study and data interpreted using the machine learning tool, this paper concludes that students who participated directly during the synchronous learning and accessed the course material available in the Hypothes.is tool performed better in the final test than students who did not access the tool. The use of the machine learning correlation analysis algorithm has shown that data can be continuously collected during the semester, and the learning outcomes can be predicted. It can be used as a tool that would help teachers to further adapt their teaching methodology to the online classes.
Keywords: Quality and technology topics, Hypothes.is, social annotation tool and system, online engagement, collaborative learning, machine learning evaluation tool, social pedagogy
In the course Current Topics in Quality Engineering, students were required to perform scientific research by accessing the resources from scientific journals and publications. They were expected to debate the applicability of traditional quality management practices in today’s business environment to determine to what extent they maintained relevance while evaluating the impact of technological changes. The students were also required to assess the current thinking and practices in quality engineering to comment on the efficacy of such practices. Their assessments and efficacy of the Research Techniques, Quality Tools, Quality 4.0, Industry 4.0, and Emerging Technologies had to be justified and completed by engaging in conversations during the online sessions using the Hypothes.is social annotation tool.
Annotations are remarks attached to specific parts of a document. A digital annotation tool provides the capability to make annotations to online material. When this tool enables users to share their annotations with a community, it is called social annotation tool (SA) (Krouska et al., 2018), while the documents that are annotated are more likely to be recalled than those that are not (Yang et al., 2011).
In this study, the data was collected to analyze whether the students who attended the classes and engaged online during the synchronous learning through self-directed participation, while using the social annotation tool Hypothes.is, performed better in the final test.
The course outline was modified to meet the demand for online delivery that started in March 2020 due to the COVID-19 pandemic. Students had to develop the skills and knowledge required for the online learning environment, which included conducting research using a variety of validated and credible resources that met the course outline. On the other hand, instructors had to adopt a different approach to teaching, type of resources used during the online classes, and associated tools.
Students had to participate online in discussions, and they had to either write the answers in the Hypothes.is tool or discuss their understanding. In some lessons, they had to investigate and discuss current and future events, or issues in the Quality Tools, Quality 4.0, Industry 4.0, and Emerging Technologies environments.
Social annotation (SA) tools can be useful to the learning process, as they provide efficient and effective knowledge dissemination. Incorporating such a tool in e-learning environments helps students because it can function as an aide-mémoire; students can use highlights and bookmarks, share material through commenting and attaching files, and interact with others by questioning and replying (Sanderson et al., 2013). Thus, it is beneficial to instruction, as well as increases participation and engagement. Moreover, it promotes communication and peer review, which is especially needed in project-based learning.
Using this social annotation tool, created a social engagement environment for students as they had to read the selected paragraphs during the online classes and then answer the questions posed by the instructor. The material included on the course slides was complemented with articles uploaded in the learning management system and posted in the Hypothes.is tool.
Several studies of social annotation model learning systems that incorporate aspects of instructional design, social annotation technology, and team-based learning suggest that students may achieve better outcomes in reading comprehension and meta-cognition (Johnson et al., 2010). Studies on the cognitive processes engaged when using the social annotation reveal that increased annotation may be associated with successful group inquiry learning, as well as the number of individual annotations (Hwang et al., 2007). Based on the study performed by Hwang et al. (2007), an “annotation system can raise students’ learning achievements in most scenarios” (p. 18).
To assess whether the use of the social annotation tool and online participation made a difference in the synchronous learning environment, the students had a final test. The final test questions were from the entire course material and required that students had a good understanding of all the theoretical concepts and examples that were presented.
Hypothes.is tool that was used in four large topics that were covered throughout the course: Quality Topics, Industry 4.0, Quality 4.0, and Emerging Technologies. In total, eight articles were uploaded in the Hypothes.is tool.
The student’s access frequency, posted comments and passive participation data were collected and identified as follows:
0- Did not access the Hypothes.is tool 1- Accessed the Hypothes.is tool
2- Participated by posting comments, ideas etc. in the Hypothes.is tool
At the beginning of the semester, students were asked questions regarding their likelihood to participate by using the Hypothes.is tool, acceptance level on sharing and participating during the online classes by using the Hypothes.is tool and technological challenges when accessing the tool. (See Tables 1 to 3.)
Table 1
Hypothes.is tool accessibility
| Question 1 | Yes | No |
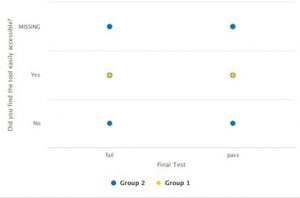
| Did you find the tool easily accessible from smartphones and laptops/computers | 63 | 6 |
Table 2
Hypothes.is tool accessibility
| Question 2 | Promoters (scale 9-10) | Passives (scale 7-8) | Detractors (scale 6-1) |
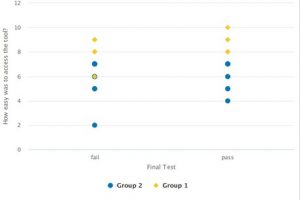
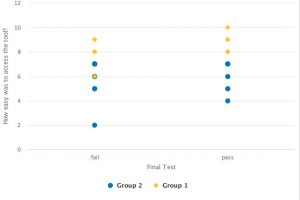
| How easy was it to access the tool | 16 | 37 | 16 |
Table 3
Hypothes.is tool accessibility
| Question 3 | Promoters (scale 9-10) | Passives (scale 7-8) | Detractors (scale 6-1) |
| Do you like to post your answers in the Hypothes.is tool? | 20
| 30
| 19
|
The questions asked during the semester are listed (see Table 4). Questions were based on Bloom’s Taxonomy. The type of activity expected is also inserted (see Table 4). The articles were annotated either individually or reviewed and discussed in groups.
Table 4
Questions asked during the synchronous classes- Hypothes.is social annotation tool
| Week Number and Questions | Type of knowledge Activity | |
|---|---|---|
| Week 3 What type of data was collected? What quality tools were used? Each student to present in a paragraph the conclusions that were found through data and link to the response to the hypothesis that was formulated in the Word doc. This is an individual work during the online session. | Knowledge, presentation, Individual work | |
| Week 5 Write why do you think that the quality tools were not linked to the specific organization’s performance? What was missed? Explain and justify your answer based on the article provided. How would you select the criteria to determine the tools to be used? Students to work in groups during the online session.
Week 6 Select 1 case from the list and draw the conclusions by highlighting the results obtained. After your answer here (Hypothesis.is) access the Team and copy or record your answer in Quality 4. One answer per group but list all the team members who participated.
W eek 7 Let’s Get Digital: The many ways the fourth industrial revolution is reshaping the way we think about quality- students to discuss the challenges in Industry 4.0.
Week 9 Review the pro-cons in Table 3. What difficulties do you see if you would follow this model to implement Quality 4.0? What happens when companies don’t have a quality system that is at a high level of compliance? What type of difficulties do you see? Explain! This model shows weaknesses. Still, where do you think that it could potentially be implemented? Describe! If you compare this model to model 2, what are your observations? | Thinking, analyzing information, selecting criteria Group work
Case selection based on criteria, debate during online class Group work
Discussion online
Data analyses, Decision makers, Data Modeling, and comparison. Individual work |
| Week 10 How open should be HR policies and practices around the world? Describe. Include your comments and critique the 2 strategies. What changes are required in Quality 4 from the People’s perspective?
Week 12 Find articles about online incivility and its manifestations. Post the article link on padlet. Note: Students had an article already available in Hypothes.is as a model.
Week 13 Read the article and then review the paragraph that is annotated. Why there are so many “steps”? Share your thoughts. What skills do you need to have to be able to participate while further improving your knowledge, communities, and general wellbeing?
This is individual work during class. | Behavioral challenges, Understanding Individual Work
Discussion, Behavior, open social environment
Self-regulation, self-learning, Communication Individual Work
|
Note: Table that shows the weeks when the Hypothes.is tool was used, questions that were asked, and whether it was a group or individual activity.
At the end of the semester, the students had a final test comprised of 60 questions. Among these questions there were six questions from the articles posted in the Hypothes.is tool representing 10% of the test grade. The passing grade for this course was 55% and the final test made up 15% weight of the overall grade. The previous classes that attended this course did not have a final test, therefore, the intention of introducing a final test was to verify whether the students who attended the online classes and participated by using the Hypothes.is tool can acquire a higher grade (see Fig. 4).
The data collected was interpreted by using the machine learning RapidMiner (Go and Studio versions) to better understand the social engagement and the final test results when using the Hypothes.is tool.
The total number of students who responded to the questions asked at the beginning of the semester regarding the use of Hypothes.is tool, was 64.21%. (See Table1.) The correlation between the final test results and questions asked is presented (see Figures1, 2, and3).
There were several challenges when interpreting the data by using the machine learning RapidMiner due to inconsistency in student participation during the online classes. Although students discussed and presented their views when they answered questions, not all of them wrote or participated actively during the online classes. Since the low level of online participation is not discussed here, the results are presented as a correlation between active participation (synchronous classes) and final test results (see Figure 6).
What we can observe from the machine learning data interpretation is that students who participated in weeks 3, 5, and 6 achieved a higher grade in the test. The topics in those weeks were Industry 4.0 and Quality Tools (see Figure 6 and Table 5).
Table 5
K-mean Centroid Table
| Cluster | Final exam | Week 10 | Week 12 | Week 13 | Week 3 | Week 5 | Week 6 | Week 7 | Week 9 |
|---|---|---|---|---|---|---|---|---|---|
| Cluster 0 | 52.915 | 0.630 | 0.074 | 0.185 | 1.593 | 1.111 | 1.704 | 0.741 | 0.852 |
| Cluster 1 | 55.143 | 0.138 | 0.034 | 0.034 | 1.655 | 0.724 | 0.586 | 0.138 | 0.276 |
| Cluster 2 | 37.928 | 0.148 | 0.037 | 0.074 | 0.667 | 0.630 | 0.593 | 0.296 | 0.333 |
| Cluster 3 | 52.585 | 1.167 | 0.833 | 1.500 | 1.583 | 0.750 | 1.250 | 0.750 | 1.167 |
Note: There are 4 K-mean clusters and Cluster 1 has the Final exam higher than 55.143. A strong correlation is seen in Week 3, 5, and 6 as the K-means values are the largest as 1.655, 0.724, and 0.724.
Not surprisingly, as shown in Figure 4, online class attendance decreased as the course reached the final weeks. The results could easily be correlated with the assignment results and the intensive work that students had to perform in other classes.
The reason for using the clustering technique in Machine Learning was to determine the specific properties as the following explanation is available:
Clustering is a machine learning technique that involves the grouping of data points. Given a set of data points, we can use a clustering algorithm to classify each data point into a specific group. In theory, data points that are in the same group should have similar properties and/or features, while data points in different groups should have highly dissimilar properties and/or features. Clustering is a method of unsupervised learning and is a common technique for statistical data analysis used in many fields. (Seif, 2018).
There are 4 K-clusters used in this study considered as per the following information:
K-means clustering is the most commonly used unsupervised machine learning algorithm for partitioning a given data set into a set of k groups (i.e. k clusters), where k represents the number of groups pre-specified by the analyst. It classifies objects in multiple groups (i.e., clusters), such that objects within the same cluster are as similar as possible (i.e., high intra-class similarity), whereas objects from different clusters are as dissimilar as possible (i.e., low inter-class similarity). In k-means clustering, each cluster is represented by its center (i.e., centroid) which corresponds to the mean of points assigned to the cluster (Sharma, 2019).
Reviewing data, we can see that a higher grade was achieved by students who directly participated by using the Hypothes.is tool during the classes in Weeks 3, 5, and 6 (see Table 5 and Figure 5).
The beneficial effect of the online active engagement through Hypothesis.is tool is emphasized as students demonstrated social participation while engaging with technology and each other. The method of teaching through the social annotation tool does set up the environment for cooperative learning which is one of the main characteristics of creating a positive influence and engaging students during online classes. (Brown, 2020). The learning techniques presented some challenges as students have not been previously exposed to learning that required the use of a social annotation tool.
It is the social pedagogy that can be reflected in the way the students learn by engaging with each other while reviewing the annotations that each made during learning. Understanding social pedagogy was one of the important lessons that I ascertained when using the Hypothes.is tool. Social pedagogy work has a holistic approach. I had the chance to directly experience how the knowledge incorporated in education, pedagogy, philosophy, sociology, medical science, etc. was enhanced when using this social collaborative tool. I always consider student’s well-being who attends online classes. It is also important to balance the amount of student’s work during the online classes with an appropriate number of questions that have a complex enough level of detail. The material was uploaded prior to each class, but the students did not read them prior to the class. The humanistic values are stressed through social pedagogy while ensuring our human dignity, mutual respect, trust, unconditional appreciation, and equality. Trying to balance the multilevel approach was surprisingly challenging, but worth the effort as many students had their first experience to learn by using the social and collaboration tools. Students who were mostly interested in social justice have shown online participation in Week 13. My direct experience acquired in social pedagogy will continue to improve as there is still a large area of social pedagogy that has not been fully explored while using the Hypothes.is tool. An area that I did not explore with the students was debating their own ideas while organizing them in teams.
Many students understood and responded positively to social pedagogy and as a result the work they completed during Weeks 3, 5 and 6, led to higher scores obtained in the final test (see Figure 6). If data is presented to students, they would discover that we all want the best outcomes for their future life. The topic subjects through this course required that I also used critical pedagogy, as the paragraphs are given had to be discussed, taken apart, and then recomposed by students.
Writing this paper has been important to me, as it unveiled through data collected, that large opportunities exist for students when learning in a social and collaborative learning environment. Students who were engaged online and participated in discussions while using the Hypothesis.is tool performed better in the final test. Also, the study shows that there is a large variation within the course modules that were accessed by students, and this could very well be their personal topic preference.
Using machine learning algorithms to better understand the data and how to make changes in a synchronous learning environment requires constant monitoring of students’ interactions.
While a life-long learner is required to participate socially and engage online, this paper addresses the need for some changes regarding the environment in which one learns, as there is many students who are not using the social annotation tools in the synchronous learning environment.
A. Krouska, C. Troussas and M. Virvou, 2018. “Social Annotation Tools in Digital Learning: A Literature Review,” 9th International Conference on Information, Intelligence, Systems and Applications (IISA), Zakynthos, Greece, 2018, pp. 1-4, https://doi.org/10.1109/IISA.2018.8633609.
S. J. Yang, J. Zhang, A. Y. Su and J. J. Tsai, 2011. “A collaborative multimedia annotation tool for enhancing knowledge sharing in CSCL,” Interactive Learning Environments, vol. 19, no. 1, pp. 45- 62.
R. Sanderson, P. Ciccarese and H. Van de Sompel, 2013. “Designing the W3C open annotation data model,” In Proceedings of the 5th Annual ACM Web Science Conference, pp. 366-375.
Johnson, T, Archibald, T and Tenenbaum, G., 2010. Individual and team annotation effects on students’ reading comprehension, critical thinking, and meta-cognitive skills. Computers in Human Behavior, 26(6).
Hwang, W-Y, Wang, C-Y and Sharples, M., 2007. A study of multimedia annotation of Web-based materials. Computers & Education, 48(4): 680–699
Brown, M. and Croft, B., 2020. Social Annotation and an Inclusive Praxis for Open Pedagogy in the College Classroom. Journal of Interactive Media in Education, 2020(1), p.8. http://doi.org/10.5334/jime.561
G. Seif, 2018. https://www.kdnuggets.com/2018/06/5-clustering-algorithms-data-scientists-need-know.html.
P. Sharma, 2019. Analytics Vidhya https://www.analyticsvidhya.com/blog/2019/08/comprehensive-guide-k-means-clustering.
Figure 1
Correlation between Test results and questions asked
Note: Students were asked at the beginning of week 4 to evaluate the tool. The total percentage of the student population who answered the questions was 64.21%. Graph that shows the final test result based on tool access although the final test had only 10% of the total questions from the articles posted on Hypothes.is.
Figure 2
Correlation between Test results and questions asked
Note: There were some students who had challenges accessing the tool at the beginning. Only 10% of the total test had questions from the articles posted in Hypothes.is
Figure 3
RapidMiner Go ML was used to correlate the results from Question 3 with the Test results
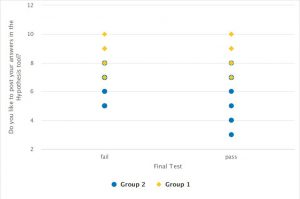
Note: It shows the correlation between students who “pass” even so they did not line to post their answers in the social annotation tool
Figure 4
Weekly in-class participation for 3 sections
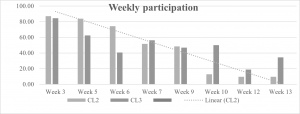
Note: CL1, CL2, CL3 are the 3 sections and weekly participation. During the first weeks, there were more students participating online
Figure 6
Final Test and weekly participation correlation analysis.
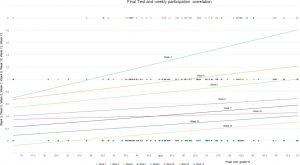
Note: The software used was RapidMiner. Regression interpolation lines are providing information regarding the correlation between online participation and test results.